


Hello Friends! Thanks so much for stopping by and visiting my blog, Stock Picks Bob's Advice. As always, please remember that I am an amateur investor, so please remember to consult with your professional investment advisors prior to making any investment decisions based on information on this website.
 I received an email from a new investor who asked me about how I go about picking stocks and what stocks are in my trading portfolio. I will answer the latter part elsewhere but I would like to use this "stock pick" to explain my thinking and my process in selecting stocks for consideration for investment. Please always remember that I truly AM an amateur, so realize that there are probably many better ways to select stocks. Be that as it may, let me share with you my own perspective!
 My first place I go in my 'search' for new ideas is the list of top % gainers. I have been using the money.cnn.com website, and today, looking through the list of top % gainers on the NYSE, I came across Stryker (SYK), which, as I write, is trading at $48.07, up $1.73 or 3.73% on the day. Why Stryker? For one thing, this is a name that is familiar to me having reviewed it previously. In fact, I posted Stryker (SYK) on Stock Picks Bob's Advice on July, 19, 2004, when it was trading at $47.95, virtually unchanged (!) from today's price.
 I actually check many different stocks before settling on a particular stock to discuss. I will try to concentrate on NYSE and NASDAQ issues, but will also look at the AMEX for possibilities at times. Beyond staying with stocks that are near to or higher than $10, I try to look at new names that I haven't heard of before as well as old favorites. By the way, I do not own any shares nor do I have any options on Stryker.
Since many of the stocks are companies I have never even heard of before (!), I start with the Yahoo "Profile" to get a feel for the stock. This is the Yahoo "Profile" on Stryker, informing me that the company
"...engages in the development, manufacture, and marketing of orthopedic products and medical specialties worldwide. It operates in two segments, Orthopedic Implants and MedSurg Equipment."
Even though I discuss the latest quarter at this point, quite frankly, when looking for stocks, I jump to the Morningstar.com page for the "5-Yr Restated" financials. I eliminate a lot of ideas after looking at Morningstar.
 Looking at the "5-Yr Restated" financials from Morningstar.com on Stryker, my first analysis is the revenue growth record. I am looking for a company, simply put, that shows a record of increasing revenue for at least the last three or four years. In this case, we can see graphically, looking at the series of increasing 'purple bars' on the bar graph, that Stryker has consistently been reporting growth in revenue from $2.29 billion in 2000 to $4.26 billion in 2004 and $4.75 billion in the trailing twelve months (TTM).
What about the earnings? Looking at the same page a few lines lower, Morningstar reports the earnings results on a per share basis, and this company 'passes the test'. Stryker earned $.55/share in 2000, and has increased its earnings regularly to $1.14 in 2004 and $1.59 in the TTM.
The dividend picture is not quite as nice. I would like to see a company that is paying a dividend to regularly increase that dividend. However, SYK had a $.04/share dividend in 2000, increased it to $.06/share in 2002, then since then, apparently has dropped the dividend payment to shareholders.
 Similarly, I usually take a look at the number of shares outstanding each year. While I can tolerate some increase in the 'float', with a company issuing some new shares for financing purposes, a company that rapidly increases the shares outstanding is unattractive to me and I am interested in a company that can actually decrease the number of shares, presumably by buy-backs, which tends to help with per share results. In this case, Stryker reported 391 million shares in 2000 and has increased it to 401 million in 2004 and 405 million in the trailing twelve months.
Continuing with the Morningstar.com evaluation, I take a good look at the "free cash flow". This amount represents the actual cash that a company could spend or invest in either repurchase of its own shares, dividends, or acquisitions. During the implosion of the "dot.com" bubble, many of the companies that didn't have any real earnings but had lots of cash from rich ipo's discussed their "burn rate". This was the amount of cash expended/month or year and represented the amount of time available until either the company started generating cash on its own or the company simply ran out of money.
Trying to avoid a company that is financially unhealthy, I have been examining free cash flow and am looking for companies with positive free cash flow that is increasing.
 In Stryker's case, we can see from the Morningstar report that the free cash flow has increased from $377 million in 2002 to $504 million in 2003, $406 million in 2004, and $535 million in the TTM.
What about the balance sheet? This is my next inspection deriving information from the page from Morningstar.com. All I am looking for is lots of assets and not much in the liability department! In other words, what about the current assets relative to the current and long-term liabilities?
One statistic you may read me write about is the "current ratio". This is the ratio, the comparison, between the amount of the total current assets to the total current liabilities. Generally, I have read, whenever this ratio is 1.5 or higher, the comapny is essentially 'healthy'.
In Stryker's case, the company has $532.6 million in cash and $1.832.6 million in other current assets according to Morningstar.com. When balanced against the $1.035.6 million in current liabilities, we can calculate a 'current ratio' of greater than 2:1. Stryker passes the test.
I often like to see if the current assets could pay of all of the liabilities (current and long-term) combined. In fact when we take the combined current assets of almost $2.4 billion, compared with the combined liabilities of $1.3 billion, Stryker can almost pay off all of the liabilities two times over! Another sign of a healthy balance sheet imho.
 In some fashion, I have just about completed by Momentum evaluation (picking a stock off the top % gainers for the day), my Fundamental analysis (looking at the Morningstar.com information), and now like to take a look at the stock from a value perspective.
 For this, I generally turn to Yahoo "Key Statistics" on Stryker. Some of the numbers I can glean off of this page include the size, or market capitalization of the company. The market cap is simply the product of the number of shares outstanding by the stock price. For this, I have been using the Ameritrade definition on market capitalization: small cap stock under $500 million, from $500 million to $3 billion is a mid-cap stock, and over $3 billion is a large cap stock. Stryker is a large cap stock with a market capitalization of $19.44 billion. Generally, I have had the best luck in picking stocks which have been a bit smaller than this, more in the mid-cap stock size range.
 Next on the statistics page are the earnings parameters. These two are the Price/earnings ratio, a measure of the amount of earnings power you are getting per $1 of purchase price. Higher p/e ratios show less "value" than stocks with low p/e ratios. In Stryker's case, the p/e was reported at 29.21, a tad rich compared to other stocks. More important to me is the PEG ratio which is a determination of the relative value of the p/e compared to the estimated growth rate. We obtain this off the Yahoo page, but this is calculated by dividing the p/e by the 5 yr expected growth rate. You can see that if we want to have a lot of growth without paying much of a premium for it, we want this ratio to be small as well. In general a PEG under 1.5 is reasonable and a PEG under 1.0 is downright cheap! Stryker has a PEG of 1.15 making it very reasonably valued by this measure.
The next parameter I have been examining is the Price/Sales ratio. In simple language, this is the amount of money in terms of price, that an investor has to spend to buy shares of stock, relative to the amount of sales or revenue that comes along with it. I really didn't know how to use this parameter until I read a very insightful article from Paul Sturm in Smart Money Magazine April, 2005. Mr. Sturm pointed out how the Price/Sales ratio is most important relative to other stocks in the same type of business; what we call the "industrial group". I have been able to use the fidelity.com website to get the information about each stock and the other stocks in the same industrial group to determine relative valuation.
 Looking at the Fidelity.com eResearch website for this information, we can see that Stryker is in the "Medical Instruments/Supplies" industrial group, and is valued fairly moderately (or in the midst of the stocks) by this parameter. Leading the group in terms of richness of valuation is Alcon (ACL) with a Price/Sales ratio of 7.9, followed by Guidant (GDT) at 7.3. Stryker (SYK) is next at 3.9, followed by Boston Scientific (BSX) at 3, and Baxter (BAX) at 2.4. Thus, by this measure, Stryker is of average 'valuation'.
Finally, I like to return to the "Key Statistics" page from Yahoo to get a feeling for the amount of shares outstanding and the short interest. From this, I can see that there are 405.84 million shares outstanding but only 212.46 million of them "float" or are traded freely. Many shares must be tightly held and not available for trading.
The short interest is 4.56 million shares out short as of 2/10/06, representing 1.20% of the float or 2.3 trading days of volume. Generally, I have been using 3 days as my cut-off of significance. More than three days, imho, means that there are a lot of shares that have been sold short, and this might have a bullish effect on the stock if those short-sellers panic and start buying shares to cover their shorts. This is what we call a "short squeeze."
This page also shows that the company pays a small dividend of $.11/share yielding 0.20%. The last stock split was a 2:1 split May 17, 2004.
Finally, I take a look at a chart. I have grown comfortable with "point & figure" charts, although you may not be familiar with them. These give me a feeling for the buying and selling pressure with the columns of x's representing the stock climbing in price and the o's are price drops. Generally, I do not get much into technical analysis as I am not very sophisticated in that department. I simply want to see that the stock is generally climbing higher in price and not collapsing.
This is the "Point & Figure" chart on Stryker from Stockcharts.com:
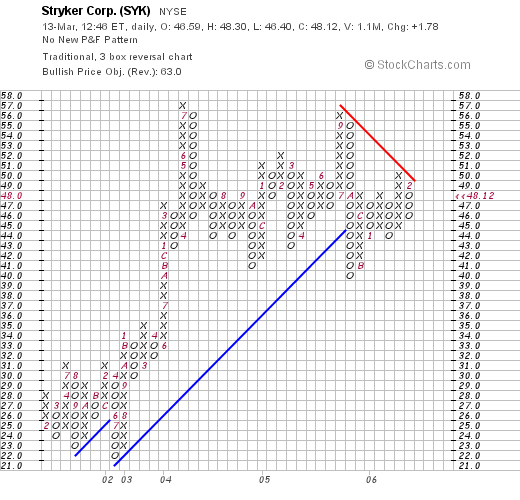
As I mentioned earlier, the stock price is unchanged from my pick over a year ago. We can see that the stock which climbed strongly between 2001 and 2004, has been 'consolidating' between the $44 and the $57 range the past 2 years or so. The stock is not moving higher, and not moving lower, and does not show as much price momentum currently as many of the other stocks discussed on this website. With the great results reported in the latest quarter, I wouldn't be surprised to see the stock break through resistance and move higher from the current level. But that is just my guess :).
So what do I think? Well in summary, the earnings were solid, the Morningstar.com report was beautiful, the PEG is under 1.5 and the Price/Sales is moderately priced as well. The chart is at best neutral.
I like the stock and especially the consistency in growth. That is why I "picked" it today! Thanks so much for visiting. I promise to not be as verbose the next time! Honest. If you have any comments or questions, please feel free to leave them on the blog or email me at bobsadviceforstocks@lycos.com.
Bob