Stock Picks Bob's Advice
Sunday, 20 December 2009
Research in Motion, Ltd. (RIMM) "Revisiting a Stock Pick"
Hello Friends! Thanks so much for stopping by and visiting my blog, Stock Picks Bob's Advice! As always, please remember that I am an amateur investor, so please remember to consult with your professional investment advisers prior to making any investment decisions based on information on this website.
 I read with interest when another one of my 'old favorites' showed up the other day on the top % gainers lists on the back of a terrific earnings announcement. Research in Motion (RIMM) closed at $70.00, up $6.54 or 10.31% on December 18, 2009. I do not own any shares of this stock.
RIMM has been an early favorite of mine, having first written up Research in Motion on this blog on September 26, 2003, when the stock was trading at $38.24. Adjusted for a 2:1 split in June, 2004, and then a 3:1 stock split in August, 2007, this workes out to a split-adjusted 'pick price' of $6.37. With Friday's close at $70.00 this works out to an appreciation of $63.63 or 999% since writing up the stock.
I revisited Research in Motion (RIMM) on August 19, 2007, when the stock was trading at $220.52. Adjusted for the 3:1 stock split a couple of days after posting this entry, the stock pick was made at a split-adjusted price of $73.51, so RIMM has essentially traded sideways since that point, and is actually a few dollars lower than the blog entry of 2007.
 Let's again revisit this stock and look at the latest earnings, the fundamentals underlying this stock, some valuation numbeers, and a 'point & figure' chart.
On December 17, 2009, Research in Motion announced 3rd quarter results. For the quarter ended November 30, 2009, net income was reported at $628.4 million or $1.10 per share, upsharply from net income of $396.3 million or $.69 per share the prior year. Revenue climbed 41% to $3.92 billion in the quarter.
Equally important the company beat expectations for the quarter which according to FactSet Research were for earnings of $1.04 per share on revenue of $3.78 billion.
The company shipped 10.1 million smartphones in the quarter with net new subscribers of 4.4 million. This also exceeded expectations of 9.5 million in shipments with 4.1 million new subscribers.
To top off the earnings report, RIMM raised guidance for the upcoming quarter to sales of $4.2 billion to $4.4 billion, up from prior guidance of $4.0 to $4.03 billion. This is also ahead of analysts' expectations of $4.1 billion.
Profits was guided to $1.21-$1.31, also ahead of prior guidance of $1.00-$1.08 and also ahead of analysts' expectations for $1.12 in earnings.
Let's take a look at the longer-term results as reported on the Morningstar.com "5-Yr Restated" financials page on RIMM. Here we can observe the steady growth in sales from $1.35 billion in 2005 to $11.1 billion in 2009 and $13.2 billion in the trailing twelve months (TTM). Earnings have also steadily grown from $.36/share in 2005 to $3.30 in 2009 and $3.55/share in the TTM.
Outstanding shares have been stable and actually have declined due to company buy-backs. In 2005, there were 587 million shares which dropped to 574 million by 2009. Free cash flow has been positive and has increased from $482 million in 2007 to $1.05 billion in the TTM.
Looking at the balance sheet, we can see that RIMM has $1.08 billion in cash and $4.13 billion in other current assets. This total of $5.21 billion in cash and other current assets, when compared to the $2.17 billion in current liabilities works out to a Current Ratio of 2.4. The company has almost no long-term liabilities with $71.1 million only reported on Morningstar. According to Morningstar, RIMM sells with a forward p/e of 16.1. Fidelity has RIMM with a trailing p/e of 19.8 and the stock does not pay a dividend.
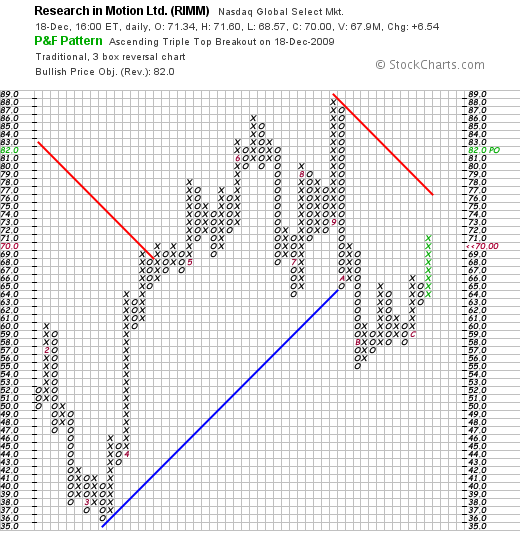
If we examine a 'point & figure' chart on Research in Motion (RIMM) from StockCharts.com, we can see that the stock price is very volatile.The stock traded as high as $148 in June, 2008, only to dip as low as $36 in December, 2008 through March, 2009. The stock is still trading below resistance lines but appears to be moving bullishly higher from its prior lows.
To summarize, Research in Motion (RIMM) reported a very strong earnings report with both strong growth in revenue and earnings with numbers that both exceeded analysts' expectations. To top it off, the company raised guidance for the upcoming quarter also above analysts estimates.
Longer-term, the company has steadily and rapidly grown earnings, revenue, and free cash flow while maintaining and reducing outstanding shares. However, they do not and haven't paid cash dividends. Their balance sheet is solid with a current ratio of over 2 and nominal long-term debt. The stock chart demonstrates the high volatility of this stock which appears to trade with a high beta. Valuation does not appear excessive in the high teens with the incredible record of growth this company has reported.
Perhaps a better question is the performance of the RIMM smartphone platform with the iPhone from Apple (AAPL), and the Google Droid phone by Motorola (MOT) sponsored by Verizon (VZ). Apparently all three of these platforms have been taking share from Windows Mobile-based phones. With smartphones representing only 18% of all cell phones, there appears to be room for growth for all three major platforms.
RIMM deserves a spot in my blog if not eventually a spot in my own trading portfolio! For now, I shall wait for my own holdings to either reach an appreciation target allowing me to purchase a new holding or dip so that they need to be sold completely. I continue to utilize my own portfolio to literally direct my actions in the market.
Thanks again for visiting! If you have any comments or questions, please feel free to leave them right on the website or email me at bobsadviceforstocks@lycos.com.
Yours in investing,
Bob
Sunday, 29 November 2009
A New Podcast on Medtronic (MDT) and "Wilderness" by Carl Sandburg
Hello Friends! Thanks so much for stopping by and visiting my blog, Stock Picks Bob's Advice! As always please remember that I am an amateur investor, so please remember to consult with your professional investment advisers prior to making any investment decisions based on information on this website.
I put together a podcast this evening on Medtronic (MDT). Please click HERE to listen to me discussing my recent entry and a poem by Carl Sandburg!
If you have any comments or questions, please feel free to leave them on the website or email me at bobsadviceforstocks@lycos.com.
Yours in investing,
Bob
Medtronic (MDT) "Revisiting a Stock Pick"
Hello Friends! Thanks so much for stopping by and visiting my blog, Stock Picks Bob's Advice! As always, please remember that I am an amateur investor, so please remember to consult with your professional investment advisers prior to making any investment decisions based on information on this website.
After shrinking for four straight quarters, the U.S. GDP expanded by 2.8% in the 3rd quarter, reversing the longest straight decline for the usually robust United States economy since the Great Depression of the 1930's. Even so, the economic recovery remains fragile. Latest figures from the post-Thanksgiving "black Friday" shopping suggest that while individual spending dipped 8% per person, total weekend spending actually climbed 0.5% from last year.
On the jobs front, all we see is that the rate of decline is diminishing, lending hope that an improvement may actually be seen in the not-too-distant future. However, news that initial jobless claims came in at 466,000 last week is only good news from the perspective that this was the lowest level since September, 2008. It is still hard in absolute terms to become very excited about the news that another 1/2 million Americans are submitting new claims for unemployment!
Meanwhile gold is soaring to near-record levels hitting $1,136.80/ounce on Friday after pulling back in the face of the Dubai World events. On top of this the dollar has shown continued weakness, dropping to a 14 year low against the Yen as the Fed continues to utilize rock-bottom interest rates to try to kickstart the economy. In spite of the slowly turning economy in the United States, politicians like Ron Paul are seeking to exert more influence over the machinations of the Fed. Meanwhile, Bernanke and the Fed are trying to fight back to retain independence.
To top it off there is now talk of a second stimulus while the effects of the watered-down first stimulus, most still unspent, is debated.
In spite of all of this, I agree with Warren Buffett, probably one of the wisest investors of the century, who is still bullish on America's Future. (Watch Warren Buffett on YouTube here.)
 With all of that in mind, I do not believe that many of the companies we look for on this blog will go out of business and that the stock market will never recover.
I continue to look for quality companies reporting good earnings with good track records. One such company is Medtronic (MDT), a stock that I first reviewed six years ago, on November 13, 2003 (excuse my 'title' which mistakenly says 2002.) I do not currently own any shares of Medtronic (MDT) but my wife does own a few shares (amounting on one year's contribution) to her IRA that she purchased several years ago. Medtronic (MDT) closed at $42.99 on November 27, 2009, down $(.19) or (.44)% on the day.
According to the Yahoo "Profile" on Medtronic (MDT), the company
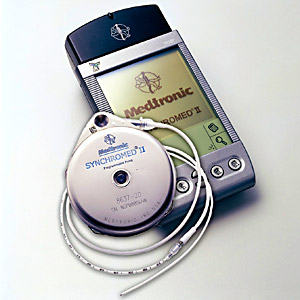
"...develops, manufactures, and sells device-based medical therapies worldwide."
These devices address cardiac rhythm problems, neuromodulation treatment, diabetes treatment, surgical treatment and physio-control equipment.
Medtronic made the news last week after reporting surprisingly strong 2nd quarter 2010 results. Revenue for the quarter came in at $3.84 billion, up 8% from last year's $3.57 billion. Earnings for the quarter came in at$868 million or $.78/share in the quarter ended October 30, 2009, up from $547 million or $.48/share the prior year. Adjusted income was $850 million or $.77/share.
 Financial results should never be reviewed 'in a vacuum'. It certainly is important whether the company reports positive or negative growth, but at least as important is the expectations that were held by analysts and others regarding the event as the event itself. In this case, analysts had been expecting revenue of $3.75 billion and Medtronic exceeded expectations coming in at $3.84 billion. In terms of the earnings figure, analysts had expected earnings of $.74/share, and the company again exceeded these expectations with its $.77/share (adjusted) result!
In today's difficult economic environment, fewer companies are offering earnings guidance, so for a company like Medtronic (MDT) to not only offer guidance, but also to raise guidance to a range of $3.17 to $3.22 a share, from prior projections of $3.10 to $3.20/share ahead of analysts forecasts of $3.15/share is also quite encouraging.
In general, I prefer to identify companies that have uninterrupted revenue and earnings growth for inclusion in this blog. But it would be inopportune to ignore companies like Medtronic (MDT) which have indeed experienced a dip in recent financial results in the face of a global slowdown rivaling the Great Depression, yet now appear to be returning to their regular pattern of growth. These are companies that need to be identified by a successful investor.
Reviewing the Morningstar.com "5-Yr Restated" financials on Medtronic (MDT), we can see that revenue growth has been steady from $10.1 billion in 2005 to $14.6 billion in 2009 and $14.8 billion in the trailing twelve months (TTM). Earnings grew steadily from 2005 at $1.50/share to 2007 when they reported $2.40/share. However, since that time earnings have dipped to $1.93/share in 2009 and $1.69/share in the TTM. However, with the current report discussed above, hopefully, this trend is being reversed.
Medtronic (MDT) has continued to pay dividends and to increase that payment regularly without interruption from $.34/share in 2005 to $.75/share in 2009 and $.77/share in the TTM. Outstanding shares have been tightly controlled and actually reduced with 1.2 billion in 2005, graduallly decreased each year to 1.12 billion in the TTM.
Free cash flow has been positive and increasing (except for a mild dip in the TTM) from $2.4 billion in 2007 to $3.38 billion in 2009 (and $3.18 billion in the TTM).
The balance sheet appears solid with $1.0 billion in cash and $6.3 billion in other current assets with only $3.1 billion of current liabilities yielding a 'current ratio' of 2.35. Morningstar reports the company with another $7.3 billion in long-term liabilities.
In terms of valuation, looking at the Yahoo "Key Statistics" on MDT, we find that this is a large cap company with a market cap of $47.58 Billion. The company sells with a trailing p/e of 21.65 with a forward p/e of 12.28. Even with the relatively 'rich' valuation of its p/e, the PEG ratio (5 yr expected earnings) comes in at a reasonable 1.24 (from my perspective).
Yahoo reports 1.11 billion shares outstanding with 1.10 billion that float. As of November 13, 2009, there were 13.74 million shares out short representing only 2 days of average trading volume, below my own arbitrary 3 day rule for significance for the short interest ratio.
The company pays a forward dividend rate of $.82/share with a forward annual dividend yield of 1.9%. The payout ratio is a fairly 'safe' 40%, and the last stock split was a 2:1 split more than 10 years ago paid in September, 1999.
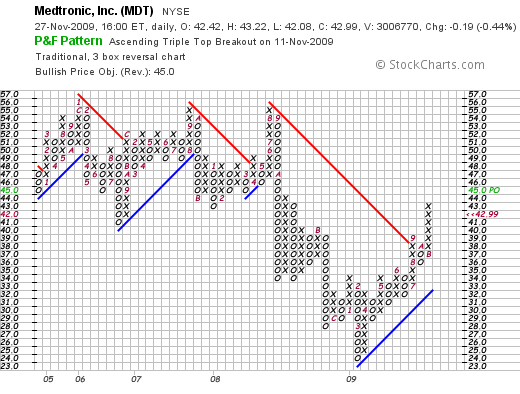
Finally, if we take a look at the Medtronic (MDT) 'point & figure' chart from StockCharts.com, we can see that the stock was trading in a fairly tight range between $41 and a high of $56 (that it hit three times) before turning lower in October, 2008, along with the rest of the market, to bottom at $24/share in February, 2009. The stock has rallied strongly since, and hit a recent level of $43/share last week before pulling back a bit on Friday.
To summarize, Medtronic (MDT) appears to be recovering and regaining some of its previous growth characteristics that suffered during the recent economic slowdown. They reported a terrific quarter and expressed optimism about the future by raising guidance. Longer-term, they have continued to grow their revenue while experiencing a mild set-back in earnings, increased their dividend, and have retired shares on a regular basis. They have outstanding free cash flow growth, a solid balance sheet, and a chart that is looking more optimistic.
On a Peter Lynch level, with an aging population struggling with obesity, heart disease numbers may well soar, and recently predictions of a doubling of diabetes victims have recently been announced. Against all of this is the perceived threat of healthcare reform that may introduce more regulation into healthcare in America but will also bring 30 to 40 million new patients into doctors' offices and hospitals.
I do not own any shares of MDT now, but this is the kind of stock I would be purchasing if I had the 'signal' from my own portfolio to be buying shares in a new holding.
Thanks again for stopping by and visiting my blog! If you have any comments or questions, please feel free to leave them right on the website or email me at bobsadviceforstocks@lycos.com.
Yours in investing,
Bob
Wednesday, 11 November 2009
A New Podcast on Meridian Bioscience (VIVO) and I read a poem by Robert Frost
Hello Friends! Thanks so much for stopping by and visiting my blog, Stock Picks Bob's Advice! As always, please remember that I am an amateur investor, so please remember to consult with your professional investment advisors prior to making any investment decisions based on information on this website.
Click HERE for my podcast on Meridian Bioscience (VIVO) and a poem by Robert Frost, "Directive".
If you have any comments or questions, please feel free to leave them here or email me at bobsadviceforstocks@lycos.com.
Yours in investing,
Bob
Sunday, 8 November 2009
Meridian Bioscience (VIVO) "Revisiting a Stock Pick"
Hello Friends! Thanks so much for stopping by and visiting my blog, Stock Picks Bob's Advice! As always, please remember that I am an amateur investor, so please remember to consult with your professional investment advisers prior to making any investment decisions based on information on this website.
 As I slowly gain some confidence in this difficult stock market, I wanted to take another look at one of my past favorites, Meridian Bioscience (VIVO). I do not currently own any shares, but have owned shares on an off since first writing about this stock on this blog on April 22, 2004.
Meridian is in the medical diagnostic test kit business. As the Yahoo  "Profile" on VIVO reports, Meridian Bioscience is
"...a life science company, engages in the development, manufacture, sale, and distribution of diagnostic test kits primarily for respiratory, gastrointestinal, viral, and parasitic infectious diseases."
Probably one of the biggest medical challenge facing this nation and the rest of the world is the 2009 H1N1 Flu (also called "Swine Flu") epidemic. It does not appear that this pandemic has yet peaked.
Meridian was recently given FDA approval to market the "TRU FLU" kit to include claims that it is sensitive to two strains of swine flu. Tests were accomplished in the laboratory but had not been fully proven in clinical testing. As reported:
"The research was done with strains of the virus cultured from positive respiratory specimens, Meridian said in a news release. The test hasn’t been proven yet to distinguish positive results from clinical specimens."
The swine flu epidemic is clearly urgent enough to get the FDA to expedite this labeling permission. But the timeliness of this particular product is not what really attracts me to this company. It is just an added "plus" from my own perspective. This company has consistently produced solid financial results for at least as long as I have been following this stock, which is for longer than five years.
First of all, let's take a look at the latest quarterly result.
On July 16, 2009, Meridian Bioscience (VIVO) reported 3rd quarter 2009 results. Sales for the quarter came in at $38.2 million, up 16% from the $33 million reported in the prior year. Earnings cane in at $8.5 million, up 10% from $7.8 million the prior year and diluted earnings per share increased 11% to $.21/share from $.19/share previously. The company also reaffirmed guidance for full 2009 year of revenue between $140 million and $144 million and earnings between $.77 and $.81/share.
On September 15, 2009, the company continued its optimistic assessment of its opportunities providing 2010 guidance of sales between $160 and $165 million, and earnings to be between $.90 and $.95/share.
Let's take a longer-term look at some more Meridian (VIVO) numbers and I think you will agree with me that the company, although small, has been generating some pretty phenomenal results.
Looking at the Morningstar.com "5-Yr Restated" financials, we can see that VIVO has steadily increased its revenue from $80 million in 2004 to $142 million in the trailing twelve months, without 'missing a beat'! Earnings during this period have also steadily improved from $.30/share in 2004 to $.80/share in 2008. Surprisingly for such a small company, they pay a significant dividend and have also increased it yearly from $.17/share in 2004 to $.53/share in 2008 and $.62/share in the TTM.
The company has increased its float somewhat from 34 million shares in 2004 to 40 million in 2006, but since 2006 has only increased shares to 41 million. Free cash flow has been positive and growing with $19 million reported in 2006 increasing steadily to $26 million in 2008 and $29 million in the TTM.
Per Morningstar.com, the balance sheet for this company is gorgeous with $53 million in cash which by itself could pay off both the $12.2 million in current liabilities as well as the nominal $1.2 million in long-term liabilities reported more than 4x over!. If we include the $49 million in other current assets, the current ratio jumps to over 8.0.
Looking at "Key Statistics" on Meridian from Yahoo, we can see that this is a small cap stock with a market capitalization of only $916.99 million. The trailing p/e is a bit rich at 29.50 (clearly the market is putting a premium on these financials), and the forward p/e (fye 30-Sep-10) is also a bit rich at 24.60 with a PEG reported at 1.64 (5 yr expected).
The company is reported to have 40.52 million shares outstanding with 39.42 million that float. Based on its recent average daily volume of 258,803 shares, the 2.66 million shares out short represents 9 trading days of volume (the short ratio), well above my own '3 day rule' for significance. There could be a rush to cover these short shares if Meridian comes out with better than expected results. However, on the other hand, there are a lot of stockholders betting against this company especially in light of its relatively rich valuation.
The dividend as I have noted, is not insignificant with $.68/share being the forward dividend payment yielding 3%. The company does pay out a significant portion of its earnings in dividends with a 79% payout ratio. The company last split its stock May, 2007, when it declared a stock dividend to effect a 3:2 split.
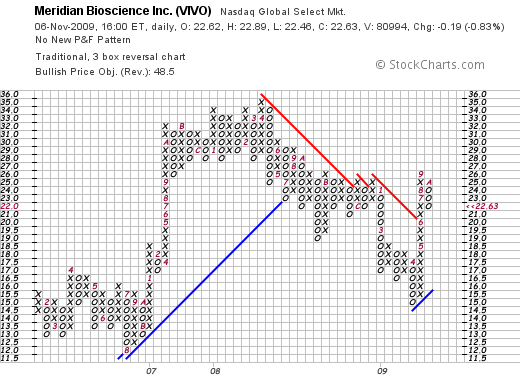
Looking at a recent "point & figure" chart from StockCharts.com on Meridian, we can see that the stock made a terrific move higher between August, 2006, when the stock was trading at $12 to a peak of $35 in April, 2008. The stock sold off with the rest of the market dipping to a recent low of $15.00 in April, 2009, only to rally past recent resistance and currently trades at $22.63/share. The stock does not appear currently over-extended relative to its apparent consolidation over the past two years of its big move in 2007.
To summarize, Meridian (VIVO) is a timely stock with an interesting diagnostic product line that may benefit from the current Swine Flu pandemic hitting our nation. They have been a consistent performer with steadily increasing revenue, earnings, and even dividends. The company is financially solid with positive and growing free cash flow and an impressive balance sheet. If anything, the company is priced a bit rich but with the sideways move the stock price has been making the past two years, and the recent strength it has shown, it may well be a timely stock to consider.
Thanks again for stopping by and visiting my blog. If you have any comments or questions, please feel to leave them right here on the website or drop me a line at bobsadviceforstocks@lycos.com.
Yours in investing,
Bob
Friday, 23 October 2009
Coca-Cola (KO) and Church & Dwight (CHD) "Trading Transparency"
Hello Friends! Thanks so much for stopping by and visiting my blog, Stock Picks Bob's Advice! As always, please remember that I am an amateur investor, so please remember to consult with your professional investment advisers prior to making any investment decisions based on information on this website.
 Earlier this week (10/20/09) I sold my 50 shares of Coca-Cola (KO) at a price of $53.38 and purchased 48 shares of Church & Dwight (CHD) at a price of $55.61. As part of my own "trading transparency", I wanted to share with you my own thoughts behind this decision and update you regarding my current strategy.
There is no doubt in my mind that Coca-Cola (KO) remains one of the top international brands of 2009 and of all time! Like my own admiration for Colgate Palmolive (CL) that I have written about previously, I would like to add Coke to my portfolio again some time in the future. However, this week the company announced 3rd quarter results that were a little 'flat' and the market responded with a pull-back in the stock price.
During the quarter worldwide case volume grew 2% including 37% growth in India as well as a 15% growth in China. In North America, however, sales slipped 4% with a 5% dip in soft drink sales. Perhaps more importantly the company failed to meet expectations of $8.11 billion in revenue, coming in instead at $8.04 billion (down from $8.39 billion the prior year). Earnings of $.81/share were also flat with last year's $.81 but did meet estimates according to Thomson Reuters.
O.K. it wasn't that bad. But the stock has had a big move to the upside and with the bit of a disappointment, it seemed vulnerable to a correction. In fact, we can see this in the latest 'point & figure' chart from StockCharts.com:
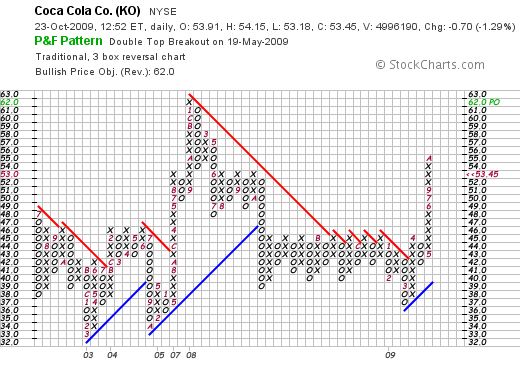
The stock has a great deal of support in the $40-$42 range technically, but wouldn't you view the chart with the recent rise from $43 to a high of $55 over the last 5 months a bit vulnerable to retracement? Anyhow, that was my thought and I pulled the plug on Coke.
But what do do with the proceeds? One of the more recent stocks I have reviewed here on Stock Picks Bob's Advice is Church & Dwight (CHD), another consumer company that might be considered a reasonable replacement for a stock like Coke. As I wrote above, I purchased 48 shares of Church & Dwight on 10/20/09 at a price of $55.61. As I write, CHD is trading at $55.35, so I am a few cents under my purchase price.
On August 4, 2009, Church & Dwight reported 2nd quarter results. (They should actually be reporting their 3rd quarter numbers soon as it has been almost 3 months since that report!) During the second quarter revenue climbed 5% to $623.1 million from $594 million the prior year. Earnings came in at $58.2 million or $.81/share as compared with last year's $45.8 million or $.66/share. Perhaps more importantly, analysts had forecast earnings of $.79/share on revenue of $611.5 million according to Thomson Reuters. Thus, unlike Coke, which met estimates on earnings and missed on revenue forecast, CHD exceeded both of these estimates.
In addition, the company raised guidance for full-year earnings from $3.30 to $3.35/share to $3.35 to $3.40/share. Analysts had been predicting $3.36/share. If that wasn't enough the company also cast a strong vote on the financial strength of the company by significantly increasing their dividend from the former payment of $.09/share to $.14/share.
Thus in one single announcement, the company did what I have lightly referred to a trifecta-plus! That is they reported strong earnings and revenue numbers that beat expectations on both, they went ahead and raised guidance, and then to top that off increased the dividend as well!
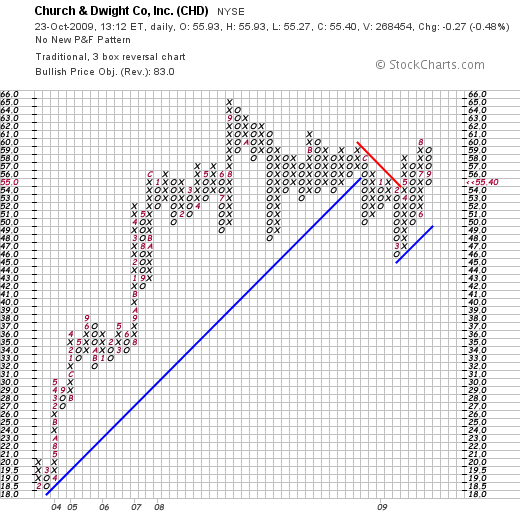
On a technical basis, Church & Dwight (CHD) is far from over-extended unlike that chart on Coke which gave me some short-term concerns. If we look at the 'point & figure' chart on CHD from StockCharts.com, we can see that this stock had a tremendous increase from $18.50 in February, 2003, to a peak of $65 in September, 2008. After dipping as low as $46 in March, 2009, the stock has been fighting higher but overall has spent about a year in this $46 to $65 range consolidating.
One of the things that confirmed my choice of Church & Dwight (CHD) was the beautiful financial picture as reported by Morningstar.com. Looking at the "5-Yr Restated" financials on Morningstar, we can see the perfect pattern of steady revenue growth from $1.46 billion in 2004 to $2.42 billion in 2008 and $2.48 billion in the trailing twelve months (TTM), the steady increase in earnings from $1.36/share in 2004 to $3.00 in the TTM, the modest growth in outstanding shares from 68 million in 2004 to 71 million in the TTM, the steady growth in free cash flow from $139 million in 2006 to $400 million in the TTM, and the strong balance shee with $357.0 million in cash and $481.0 million in other current assets balanced against current liabilities of $500.9 million.
Reviewing Yahoo "Key Statistics" on Church & Dwight, we can see that the market cap is a mid cap $3.89 Billion, the trailing p/e is modest at 18.41 with a forward p/e (fye 31-Dec-10) estimated at 14.41. Thus, the PEG (5 yr expected) works out to a satisfactory 1.35.
Yahoo reports 2.52 million shares out short as of 9/25/09, representing a short ratio of 6.1 a bit more than my own 3 day arbitrary rule for 'significance'. The dividend of $.56 results in a 1% yield which is well covered with earnings with only a 12% payout ratio. The last stock split was back in September, 2004, when the company had a 3:2 split.
As I noted above, the company just posted an announcement that 3rd quarter results are set for November 3, 2009, so there could be some volatility in the stock price around this announcement depending on how the company does relative to expectations and unknown 'whisper' estimates. Stay tuned.
Meanwhile, I have chosen to swap from the fizz of Coke to the stabilizing influence of Arm & Hammer Baking Powder, the brilliance of Brillo, and the safety of a First Response Alarm! I hope that this swap makes sense and continues to work for me in this continuing to be challenged market environment.
Thanks again for visiting! If you have any comments or questions, please feel free to leave them on the blog or email me at bobsadviceforstocks@lycos.com.
Yours in investing,
Bob
Posted by bobsadviceforstocks at 12:44 PM CDT
|
Post Comment |
Permalink
Updated: Friday, 23 October 2009 12:49 PM CDT
Sunday, 4 October 2009
ResMed (RMD) a New Podcast!
Hello Friends! Thanks so much for stopping by and visiting my blog, Stock Picks Bob's Advice! As always, please remember that I am an amateur investor, so please remember to consult with your professional investment advisers prior to making any investment decisions based on information on this website.
I wanted to let all of you know that I posted a new podcast on ResMed (RMD) this evening, going over my recent post on this stock.
You can click HERE to access my podcast page and download or play the podcast directly.
If you have any comments or questions, please feel free to leave them on the blog or email me at bobsadviceforstocks@lycos.com.
Yours in investing,
Bob
Wednesday, 23 September 2009
McDonald's (MCD) and Walgreen (WAG) "Trading Transparency"
Hello Friends! Thanks so much for stopping by and visiting my blog, Stock Picks Bob's Advice! As always, please remember that I am an amateur investor, so please remember to consult with your professional investment advisers prior to making any investment decisions based on information on this website.
As one of my basic strategies for dealing with my investments and managing my cash and equity balances, I utilize predetermined sale points for all of my holdings both on the upside and downside after an initial purchase. Sales on appreciation are considered "good news" and generally result in a purchase of a new holding. This is contrasted with sales on the downside, which I refer to as "bad news" signals that result in a shift from equity into cash.
 Earlier today my holding in Walgreen (WAG) reached a first appreciation target--a gain of 30% in stock price after an initial purchase and I sold 1/7th of my holding. I purchased 77 shares of Walgreen in my Trading Account on March 27, 2009, at a cost basis of $26.73/share. I sold 11 shares of Walgreen (WAG) today at $34.75 for a gain of $8.02 or 30% since purchase. Since I currently ownly hold 6 positions, well under my maximum of 20 holdings, this sale on "good news" generated a purchase signal for me, and I added a new position into my trading account.
Recently I have been refining my purchases of positions trying to address the question of not only what and when to buy but to deal with the matter of 'how much'? This question became apparent when my portfolio, during the worst part of the correction, dipped to a minimum of 5 holdings. As these occasionally needed to be sold on losses, and yet reflecting my own desire to maintain a minimum of 5, I needed to address the problem of replacing losing holdings with similarly sized holdings in spite of their sale on 'bad news. Initially I chose to replace them with holdings 50% of the average of the other positions. Subsequently I have decided that 80% or 4/5 of the size of the remaining holdings made reasonable sense to me.
However, with a shrinking position size, conversely I needed some approach that would enable me to increase the size of these downsized holdings as the market improved so that new positions would be more 'normal' in value. Thus, I have chosen to add new holdings at a level of 125% of the value (5/4) of the other positions held in the portfolio. You can see that as a market firms, my new positions will continue to grow in size; when the market is very weak, my replacement holdings will diminish in value.
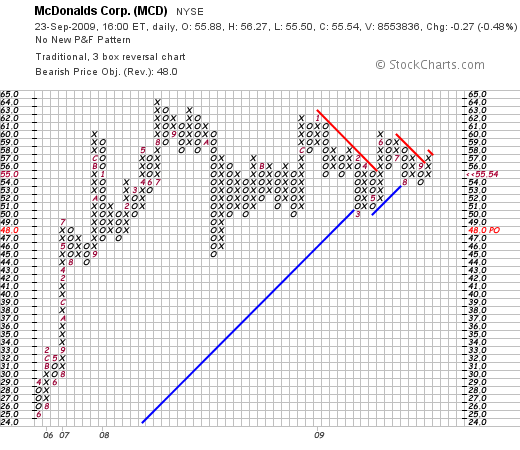
 With my buy signal in hand, I chose to purchase 52 shares of McDonalds Corp (MCD) at a price of $56.18. I recently reviewed this company but would like to touch on some of the updated financial underpinnings to this decision. Unfortunately for me I purchased shares just before the Fed announced its decision to leave short-term interest rates unchanged at near zero, but commented that economic activity had "picked up" since the last Fed meeting in August. As should be expected, the skittish market understood good news to be bad news and sold off shares. Somehow, any comment that things had "picked up" was enough to convince an inflation bear that interest rates would be heading higher soon. Although there appears to be little in the announcement to justify that assessment.
In any case, McDonald's (MCD) closed at $55.54, down $(.27) or (.48)% on the day, a bit under my own purchase price at $56.18.
Much has been written about McDonald's being "recession-resistant". We do know that the recession has hit upscale restaurants hard! Recently The Motley Fool labeled McDonald's as "recession-resistant". Intuitively, I view McDonald's as the high-quality, clean-store, good-value and consistent product offering that also represents comfort foods in this rather uncomfortable time of steep unemployment numbers and economic slowing.
But let's get back to McDonald's and why I like it as an investment.
The latest quarterly report came in July 23, 2009 as reported. The company's earnings actually dipped to $1.09 billion or $.98/share down from $1.19 billion or $1.04 billion in the year ago period. Revenue would have actually climbed 4% except for currency fluctuations. The company beat expectations of earnings of $.97/share (they reported $.98) but missed expectations on revenue of $5.7 billion (they reported $5.65 billion).
Interestingly, it was a strong dollar that led to adjustments in revenue. When local currency remains stable and the dollar soars, each unit of foreign currency means less dollars reported. If the converse is true, then global revenue should be increasing in the next report due to dollar weakness. Of course, I am not a currency expert, but it could make one wonder! In fact as this article noted:
"Stifel Nicolaus & Co. analyst Steve West told investors that the August results were worse than anticipated, but he expected further benefits in foreign exchange rates would help McDonald's overcome any weakness in the monthly metric."
However, the company continues to do well globally. These same-store sales results are reported in local currency, and represent consumer interest in the product. As reported:
"Same-store sales - or those at outlets open at least 13 months -- rose 4.8%, including a 3.5% rise in the U.S. Europe was up 6.9% and the Asia/Pacific, Middle East and Africa rose up 4.4%."
Longer-term, except for the recent dip in revenue, the "5-Yr Restated Financials" on Morningstar are impressive. Revenue has climbed from $19 billion in 2004 to $22.5 billion in the trailing twelve months (TTM). Earnings have increased from $1.79/share in 2004 to $3.77/share in the TTM. The company pays a nice dividend and has grown it from $.55/share in 2004 to $1.88/share in the TTM. The company appears to have a reasonable cushion on its dividends with a payout ratio of 50%.
Outstanding shares have been held steady with 1.27 billion in 2004, declining to 1.13 billion in the TTM. Free cash flow continues to be strongly positive with $2.6 billion in 2006 in creasing to $3.6 billion in the TTM.
The balance sheet appears reasonable with $3.6 billion in cash and other current assets compared with the $2.8 billion in current liabilities. The company does have significant long-term debt reported at $13.1 billion.
Checking the Yahoo "Key Statistics" we can see that this is a 'large cap' stock with a Market Capitalization of $60.61 billion. The trailing p/e is 14.72 and the p/e is moderate at 14.72. The PEG is a tad rich at 1.59.
There are 1.09 billion shares outstanding and only 10.28 million shares out short representing 1.3 trading days of volume (the short ratio). The company pays a forward dividend of $2.00/share yielding 3.6%. The last stock split was more than 10 years ago, a 2:1 split on March 8, 1999.
Taking a quick look at a 'point & figure' chart from StockCharts.com, we can see that the stock moved strongly higher from $25.00/share in June, 2005, to a high of $64 in August, 2008. Over the past year it has traded in a tight range between a low of $45 and $62. It appears to have found a new level of support and does not appear over-extended.
To summarize, my Walgreen shares hit a first partial sale point on the upside triggering a 'buy signal' in my own trading strategy. The small portion of Walgreen (WAG) was sold and a new position in McDonald's (MCD) was established at a slightly larger size than my other positions as was indicated.
I like McDonald's both from its well-established brand, its ability to innovate in a mature market, its reasonable valuation and its solid dividend. I believe we are still working ourselves out of a rather severe recession and that the value both in the stock and the product it sells will play out well for me. Now, if I can only avoid super-sizing any fries, I shall not have to worry about my ever-struggling diet :).
Thanks for stopping by! If you have any comments or questions, please feel free to leave them on the blog or email me at bobsadviceforstocks@lycos.com.
Yours in investing,
Bob
Sunday, 20 September 2009
ResMed (RMD) "Revisiting a Stock Pick"
Hello Friends! Thanks so much for stopping by and visiting my blog, Stock Picks Bob's Advice! As always, please remember that I am an amateur investor, so please remember to consult with your professional investment advisers prior to making any investment decisions based on information on this website.
One of my favorite stocks (that I do not currently own) is ResMed (RMD) a company that manufactures equipment that treats Obstructive Sleep Apnea. A very common disease that affects millions of people worldwide and that untreated can increase your risk of dying early by as much as 46%.
As this same report relates, sleep apnea
"...is closely linked with obesity, high blood pressure, heart failure and stroke"
Incredibly common, the same article found that
"Among men, 42.9 percent did not have sleep-disordered breathing, 33.2 percent had mild disease, 15.7 percent had moderate disease, and 8.2 percent had severe disease," they wrote.
They said about 25 percent of the women had mild sleep apnea, 8 percent had moderate disease and 3 percent had severely disordered breathing."
It is estimated that 20 to 30 million Americans have sleep apnea and it remains largely undiagnosed. 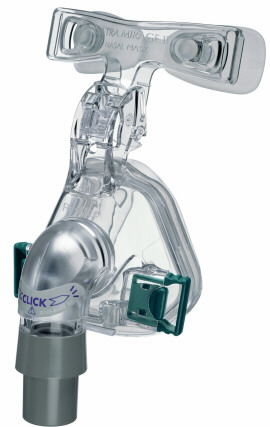
Now that I have you convinced that obstructive sleep apnea is a common and usually easily treatable disease with positive airway pressure masks, let's take a closer look at one of the dominant companies in this market, ResMed (RMD).
I say that ResMed (RMD) is an "old favorite" of mine, because I have written about this company several times, and my sentiment towards their business has remained positive. I first wrote about ResMed on December 5, 2003, when the stock was trading at a split-adjusted $20.88. (ResMed had a 2:1 stock split in October, 2005). I again revisited ResMed in February, 2005, when the stock was trading at a split adjusted $29.92. I also for a period became a holder in the stock myself.
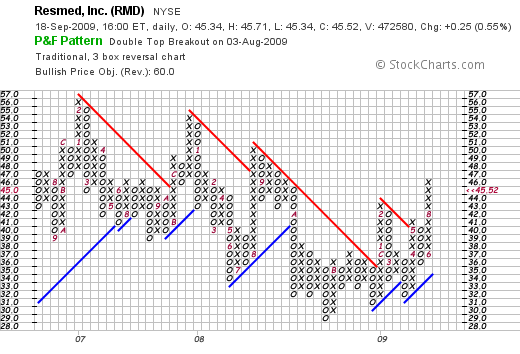
In fact, on August 6, 2008 I purchased shares in ResMed (RMD) at $43.09 and wrote up a little more of my own rationale for doing so. I ended up selling those shares in October, 2008, as the stock market cratered. ResMed (RMD) closed at $45.52 on September 18, 2009, up $.25 or .55% on the day.
I am not yet convinced that the recession is over. But certainly there are early signs of recovery even as some states are seeing record levels of unemployment including California at 12.2% and Nevada at 13.2%. However, my own investment strategy is to monitor my own holdings, avoid making predictions about the economy or the stock market, and restrict my purchases to companies like ResMed with strong fundamentals.
On August 7, 2009, ResMed (RMD) reported 4th quarter 2009 results. Revenue for the quarter ended June 30, 2009, increased 7% to $252 million. (Growth would have been even stronger at 15% if adjustments for currency hadn't been made.)
Net income for the quarter increased 53% to $45.4 million or $.59/share. Analysts, as compiled by Thomson Reuters, had been expecting $.54 cents and only $243.2 million in revenue. Thus, as I like to see on an earnings report, the company reported rather robust growth in both revenue and earnings and beat expectations on both!
Using the Morningstar.com "5-Yr Restated" financials for a longer-term look, we can see that ResMed (RMD) has increased revenue steadily from $426 million in 2005 to $835 million in 2008 and $921 million in 2009. Earnings/share have grown from $.91/share in 2005 to $1.16 in 2006 before dipping to $.85/share in 2007, and then rebounding strongly and steadily to $1.90/share in 2009. The company does not pay a dividend. Outstanding shares have been steady at 75 million reported in 2005 and increasing only slightly to 77 million in 2009.
Free cash flow has been positive and growing recently with $14 million reported in 2007, increasing to $62 million in 2008 and $129 million in 2009.
Regarding the balance sheet, as reported by Morningstar, this company has a relatively 'pristine' set of numbers with $416 million in cash, which by itself could pay off both the current liabilities of $269.1 million and the long-term liabilities of $123.7 million combined!
Calculating the 'current ratio', adding the 'other current assets' to the 'cash' results in a total of $854 million in current assets which when compared to the $269.1 million in current liabilities yields a very strong ratio of 3.17 suggesting a very solvent company easily able to pay its current bills.
Examining Yahoo "Key Statistics" on ResMed, we can see thatwith a market capitalization of $3.44 billion, ResMed qualifies as a "mid cap" stock. The company currently trades at a trailing p/e of 23.97, which might by itself be considered 'rich', but taking into consideration the '5 yr expected' earnings, the company actually has a very reasonable PEG ratio of only 0.96.
Yahoo reports that the company has 75.54 million shares outstanding with 70.51 million that float. As of 8/26/09, there were 3.82 million shares out short. With an average trading volume recently placed at 371,244 shares, this works out to a short ratio (as of 8/26/09) of 8.4. Applying my own arbitrary '3 day rule' on short interest, this appears to be significant in terms of a potential short squeeze driving the stock higher in the face of any additional good news.
No dividends are paid and as I earlier noted, the company last split its stock in October, 2005, with a 2:1 stock split.
If we look at the 'point & figure' chart on ResMed (RMD) from StockCharts.com, we can see that the stock has been under pressure for the last several years, with sequential lower lows culminating in a low in July, 2008, at $29/share. Recently the stock has been generating a short series of higher highs and higher lows and appears to be positioned to move higher without appearing overextended.
To summarize, I have been a big fan of ResMed (RMD). I believe in the utility of their product---the health benefits of treating obstructive sleep apnea appear obvious. But beyond this, ResMed is a company that has been generating revenue and earnings growth, maintaining its outstanding shares, and reporting solid financial numbers in these somewhat less than solid financial times.
Valuation-wise, the p/e is a bit rich, but when taken into consideration the expected growth rate doesn't appear rich at all. There are quite a few shares out short (as of latest Yahoo numbers) which may also support further price appreciation. Their last quarter was strong and they beat expectations. Now, if only they paid a dividend too!
ResMed (RMD) is the kind of stock I would like to get back into my own trading portfolio if the opportunity should arise. Meanwhile, I shall wait for my own holdings to indicate whether it is time to be shifting from cash into another holding or in fact selling a holding and moving towards cash!
If you have any comments or questions, please feel free to leave them on the blog or email me at bobsadviceforstocks@lycos.com.
Yours in investing,
Bob
Posted by bobsadviceforstocks at 8:22 PM CDT
|
Post Comment |
Permalink
Updated: Sunday, 20 September 2009 10:15 PM CDT
Sunday, 6 September 2009
Church & Dwight (CHD) "Revisiting a Stock Pick"
Hello Friends! Thanks so much for stopping by and visiting my blog, Stock Picks Bob's Advice! As always, please remember that I am an amateur investor, so please remember to consult with your professional investment advisers prior to making any investment decisions based on information on this website.
I apologize to my readers for my relative paucity of posts to my blog. I am committed to continuing to share my ideas with all of you and certainly to continue to offer you my actual experience in my own trading account.
The economic deterioration appears to have slowed in intensity yet it has not yet reversed direction. As reported the other days, the national unemployment rate as of August, 2009, has reached 9.7%, the highest level since June, 1983. The economy shed 216,000 jobs in August, an awful figure yet a continuation of the gradual improvement from June, 2009 when the number was 463,000 jobs lost and July, 2009.when 276,000 jobs disappeared. Suddenly less bad news is becoming good news!
On another cautiously optimistic note we are also seeing improvement in the housing number figures. Sales of new homes rose 9.6% in July 2009, making it 3 months in a row of improved figures. Bank failures continue to be reported; we are up to 84 this year, from 25 in 2008 and 3 in all of 2007! And retail sales remain week with sales in August 2009 dipping an average of 2.9% with the only good news being that it wasn't as bad as was expected---analysts had been looking for a 3.8% decline according to a survey by Thomson Reuters.
Considering this bearish although seemingly improving environment, it is no wonder that an amateur investor like myself has grown increasingly conservative in my own approach. But my philosophy hasn't really changed in terms of the kind of stocks and the kind of financial underpinnings to those companies that make me personally find them attractive for consideration.
I would like to share with you another look at Church & Dwight (CHD), a stock that I first reviewed back in January 31, 2006 here on this blog, when it was trading at $36.80. I still do not own any shares of this company but it is one that is on my own investing horizon. Church & Dwight (CHD) closed at $56.50 on September 4, 2009, down $.31 or (.55)% on the day.
What do they do?
They are a household products company with products ranging from baking soda to toothpaste to laundry detergent. As the Yahoo "Profile" on CHD explains, Church & Dwight
"...together with its subsidiaries, develops, manufactures, and markets a range of household, personal care, and specialty products under various brand names in the United States and internationally. The company operates in three segments: Consumer Domestic, Consumer International, and Specialty Products. The Consumer Domestic segment offers household products for deodorizing, such as ARM & HAMMER baking soda and cat litter products; laundry and cleaning products, including XTRA and ARM & HAMMER laundry detergents, OXICLEAN pre-wash laundry additive, SCRUB FREE, KABOOM, ORANGE GLO, and BRILLO cleaning products; and personal care products, such as TROJAN condoms, ORAJEL oral analgesics, NAIR depilatories and waxes, FIRST RESPONSE and ANSWER home pregnancy and ovulation test kits, ARRID and ARM & HAMMER antiperspirant, and SPINBRUSH battery-operated toothbrushes. The Consumer International segment primarily sells various personal care products in international markets, including France, the United Kingdom, Canada, Mexico, Australia, Brazil, and China. The Specialty Products segment produces sodium bicarbonate, which it sells together with other specialty inorganic chemicals for a range of industrial, institutional, medical, and food applications."
In other words, they are a rather diversified consumer business providing for basic needs in many markets worldwide.
How are they doing?
Let's take a look at a few of the financial numbers that make me more convinced of the suitability of this 'stock pick' for my blog. First of all, as I like to do, let's review the latest quarterly financial result.
On August 4, 2009, CHD reported 2nd quarter results. For the quarter ended June 26, 2009, earnings came in at $58.2 million or $.81/share. This was up from $45.8 million or $.66/share the prior year same period. Sales for the quarter increased to $623.1 million from $594 million. Thus it wasn't a bad quarter at all for Church & Dwight!
More importantly perhaps to anticipate the stock price reaction to any piece of news, is what analysts were expecting. In this case, analysts polled by Thomson Reuters had been expecting net income of $.79/share on revenue of $611.5 million. Thus CHD beat expectations on both earnings and revenue results!
In addition, it is also a big plus in my book if we can hear something positive from management within these announcements regarding future results. In fact CHD went ahead and raised earnings expectations for the year to a range of $3.36 to $3.40/share from prior guidance of $3.30 to $3.35 per share. Analysts according to Thomson Reuters had previously been expecting profit of $3.35/share. Thus the guidance was above expectations!
As if this wasn't enough, the company went ahead and announced a significant increase in the dividend from $.09/share to $.14/share. So while we have many stocks with revenue dips, uncertain guidance, and dividend cuts, Church & Dwight comes out and knocks one 'right out of the park'!
What about longer-term?
There are many places to find this sort of information. For several years now I have been utilizing Morningstar.com which provides the individual investor what I believe to be a very useful amount of information. In particular, the "5-Yr Restated" financials on Church & Dwight (CHD) is a very useful place to start.
Here we can see clearly illustrated the steady increase in revenue from $1.4 billion in 2004 to $2.42 billion in 2008 and $2.48 billion in the trailing twelve months (TTM). Earnings have also steadily increased from $1.36/share in 2004 to $2.78/share in 2008 and $3.00/share in the TTM. Dividends are not only paid to shareholders but they also have been steadily increased from $.21/share in 2004 to $.34/share in 2008 and $.36/share in the TTM, with a new indicated payment of $.56/share going forward as I just noted above. Outstanding shares, where I might actually prefer to see a diminution of numbers, have only been modestly increased from 68 million in 2004 to 71 million in 2008 and the TTM.
Free cash flow is positive and steadily increasing. $139 million reported in 2006, up to $336 million in 2008 and $400 million in the TTM.
The balance sheet appears solid with $357.0 million in cash and $481.0 million in other current assets per Morningstar with $500.9 million in current liabilities yielding a current ratio of approximately 1.8. The company does have $1.03 billion in long-term liabilities on its books.
What about valuation?
Looking at Yahoo "Key Statistics" on CHD, we see that the company is a mid-cap stock with a market capitalization of $3.97 billion. The trailing p/e is a moderate 18.80, with a forward p/e estimated at 14.75. The PEG suggests a reasonable p/e valuation with a value of 1.32. There are 70.3 million shares outstanding with 64.78 million that float. As of 8/11/09, there were 2.92 million shares out short, yielding a mildly significant short interest ratio of 4.2. (I assign 'significance' on this ratio when there are over 3 days of short interest needed to be covered in case of a 'squeeze').
The company pays a forward dividend of $.56/share yielding 1.00%. With a payout ratio of only 12%, this dividend appears to be relatively secure. The stock was last split back in September, 2004, with a 3:2 stock split.
What about the chart?
If we look at a "point & figure" chart on Church & Dwight (CHD) from StockCharts.com, we can see that the stock price made a strong move from February, 2003 when the stock was trading at around $18.50 to a high of $65 back in September, 2008. Since that time, along with the rest of the market, the stock has traded sideways, but recently, in April, 2009, broke through resistance at $54 and now is trading in an upward direction above support levels.

Summary:
To summarize, I don't really much like the economic environment that we find ourselves. Who does? We have all watched our 401k's and IRA's and personal accounts get clobbered as the economy slipped into recession and the market into a devastating bear market. Things do look a bit more hopeful recently.
To select stocks in this environment is treacherous. But if we can think about any particular type of company that might survive in this environment, a consumer staples company like Church & Dwight (CHD) might fit the bill.
As I have noted, in the latest quarter they reported increasing revenue, increasing earnings, beat expectations on both and raised guidance. They also raised their dividend! But these are not one-time events. This company has been performing like this for years!
Valuation is reasonable if not cheap. The stock chart appears reasonably optimistic in face of a difficult investing world.
I continue to employ my own investing strategy of waiting for my own holdings to advance to targeted appreciation levels before adding a new position and limiting my losses on the downside. But if I am given the opportunity to buy something new, this is the kind of stock that I shall be considering!
Thanks again for dropping by and visiting. I do not blog as often as I have and probably should, but I appreciate your visits, your comments, and your occasional encouragement! If you have any comments or questions, please feel free to reach me at bobsadviceforstocks@lycos.com.
Yours in investing,
Bob
Posted by bobsadviceforstocks at 6:06 PM CDT
|
Post Comment |
Permalink
Updated: Sunday, 6 September 2009 6:15 PM CDT
Newer | Latest | Older


