Stock Picks Bob's Advice
Sunday, 29 June 2014
Williams-Sonoma (WSM)
Hello Friends! Thanks so much for stopping by and visiting my blog Stock Picks Bob's Advice! As always please remember that I am amateur investor, so please remember to consult with your professional investment advisers prior to making any investment decisions based on information on this website.
 On May 21, 2014, I purchased shares of Williams-Sonoma at $63.80/share for my Covestor Growth and Momentum model. WSM closed at $71.87 on June 27, 2014 for a nice gain in a relatively short holding period.
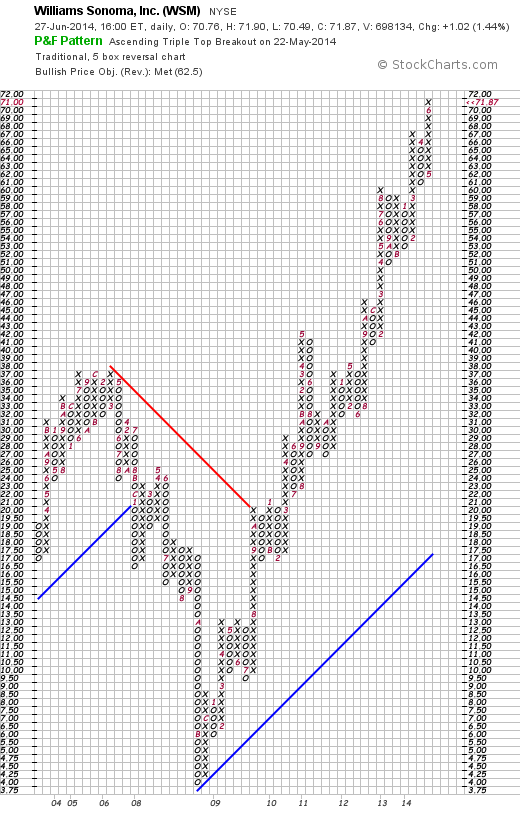
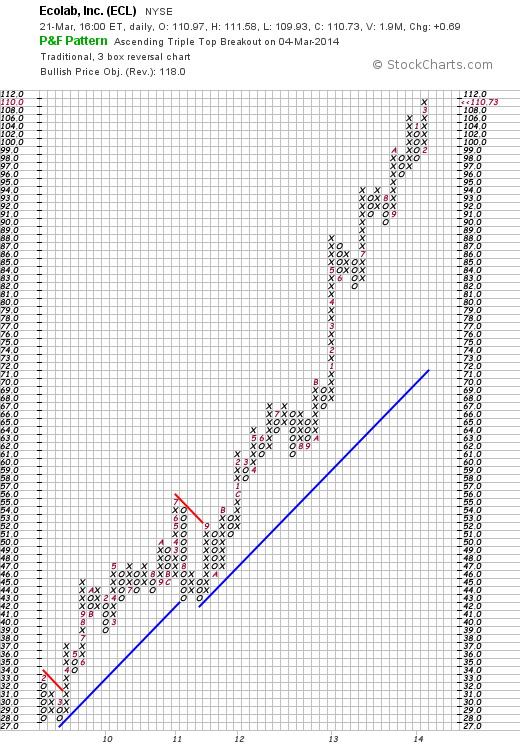
This stock is an 'old favorite' of mine here on this blog as I first wrote it up on August 25, 2004, nearly ten years ago (!) when it was trading at $34.64. In retrospect it might appear that I had made a brilliant selection, but in reality the stock nearly collapsed into the 2008 financial mess bottoming at approximately $4.00/share November, 2008 as the following StockCharts.com 'point and figure' chart shows.
Most of us are quite familiar with Williams-Sonoma (WSM) which may be found in many high-end malls with their clever and expensive gadgets that make Espresso or Waffles or process food with the many clever devices and utensils. They also operate the Pottery Barn brand. As the Yahoo.com profile describes them, the company
"...operates as a multi-channel specialty retailer of home products. The company operates in two segments, Direct-to-Customer and Retail. It offers cooking, dining, and entertaining products, including cookware, tools, electrics, cutlery, tabletop and bar, outdoor, furniture, and a library of cookbooks essentials under the Williams-Sonoma brand; furniture,  bedding, bathroom accessories, rugs, curtains, lighting, tabletop, outdoor, and decorative accessories under the Pottery Barn brand; and products designed for creating magical spaces where children can play, laugh, learn, and grow under the Pottery Barn Kids brand. The company also provides an assortment of products, including furniture, bedding, bathroom accessories, rugs, curtains, lighting, decorative accessories, dinnerware, kitchen essentials, and gifts under the West Elm brand; and a line of furniture, bedding, lighting, decorative accents, and others for teen bedrooms, dorm rooms, study spaces, and lounges under the PBteen brand. In addition, it offers lighting and home-goods product lines, including lights, hardware, furniture, and home décor that span periods back to the 1870s; and women’s and men’s accessories, small leather goods, jewelry, key item apparel, paper, entertaining and bar, and home décor, as well as seasonal items under the Mark and Graham brand. The company markets its products through e-commerce Websites, direct mail catalogs, and specialty retail stores."
What really grabbed my attention wasn't the gadgets, the stores, the Peter Lynch part of investing, but simply the outstanding fundamental and technical performance of the stock. On May 21, 2014, WSM announced 1st quarter 2014 results. First quarter revenues increased 9.7% to $974 million vs $888 million in the prior year same period. Operating income increased 16.5% to $74 million and operating margin increased to 7.6% compared to 7.2% the prior year same period. Earnings for the quarter increased 20% to $.48/share. Expectations for the quarter of $.44/share were easily surpassed.
Total same-store sales growth increased by 10% in a somewhat anemic retail environment. For the full year WSM guided to same-store sales growth in the 5% to 7% range---still an impressive number.
I do not believe that stocks should be purchased on the basis of a single great quarter if everything else isn't also 'in line'. It is important to identify those companies that perform well quarter after quarter IMHO. Let's take a look at the Morningstar.com '5 Years Financials' on Williams-Sonoma (WSM). Revenue has steadily increased from $3.1 billion in 2010 to $4.39 billion in 2014 and $4.47 billion in the trailing twelve months (TTM). Net income has also steadily increased from $77 million in 2010 to $279 million in 2014 and $286 million in the TTM. Diluted earnings per share have also steadily increased from $.72/share in 2010 to $2.82/share in 2014 and $2.92/share in the TTM. Meanwhile outstanding shares, which did increase from 107 million in 2010 to 110 million in 2011 have subsequently been decreasing each year to 99 million in 2014 and 98 million in the TTM.
 Taking a quick look at the Balance Sheet on Morningstar, we can see that Total current assets total $1.42 billion, with Total current liabilities coming in at $861 million for a healthy current ratio of 1.65. Free cash flow remains positive but has fluctuated with $418 million in 2010 dipping to $159 million in 2013 with $259 million reported in the TTM.
What about valuation? Is Williams-Sonoma (WSM) still priced at a level worth considering a new committment of funds?
According to the Yahoo "Profile" on WSM, this company has a market cap of $6.76 billion making it a 'mid cap' stock. The trailing P/E is a moderate 24.49, not what I would call 'cheap' but then again not bad considering its current financial performance. Thus the Forward P/E (fye Feb 2, 2016) is estimated at 19.69 with a PEG Ratio (5 year expected) a tad rich for me also at 1.63 but really not excessive from my amateur perspective.
According to Yahoo WSM has 94.1 million shares outstanding with a float of 81.8 million. As of May 31, 2014, there were 4.00 million shares out short, a bit of a significant short interest ratio--using my own arbitrary 3 day rule for significance. The company pays a forward dividend of $1.32/share (up from $1.26 in the trailing 12 months--in itself a positive finding) with a forward estimated yield of 1.9%. The company has a payout ratio of 43%. The company has been increasing its dividend regularly for at least the last 8 years. Williams-Sonoma last split its stock with a 2:1 split back on May 10, 2002.
To summarize, there are so many different reasons I find this stock very attractive. Besides the intuitive delight in visiting their main chains of Pottery Barn and Williams-Sonoma stores, the company reported a solid quarter and raised guidance for the year (although it did express cautious guidance for the 2nd quarter), they have been executing well for the past five years. Valuation isn't cheap but it is reasonable. Technically the stock is firing on all cylinders. To top it off I love their waffle irons :).
Thanks so much for stopping by and visiting my blog! If you have any comments or questions, please feel free to leave them here.
Yours in investing,
Bob
Wednesday, 7 May 2014
Anika Therapeutics (ANIK)
Hello Friends! Thanks so much for stopping by and visiting my blog, Stock Picks Bob's Advice! As always, please remember that I am an amateur investor, so please remember to consult with your professional investment advisers prior to making any investment decisions based on information on this website.
 On May 5, 2014, I purchased shares of Anika Therapeutics (ANIK) for the Covestor Healthcare Model at a cost of $47.19. Anika (ANIK) closed at $45.94 on 5/7/14 for a gain on the day of $.76 or (1.68)%
This model has been a terrific performer for me and for those on Covestor who are following along. Over the last 365 days the Model is up 34.3% and since its inception (October 6, 2010), the Covestor Healthcare Model has experienced an annualized appreciation of 18.6% exceeding the S&P 500 which during the same period appreciated 16.7% annually but lagging the S&P 500 Healthcare Index which averaged a 21.7% gain. Unfortunately, this Model also pulled back during the rather severe March and April Biotech correction.
At the same time that the Biotech Correction was developing, the so-called 'momentum stock correction' also kicked in taking its toll on many of my same holdings. From my own perspective, I do not think it is really possible that momentum stocks will fail to rise. It is simply that the stock market experienced a rotation out of old momentum names into other names that hadn't appreciated to quite as lofty of levels. As one of my favorite stock market commentators Jim Cramer would say, "There is always a bull market somewhere!"
With some cash within the model from prior sales of correcting healthcare stocks, I purchased shares of Anika (ANIK), a fast-growing company which according to the Yahoo "Profile":
"...develops, manufactures, and commercializes therapeutic products for tissue protection, healing, and repair in the United States, Europe, and internationally. The company’s products are based on hyaluronic acid (HA), a naturally occurring biocompatible polymer found in the body. Its orthobiologics products comprise ORTHOVISC, ORTHOVISC mini, and MONOVISC for the treatment of osteoarthritis of the knee and joints; Hyalofast, a biodegradable support for human bone marrow  mesenchymal stem cells that is used in connection with soft tissue regeneration; Hyalonect, a woven gauze used as a graft wrap; Hyaloss used to mix blood/bone grafts to form a paste for bone regeneration; and Hyaloglide, an ACP gel used in tenolysis treatment. The company’s dermal products include wound care products that comprise Hyalomatrix and Hyalofill, for treatment of complex wounds, such as burns and ulcers; Hyalograft 3D and Laserskin scaffolds for use in connection with the regeneration of skin; and ELEVESS, an aesthetic dermatology product. Its surgical products comprise Hyalobarrier, a post-operative adhesion barrier for use in the abdomino-pelvic area; INCERT, a HA product for the prevention of spinal post-surgical adhesions; Merogel, a woven fleece nasal packin; and Merogel Injectable, a viscous hydrogel. The company’s ophthalmic products include AMVISC, AMVISC Plus, STAARVISC-II, Optivisc, AnikaVisc, and AnikaVisc Plus that are injectable HA products used as viscoelastic agents in ophthalmic surgical procedures, including cataract extraction and intraocular lens implantation; and veterinary product comprise HYVISC, an injectable HA product used for the treatment of joint dysfunction in horses."
On April 29, 2014, Anika (ANIK) reported 1st quarter 2014 results. Revenue for the quarter came in at $34.0 million, up 124% from the $15.2 million in the same quarter the prior year. Net income for the quarter came in at $15.0 million or $.97/share up 378% from $3.1 million or up 362% from the $.21/diluted share the same quarter last year. Needless to say these are phenomenal growth numbers for this company.
A highlight for the company during the quarter was the FDA approval of Monovisc which is an injection into the knee to treat people with osteoarthritis who might benefit from this hyaluronic acid which acts as a supplement to the synovial fluid lubricating the knee joint. It is estimated that 80% of Americans over the age of 65 have knee osteoarthritis. Clearly this is a very big market as all of us baby boomers age!
In terms of longer-term results, examining the Morningstar.com "5 Years Financials" on Anika, we can see that revenue has grown steadily from $40 million in 2009 to $75 million in 2013 and $94 million in the trailing twelve months (TTM). Diluted earnings per share have literally sky-rocketed from $.32/share in 2009 to $1.39/share in 2013 and $2.15/share in the trailing twelve months. Outstanding shares have increased from 12 million in 2009 to 15 million in the TTM.
Some of the highlights from the Morningstar.com report on the balance sheet shows that as of 12/2013 ANIK had $95 million in total current assets balanced against $9 million in total current liabilities and NO long-term debt. Free cash flow has improved from $(1) million in 2009 to $25 million in 2013 and $32 million in the TTM.
According to the Yahoo "Profile" on Anika (ANIK), the company's stock should be considered a Small Cap stock with market capitalization calculated at $664.34 million. The trailing P/E is reported at 21.28. (The forward P/E, according to Yahoo is 27.84, but I suspect this estimate is lagging the latest quarter and the spectacular growth in revenue and earnings just reported.) In fact, the PEG Ratio, utilizing the estimated 5 year growth, comes in at a very reasonable 0.68.
Yahoo reports 14.46 million shares outstanding with 14.09 million that float. As of 4/15/14 there were 670,860 shares out short representing a short interest ratio of 2.3 trading days. No dividends are paid and no stock splits are reported.
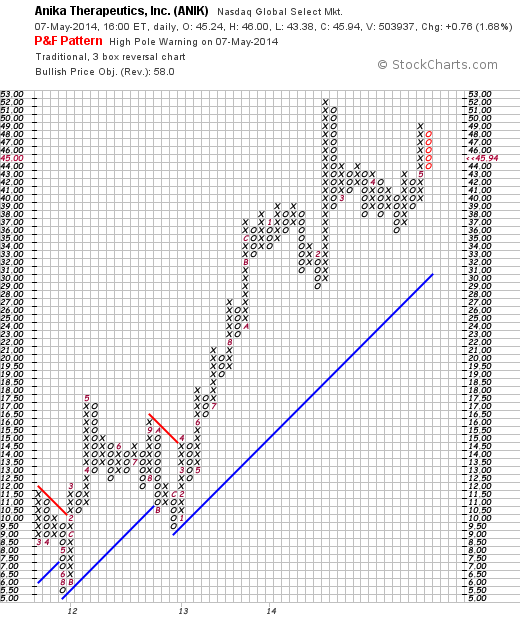
In terms of the technical performance of the stock price, looking at a 'point & figure' chart on Anika (ANIK) from StockCharts.com, we can see that the stock has appreciated sharply from $5.00/share in July, 2011 to a high of $52 in February, 2014. The stock has been consolidating at that level and is trading below the high but overall the chart still appears quite strong from my amateur perspective!
To summarize, I recently purchased shares of Anika Therapeutics (ANIK) in my Covestor Healthcare Model. This is a small company with a rapidly growing product line based around Hyalonic Acid product in Orthopedic, Dermatologic, Ophthalmic and Neurosurgical procedures among other uses. They recently reported what I could only describe as phenomenal quarterly results and they have been growing rapidly for at least the past five years. Their financials are gorgeous as they are cash rich and have no long-term debt and little current liabilities. In fact, they are growing their free cash flow rapidly as well. The valuation is modest with a P/E only at about 21 and a PEG well under 1.0. The chart is equally impressive. In fact, there is little I can find to criticize if only that the company is concentrated around a variety of products conncected to the Hyaluronic Acid material.
Thank you again for stopping by and visiting. If you have any comments or questions, please feel free to leave them here on this website.
Yours in investing,
Bob
Saturday, 3 May 2014
Skyworks Solutions (SWKS)
Hello Friends! Thanks so much for stopping by and visiting my blog, Stock Picks Bob's Advice! As always please remember that I am an amateur investor, so please remember to consult with your own investment advisers prior to making any investment decisions based on information on this website.
Five years ago, on April 15, 2009, I have been managing the Growth and Momentum Model on Covestor. Since inceptiion, this model has returned 11.4% on an annualized basis as of May 1, 2014. 2013 was a strong year for the model as it appreciated 37.8% vs 32.4% for the S&P 500. However, 2014 has not been as generous to the Covestor Growth and Momentum portfolio as it has declined (5.7)% since the first of the year. This model is composed of stocks that I have chosen that represent what I believe to be holdings that can continue to produce sustained financial results that can result in above average gains. I hold up to 20 positions in the Model and generally sell them rather quickly if they incur losses for me.
 Currently, one of the stronger holdings in the portfolio is Skyworks Solutions (SWKS) that I acquired for the Model on February 12, 2014, at a cost of $30.47. SWKS closed at $41.43 on May 2, 2014, up $.18 or .44% on the day.
According to the Yahoo "Profile" on Skyworks, the company
"...together with its subsidiaries, provides analog semiconductors  worldwide. Its product portfolio includes amplifiers, attenuators, battery chargers, circulators, DC/DC converters, demodulators, detectors, diodes, directional couplers, front-end modules, hybrids, infrastructure radio frequency subsystems, isolators, LED drivers, mixers, modulators, optocouplers, optoisolators, phase shifters, phase locked loops/synthesizers/VCOs, power dividers/combiners, power management devices, receivers, switches, voltage regulators, and technical ceramics. The company also offers MIS silicon chip capacitors and transceivers. It provides products for supporting automotive, broadband, cellular infrastructure, energy management, GPS, industrial, medical, military, wireless networking, smartphone, and tablet applications."
On April 22, 2014 Skyworks (SWKS) reported 2nd quarter 2014 results. As Zacks reported, they came in at $76.9 million or $.40/share in net income up from $61.7 million or $.32/share the prior year same period. Adjusted earnings were $.62/share compared to $.48 last year exceeding Zacks estimates of $.51/share.
Revenue for the period came in at $481.0 million, up 13.1% over the prior year and exceeding estimates of $470 million. In addition, the company initiated a dividend of $.11/share during the quarter and reported that they had repurchased approximately 2 million shares of stock during the period.
In addition they provided strong guidance for the 3rd quarter 2014 period in which they now expect revenue growth of 23% year-over-year and diluted earnings to show growth of 35% to $.73/share.
Interestingly, the company has a strong 'green' manufacturing effort and reported in the 2013 Sustainability Report that during the year they reduced carbon dioxide emissions by 32% and improved water efficiency by 8%.
Reviewing the Morningstar.com "5 Yrs Financials" on Skyworks, we can see that the company has been growing its revenue quickly with $803 million reported in 2009 increasing to $1.79 billion in 2013 and $1.84 billion in the trailing twelve months (TTM).
Diluted earnings per share have increased rapidly, but not quite as consistently, from $.55/share in 2009 to $1.45/share in 2013 and $1.60/share int he TTM. Outstanding shares have increased from 170 million in 2009 to 192 million in the TTM.
Morningstar, as of 9/2013 reports Skyworks Solutions with $1.07 billion in current assets as compared to $180 million of current liabilities, generating a current ratio of 5.94. Free cash flow has also been growing nicely with $171 million reported in 2009 increasing to $376 million in 2013 and $397 million in the TTM.
In terms of valuation, looking at the Yahoo "Key Statistics" on SWKS, we can see that this stock is a Mid Cap Stock with a market capitalization of $7.83 billion.
The stock is moderately priced with a trailing P/E of 25.89. However, the forward P/E drops sharply (fye Sep 27, 2014 est) to 12.99 due to rapid growth in earnings expected in the near future and thus the PEG ratio is reported at 0.87---for me a reasonable value is 1.0 to 1.5.
Yahoo reports 188.93 million shares outstanding with 187.79 million that float. As of March 31, 2014, there were 5.28 million shares out short, representing a short interest ratio of 1.60 (I personally use a 3 day short ratio to determine significance). The company, as reported above, just initiated a quarterly dividend of $.11/share--assuming a $.44/share annual rate this would result in a dividend of just over 1%. The stock last split its stock with a 2:1 split 14 years ago on April 20, 2000.
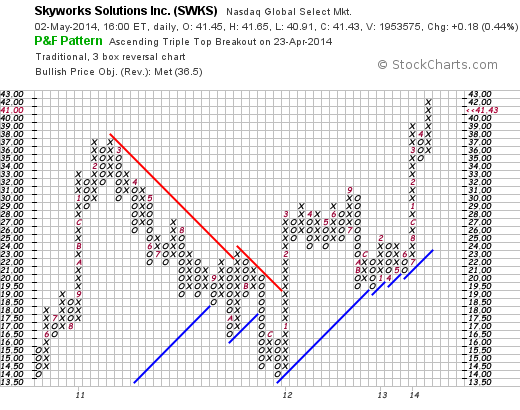
Looking at the SWKS "Point & Figure" chart from StockCharts.com, we can see that the stock price has been quite volatile with the stock trading at $14 in May, 2010, climbing to $38 in February, 2011, only to slip back to $14/share in December, 2011. Since that time, the stock has climbed, albeit somewhat unsteadily, to its current level of $41.43, exceeding the prior high with what appears to be a very bullish break-out.
While this is certainly not a Peter Lynch style of investment, with something that I can easily understand or something my daughter might buy in the local mall, this still is a terrific stock to consider. However, with the company providing some of the 'guts' in the form of electronic components for smartphone manufacturers including Apple (AAPL) and Samsung, the intuitive part of this investment decision becomes more obvious.
Skyworks (SWKS) reported strong earnings that beat expectations. They guided to a strong quarter and they have at least a five year record of rapidly growing revenue and earnings while producing strong free cash flow and their balance sheet is impeccable. The valuation of this stock is reasonable with a forward P/E in the low teens and a PEG under 1.0. Finally the stock price is encouraging as this stock is moving higher in a relatively anemic market environment. What is there not to like?
I recently purchased shares in Skyworks Solutions (SWKS) for my Covestor Growth and Momentum Model and thus far it is working out for me. I cannot predict the stock performance or even the company performance for the future, but thus far all of the ingredients appear to be present to see this 'cake' rise a little higher!
Thank you again for stopping by and visiting my blog! If you have any comments or questions, please feel free to leave them right here.
Yours in investing,
Bob
Sunday, 23 March 2014
Ecolab (ECL) "Revisiting a Stock Pick"
Hello Friends! Thanks so much for stopping by and visiting my blog, Stock Picks Bob's Advice! As always, please rememeber that I am an amateur investor, so please remember to consult with your professional investment advisers prior to making any investment decisions based on information on this website.
On April 15, 2009, my Covestor Growth and Momentum Model (Originally called "Buy and Hold Value") was initiated as one of the first ten models on the Covestor website. Since that time, as of March 20, 2014, the Portfolio has returned an annualized 12.4% and during the past 365 days 20.1% slightly behind the S&P 500's 22.7% return.
 Ecolab (ECL) is currently my top gainer in my Growth and Momentum Model on Covestor. It also is a favorite of mine on my blog where I last wrote it up on May 2, 2010, almost 4 years ago. I also commented on Ecolab on February 8, 2009 and previously commented on December 13, 2008. Clearly I like this stock! I like their business, their financial results, and the performance of their stock. Currently in my Covestor model I have an average cost of $66.29. Ecolab (ECL) closed at $110.73 on March 21, 2014, with a gain of $.69 or 0.63% on the day.
According to the Yahoo "Profile" on Ecolab (ECL), the company
"... provides water, hygiene, and energy technologies and services for customers worldwide. The company operates in four segments: Global Industrial, Global Institutional, Global Energy, and Other. The Global Industrial segment provides water treatment and process applications, 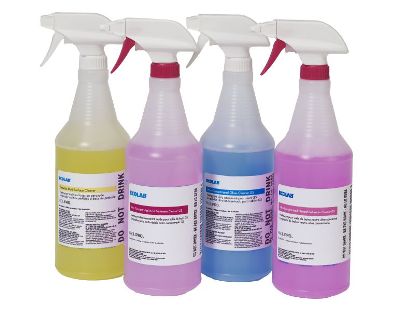 and cleaning and sanitizing solutions primarily to large industrial customers within the manufacturing, food and beverage processing, chemical, mining and primary metals, power generation, pulp and paper, and commercial laundry industries. The Global Institutional segment offers specialized cleaning and sanitizing products to the foodservice, hospitality, lodging, healthcare, government and education, and retail industries. The Global Energy segment provides the process chemicals and water treatment needs of the petroleum and petrochemical industries in both upstream and downstream applications. The Other segment offers pest elimination, and kitchen repair and maintenance services."
On February 21, 2014, Ecolab reported fourth quarter 2013 results. For the quarter ended December 13, 2013, sales increased 17% to $3.6 billion compared to $3.04 billion in the prior year same period. Operating income for the quarter grew 19% to $471 million from $396 million the prior year. Diluted earnings per share increased 17% to $1.04 on an adjusted basis compared to prior year results of $.89/share. At the same time the company provided strong guidance for 2014 full-year earnings in the $4.10 to $4.20/share range representing a 16-19% increase for the year. Guidance for the first quarter 2014 was also shared and represented a strong 18-25% increase in earnings to the $.70-$.75 range. Overall a very nice report!
Reviewing the "5 years" financials on Morningstar for Ecolab, we can see that revenue has climbed from $5.9 billion in 2009 the $13.3 billion in 2013, Diluted earnings have grown from $1.74/share in 2009 to $3.16/share in 2013. Diluted shares have increased from 240 million in 2009 to 306 million in 2013.
Morningstar reports Total Current Assets of $4.7 billion compared to Total Current Liabilities of $3.5 billion for a calculated current ratio of 1.34. Free cash flow has increased from $398 million in 2009 to $898 million in 2013.
Reviewing some valuation numbers on Yahoo "Key Statistics" for Ecolab, we can see that the company is a large cap stock with a market capitalization of $33.3 billion. The trailing P/E is a bit rich at 35.04 but with continued growth expected carries a forward P/E (fye Dec 31, 201) of 22.97 yielding a PEG ratio of 1.85 still a bit rich with my preferred range being 1.0-1.5. Yahoo reports 300.77 million shares outstanding with 271.3 million that float. As of February 28, 2014, there were 2.4 million shares out short yielding a short interest ratio of 2.0 (below my own arbitrary 3 day rule for significance.)
Ecolab pays a forward annual dividend rate of $1.10 yielding 1.00%. (This is an increase from the trailing dividend of $1.01). The company has a payout ratio of 31% suggesting room for future dividend increases. The last stock split was a 2:1 split back on June 9, 2003.
Technically, Ecolab has a beautiful chart as this Point & Figure chart from StockCharts.com demonstrates. From $28 a share in March, 2009, the stock has steadily climbed to its current lofty level of $110.73. If anything the stock has gotten a little ahead of itself but with continued strong earnings reports, I suspect this chart can be sustained.
In summary, Ecolab (ECL) has been a stock that has caught my attention here on this blog in the past. I do own shares of this stock in my Covestor Growth and Momentum Model where it has performed the strongest of my holdings.
They recently reported strong earnings, guided to a strong first quarter and year 2014, and have a terrific chart. They are a bit richly priced with a P/E in the mid 30's and a PEG just over 1.5. However the consistent financial results appear to be well worth the premium. I like the service industry that Ecolab finds itself where it is a bit of a competitor to another favorite of mine Sysco (SYY) which I shall need to revisit at another time!
To summarize Ecolab helps business clean things and this investor has been cleaning up with Ecolab.
If you have any comments or questions, please feel free to leave them here.
Yours in investing,
Bob
Saturday, 22 March 2014
The Covestor Healthcare Model Catches a Cold
Hello Friends! Thanks so much for stopping by and visiting my blog, Stock Picks Bob's Advice! As always, please remember that I am an amateur investor, so please consult with your professional investment advisers prior to making any investment decisions based on this website.
Since October 6, 2010, I have been managing the Covestor Healthcare Model which has had a terrific performance to date! Since that time, the portfolio has returned an annualized 21.8% exceeding the S&P 500 during that time which returned 17.3% but slightly lagging the S&P 500 Healthcare Index which actually has returned 23.6% during the same period.
In fact, over the past 365 days, the portfolio as of Friday, March 21st was up 52.9% in a phenomenal run. That is until Friday when some of the top performers in my Model came under pressure when questions were raised in Congress regarding the cost of some of the more expensive treatments including the $84,000 12 week treatment for Hepatitis C.
Some of the high-fliers in my model that were hit hard include Alexion (ALXN) which closed at $159.79, down $13.87 (7.99)%, Biogen Idec (BIIB) which dipped $28.51 to close at $318.53 or (8.22)%, Gilead Sciences (GILD)down $3.46 to $72.07 or (4.57)%, Questcor Pharmaceuticals down $1.84 (2.87)% to $62.30, and Illumnia (ILMN) down $8.74 (5.42)% to $152.60.
With markets already skittish over the problems in the Ukraine, continued concerns about further Fed tapering and interest rate increases, and recent suggestions that the American economy is far from experienceing a robust recovery, and the S&P already near a record high, it didn't take much of a prod to get me to sell many of these terrific companies that had produced the terrific portfolio for my Covestor model.
I sold my Alexion (ALXN) shares of Friday 3/21/14 at $165.24, my Biogen Idec (BIIB) shares at $324.30, Gilead (GILD) at $71.40, Illumnia (ILMN) at $153.80, and Questcor (QCOR) at $61.91.
It is a big responsibility being a manager of a Covestor Model. Besides managing one's own holdings, one must be aware of the responsibility that a manager has to others who may be mirroring his or her moves. I remain committed to identifying investment opportunities while remaining very risk averse. As I have demonstrated, I am prepared to sell even some of my favorite stocks if I believe that the risks have grown beyond the opportunities presented. I know that some of my decisions will be wrong but over the long haul, I hope that I can continue to keep this portfolio performing in a respectful fashion.
After the above sales, the portfolio remains 70% in equities and only 30% in cash. Some of the stronger stocks in the portfolio include Actavis (ACT), the generic drug manufacturer, McKesson (MCK) the pharmaceutical distributor, StJude (STJ) the medical device manufacturer, and Amgen (AMGN), another biotech stock I have stayed with.
As the dust settles out, I am prepared to re-enter the market in many of the same names I just cut from the portfolio. The Covestor Healthcare Portfolio caught a bad cold Friday. I gave it my best treatment and hopefully this patient will be up and moving again next week.
Yours in investing,
Bob
Sunday, 19 January 2014
A New Covestor Model
Hello Friends! Thanks so much for stopping by and visiting my blog, Stock Picks Bob's Advice! As always, please remember that I am an amateur investor, so please remember to consult with your professional investment advisers prior to making any investment decision based on information on this website.
 As many of the regular readers to this blog realize, I have had the opportunity to work with Covestor to establish models based on my own ideas for investing. My very first model to be available to the public was the Growth and Momentum Model which dates back to April 15, 2009, and had a great 2013 with a 37.8% appreciation. Since inception, this model has returned an average of 12.9% net of fees.
On October 6, 2010, my Healthcare Model was released on Covestor. By far this has been my best performer due to what I hope is good decisions on my part as well as simply having a portfolio in a very hot sector! In 2013, this model returned 49.8% (net of fees) beating the very strong S&P 500 Healthcare Index which returned 41.5% and the still strong S&P 500 which finished out the year with a 32.4% gain.
On December 26, 2011, Covestor launched my Sustained Momentum Model. This model was my first 'algorithmic investing' model. Although not implemented by a computer program, but rather by my own entered trade instructions, this portfolio is designed to invest in 10-12 of the top performing stocks within a larger group of approximately 50 stocks that I am monitoring. Simply put, I am investing and holding on to the top 10-12 stocks based simply on their past price momentum since I began monitoring them. This particular model includes strong stocks like Valeant Pharmaceuticals (VRX) and Johnson Controls (JCI) which have done quite well for me. In 2013, this model trailed the S&P 500 with a still strong performance of 27.6% (net of fees) behind the S&P 500 return of 32.4%.
This past week Covestor launched my fourth model, another algorithmic model, called the Large Cap Momentum Model. I sometimes have a hard time explaining and can imagine the questions regarding my Sustained Momentum Model. That is, what exactly is in the 50 stock portfolio I am monitoring, and how do I include or exclude stocks.
For this model I chose to start with the 100 stocks in the S&P 100 index itself. These are large cap stocks that are well known businesses and stocks. Placing them in a 'fantasy portfolio' I then started weighting them towards the strongest stocks in terms of price performance. Of these 100 stocks I created a real portfolio of the top 10-12 constitutents and this became the basis for the Large Cap Momentum Model.
Weighted Index Funds are big business. As this Wall Street Journal article points out, there are currently approximately $40 billion in exchange-traded-funds tracking alternative indexes. My own model is hardly an index fund holding only a fraction of the underlying S&P 100 stocks. But hopefully, it can over time outperform the underlying index.
I am well aware how difficult it is for a Mutual Fund to even beat the underlying market index. As this article points out:
"In 2012, 66.08 percent of all domestic equity mutual funds underperformed when matched against the S&P 1500. In 2011 a swollen 84.07 percent were laggards, while in 2010 “only” 57.63 did worse than the averages."
With the Large Cap Momentum Model, I am trying to keep up with and eventually exceed the underlying index using components of the same index. Wish me good luck!
Like Indiana Jones and the Last Crusade, I, like Harrison Ford in this movie, am in pursuit of the Holy Grail. That is to find the formula, the strategy, the approach that beats the underlying market. Larry Swedroe published a whole book on the futile nature of this pursuit. Count me in as a doubter. Meanwhile stay tuned.
Thanks so much for stopping by and visiting. If you have any comments or questions, please feel free to leave them right here on the website.
Yours in investing,
Bob
Saturday, 4 January 2014
Worthington Industries (WOR)
Hello Friends! Thanks so much for stopping by and visiting my blog, Stock Picks Bob's Advice! As always, please remember that I am an amateur investor, so please remember to consult with your professional investment advisers prior to making any investment decisions based on information on this website.
 Reading news about the economic recovery in the United States, I came across Worthington Industries (WOR) and their recent good financial results. The stock has been trading quite well the past few days and I have given some thought to purchasing some shares. I do not own any shares of Worthington (WOR) at the time of writing but may well buy some shares if the opportunity presents. But first let me share with you more about Worthington and see if you will share my own enthusiasm.
As I noted above, what drove the Worthington stock higher the last couple of weeks has been the 2nd quarter 2014 earnings report which at first glance showed a dip in second quarter earnings, however deducting one-time items, as this Zacks report demonstrates, results in a earnings result of $.57/share, a bit ahead of the $.56 expected by Zacks. Revenues for the quarter ended November 30, 2013, rose 24% over the prior year to $769.9 million well ahead of the Zacks estimate of $685 million. Gross margins also increased to 16.7% from 15.2% the prior year---altogether a very nice report.
Worthington closed at $42.71 on January 3, 2014, up $1.09 or 2.62% on the day.
By the way, let's take a look at what the company does! According to the Yahoo "Profile" on Worthington, the company
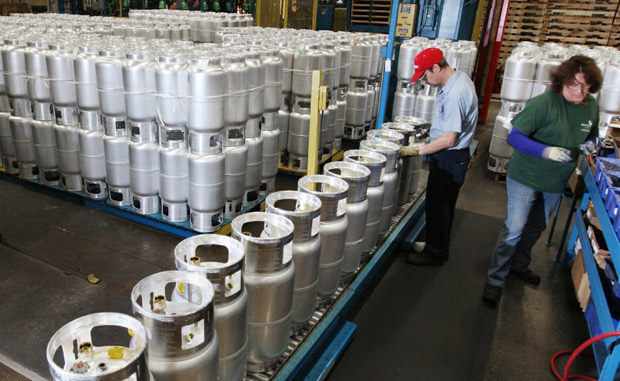 "...focuses on value-added steel processing and manufactured metal products in the United States, Canada, Europe, and internationally. It operates through three segments: Steel Processing, Pressure Cylinders, and Engineered Cabs."
As this earnings review from the Investors Business Daily points out, Worthington is benefiting from its cooperative ventures in China with Nisshin Steel and Maruben-Itochu Steel to "make strip steel for the country's growing automotive industry." The Chinese auto industry, while slowing recently after red-hot growth, remains a strong growth industry and Worthington is set to benefit from this relationship.
Reviewing the Morningstar.com '5 Years Financials' for a longer term look at this company, we can see that the recent growth in revenue has been a change from a relatively flat revenue curve for this cyclical company. Revenue came in at $2.63 billion in 2009, dipped to $1.9 billion in 2010, and since then has rebounded back to the $2.64 billlion reported in the trailing twelve months (TTM). Diluted earnings per share have improved from a loss of $(1.37) in 2009, to $.57/share in 2010 and up to $2.18/share in the TTM. Outstanding shares have been reduced from 79 million in 2009 to 72 million in the TTM.
Morningstar reports $867 million in total current assets as of May, 2013, compared to total current liabilities of $449 million for a healthy current ratio of 1.93. Free Cash Flow dipped from $190 million in 2009 to a low of $50 million in 2011 and since then has strongly increased to $228 million in fiscal 2013 to $255 million in the TTM.
Looking at some valuation numbers on this stock, according to the Yahoo "Key Statistics" on Worthington, this is a mid-cap stock with a market capitalization of $2.95 billion. The trailing P/E is reported at 20.84 with a forward P/E (fye May 31, 2015) estimated at 14.93. With steady growth in earnings predicted to continue, the PEG works out to a reasonable 1.42. There are 69.14 million shares outstanding with only 38.42 million that float. As of December 13, 2013, Yahoo reports that there were 1.12 million shares out short resulting in a moderately significant short interest ratio of 3.4 days. (My own arbitrary 3 day rule for significance!)
The company pays a forward annual dividend of $.60 for a yield of 1.4%. They have room to raise their dividend with a payout ratio of only 26.0%. In fact as Worthington's fortunes have improved the last couple of years, they have indeed been increasing their cash payout.
In terms of price performance, if we examine the 'point & figure' chart on Worthington from StockCharts.com, we can see that the stock has appreciated nicely from early 2009 until mid-2011 when it corrected from $23 to about $12.50. The stock since then has broken through resistance levels and has moved strongly higher to its current level of $42.71. (January 3, 2014)
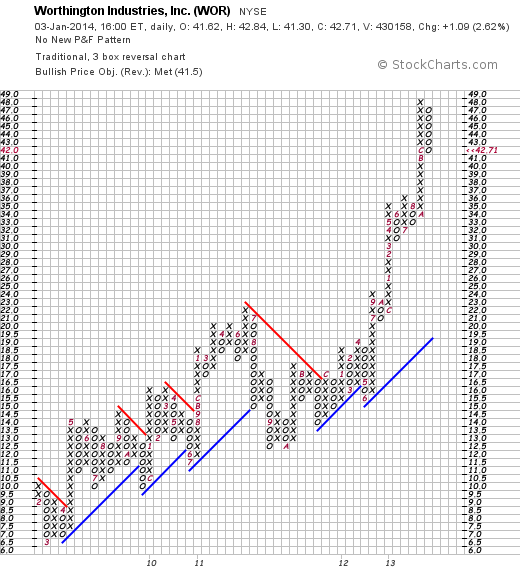
In summary, Worthington is a cyclical steel manufacturer that has been benefiting from the economic recovery and has improved its future possibilities with recent investments in the Chinese steel market. They just reported a solid earnings report that exceeded expectations, they have been raising their modest dividend and valuation-wise they do not appear overpriced to me. Looking at their chart, we can see the impressive strength of the stock price. From my perspective this would be a great addition to my own portfolio.
Thanks again for stopping by and visiting my blog! If you have any comments or questions, please feel free to leave them here!
Wishing all of you a very healthy and prosperous 2014!
Yours in investing,
Bob
Sunday, 22 December 2013
Cintas (CTAS) "Revisiting a Stock Pick"
Hello Friends! Thanks so much for stopping by and visiting my blog, Stock Picks Bob's Advice! As always, please remember that I am an amateur investor, so please remember to consult with your professional investment advisers prior to making any investment decisions based on information on this website.
 It is often hard to believe that I have been blogging here on this website since May 12, 2003, over 10 years ago, when I wrote up my first entry St Jude Medical. For those of you who have become regular readers here, I thank you and hope that I have in some small way added to your own understanding of looking at stocks. I know that it has been a very useful experience for me giving me the experience of examining literally thousands of stocks right here and developing my own appreciation of 'good' and 'bad' investments. I do not claim to be more than an amateur seriously, but have learned quite a bit through this process.
In fact, I often come back to many of the same names over the years. These are the kind of stocks that I believe that Gene Walden, a favorite mentor of mine, might think worthy of inclusion in a 100 Best book of his. What these stocks represented were the companies that through wise management were able to offer America a product or service that could grow steadily over a long period of time and along with it, an appreciating stock price that would make holding shares worthwhile.
On July 15, 2005, I first wrote up Cintas (CTAS) when it was trading at $44.00/share. At that time I did not own any shares. On April 9, 2013, I purchased shares of Cintas (CTAS) at $44.49 in my Covestor Growth and Momentum Model which I manage on the Covestor Website. It is an interesting coincidence that I purchased shares years later when the stock was trading at virtually the same price. CTAS had a good day Friday, December 20, 2013, closing at $59.30 on a strong earnings report.
According to the Yahoo "Profile" on Cintas, the company
"...provides corporate identity uniforms and related business services for approximately 1 million businesses primarily in North America, Latin America, Europe, and Asia. The company operates in four segments: Rental Uniforms and Ancillary Products; Uniform Direct Sales; First Aid, Safety and Fire Protection Services; and Document Management Services."
Looking closer at that second quarter 2013 earnings report that I mentioned above, CTAS reported on December 20, 2013, that earnings came in at $.70/share, above the Zacks Estimate at 11.1% improvement over last year's $.63/share result. Revenue grew 7.9% from last year to $1.14 billion, also ahead of Zacks estimates. The company also raised guidance for the lower end of the range on both revenue for 2014 and earnings.
Reviewing longer-term results, the Morningstar 5 Years Financials shows that Cintas has grown its revenue from $3.78 billion in 2009 to $4.31 billion in 2013 and $4.39 billion in the trailing twelve months (TTM). Diluted earnings per share actually dipped from 2009 at $1.48/share to $1.40/share in 2010. However, since then earnings have steadily grown to $2.52 in 2013 and $2.56 in the TTM. Outstanding shares have declined as the company repurchased shares with 153 million shares in 2009 declining to 124 million shares in the TTM.
Morningstar reports the company's balance sheet as of May, 2013, showing $1.63 billion in current assets and $556 million in total current liabilities yielding a current ratio of 2.93. Free cash flow per Morningstar has been positive and steady with $363 million in free cash flow as of 2009 and $354 million in free cash flow in the TTM.
Examining some valuation numbes on Cintas as reported on the Yahoo "Key Statistics", we find that Cintas Corporation (CTAS) is a mid cap stock with a market capitalization of $7.11 billion. The trailing P/E is a moderat 22.71. Forward P/E is better (fye May 31, 2015 estimated) at 19.38. But the PEG ratio still remains somewhat rich at 2.01. Yahoo reports 119.82 million shares outstanding with 99.82 million that float. As of November 9, 2013, there were 6.89 million shares out short. Considering the average daily volume of 557,398 (past 3 months), this works out to a short interest ratio of 18.60. This is well above my own arbitrary '3 day rule' for significance. Thus, this past Friday when the company reported solid earnings (as discussed above), the stock climbed sharply. One can only wonder whether a bit of a 'short squeeze' was in action.
Cintas pays a forward dividend of $.77 with an estimated yield going forward of 1.30%. The company has a payout ratio of 29% suggesting some room for dividend boosts going forward. Cintas last split its stock in the form of a 3:2 stock split on March 8, 2000.
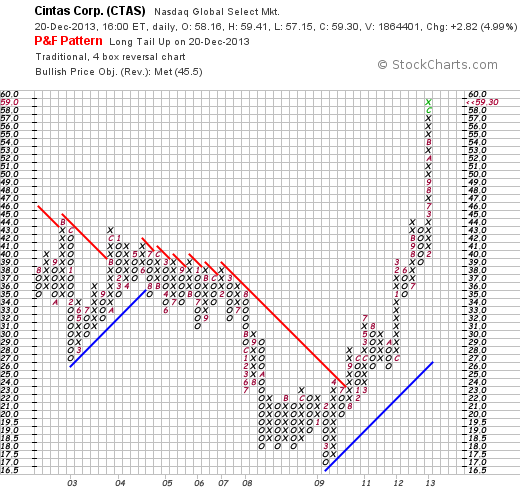
Over the years I have learned that one of the safest stocks to purchase was one in which the chart showed strength, which for me is a chart showing stock price appreciation. Looking at the Point & Figure Chart from StockCharts.com on Cintas, we can see that the stock price dipped after my initial write-up in 2005. In fact looking back at my own comments I wrote:
" I see what looks like a long-term declining trend in stock price from $56, all the way back in May, 2002, to the $44 level where it closed today. What concerns me is what appears to be a series of declining highs, but the recent move breaking through a resistance level is moderately encouraging. Certainly the stock chart is not ahead of itself, and I wouldn't call this one over-extended. Yet the question remains whether this shows any significant upward momentum at all!"
It certainly wasn't a good price entry back in 2008 and the chart looked awful! The chart looks much stronger today! Since dipping to as low of $17 in March, 2009, this stock has been on a tear climbing to its current levle of $59.30.
To summarize, Cintas is now a holding in one of my Covestor models, and has been showing price appreciation since purchase six months ago. The company has been steadily growing its uniform and business support enterprise with steady increases in revenue and earnings while gradually decreasing its outstanding shares. The company has a strong balance sheet and continues to generate solid free cash flow. In addition, the company pays a modest dividend.
The company is a bit richly priced based on P/E and PEG values so it may have gotten a little ahead of itself in terms of a new purchase. The chart is quite strong and there are lots of shares out short betting against the stock meaning they will need to be covered if the stock remains strong.
Thank you again for stopping by and a special thank you to the loyal visitors who have stopped by here year after year! Wishing you all the best of health and good fortune in 2014.
Yours in investing,
Bob
Saturday, 14 December 2013
Alexion Pharmaceuticals (ALXN)
Hello Friends! Thanks so much for stopping by and visiting my blog, Stock Picks Bob's Advice! As always, please remember that I am an amateur investor, so please remember to consult with your professional investment advisers prior to making any investment decisions based on information on this website.
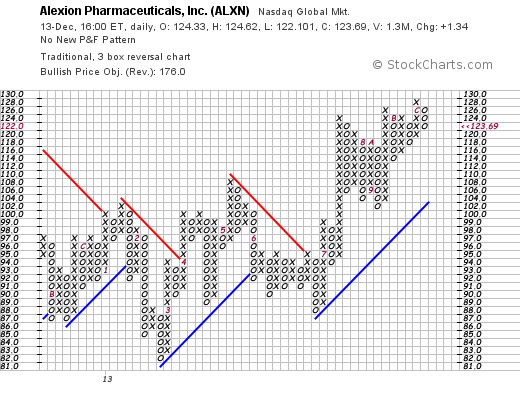
 On December 9, 2013, I purchased shares of Alexion Pharmaceuticals (ALXN) for my Covestor Healthcare Model at a cost of $126.24. ALXN closed Friday, 12/13/14 at $123.69, up $1.34 or 1.10% on the day yet is still trading at a couple of dollars below my own purchase price. Let's take a closer look at this stock and see if it remains a promising investment for my portfolio.
According to the Yahoo.com "Profile" on Alexion, the company is
"...a biopharmaceutical company, engages in the development and commercialization of life-transforming therapeutic products. The company offers Soliris (eculizumab), a therapeutic product for the treatment of patients with paroxysmal nocturnal hemoglobinuria (PNH), a blood disorder; and atypical hemolytic uremic syndrome (aHUS), a genetic disease. It also conducts Phase IV clinical trails on Soliris for its usage for the treatment of PNH  registry, and aHUS for pediatric and adult; and various Phase II clinical trails for its usage for the treatment of PNH pediatric trial, cold agglutinin disease, MPGN II/C3 nephropathy, hemolytic uremic syndrome, presensitized renal transplant, delayed kidney transplant graft function, ABO incompatible renal transplant, neuromyelitis optica, and myasthenia gravis. In addition, the company develops Asfotase alfa that is under Phase II clinical trail for the treatment of metabolic disorders, including hypophosphatasia; ALXN 1102/1103, which is in Phase I trial for PNH; and ALXN 1007, a novel humanized antibody for treating inflammatory disorders. Further, the company conducts preclinical trails on cPMP for treating metabolic disorders."
As you can see, there is little "Peter Lynch" about an investment in Alexion (ALXN) or other similar biotech companies. Investors are dependent on other analysts who may well be able to measure the potential of drugs like eculizumab unlike a company like Coca-Cola (KO) in which an investor could at least try a little over ice!
It is true that Alexion (ALXN) just entered into a voluntary recall of a couple of lots of its Soliris medication. However, this appears to be a short-term blip in this drug's sales. Recently, additional clinical evidence for the utility of Soliris for patients with atypical hemolytic uremic syndrome (aHUS) was presented at the American Society of Hematology. Alexion plays a key role in this rare but life-threatening disorder.
In terms of the latest quarterly results, Alexion (ALXN) reported third quarter 2013 results on October 24, 2013. Sales for the quarter increased 36% to $400.4 million compared to sales of $294.1 million the prior year. GAAP net income increased to $93.8 million or $.47/share compared to $92.2 million or $.46/share the prior year. These results exceeded expectations on both earnings and revenue as had been forecast by Zacks.
In terms of a longer-term view, we can see from the Morningstar.com 'financials' on Alexion that the company has rapidly grown revenue from $259 million in 2008 to $1.13 billion in 2012 and $1.43 billion in the trailing twelve months (TTM). Diluted earnings which spike from $.20/share in 2008 to $1.63/share in 2009, dipped back to $.52/share in 2010. However, since 2010, they have steadily climbed reaching $1.28/share in 2012 and $1.77/share in the TTM. During this time, Alexion has grown its shares outstanding modestly from 180 million shars in 2008 to 199 million in 2012 and in the TTM.
According to the Morningstar Balance Sheet numbers on Alexion, the company appears extremely solvent with current assets of $1.50 billlion compared to only $360 million in current liabilities, yielding a current ratio of 4.16.
Looking at the free cash flow history on Morningstar, we can see that the company has been generating a growing amount of free cash with $5 million reported in 2008, $389 million in 2012 and $365 million in the TTM.
In terms of valuation, Alexion (ALXN) is a large cap stock with a market capitalization of $24.25 billion according to the Yahoo "Key Statistics" on this stock. The trailing P/E is a very rich 69.96 (compared to the S&P 500 which currently trades with a P/E of 19.9!) However it is always important for an investor to consider what the future holds for a stock not just where it is now. In other words, if we take into consideration anticipated growth of earnings, the PEG ratio is much more down to earth with a level of 1.60 (5-yr expected).
Yahoo reports that the company has 196.3 million shares outstanding with only 1.07% held by insiders. As of October 31, 2013, there were 3.3 million shares out short and with average volume of 1.1 million shares traded, this yields a short interest ratio of 3.00--right at my own arbitrary cut-off for significance. No dividends are paid and the last stock split was on May 23, 2011, when the company declared a 100% stock dividend effecting a 2:1 stock split.
Examining the 'point & figure' chart from StockCharts.com on Alexion, we can see that the stock has demonstrated fairly significant price volatility in 2013 but has climbed from a low of $82 to a high of $128 earlier this month closing 12/13/13 at $123.69. Overall the chart looks strong and heading higher from my own amateur perspective!
In conclusion, I recently purchased Alexion Pharmaceuticals (ALXN) for my Covestor Healthcare Model that I manage and personally own the portfolio upon which it is based. Alexion has been growing rapidly selling orphan drugs for deadly diseases and has recently demonstrated additional evidence that its treatment is effective. Soliris has the dubious distinction of being one of the world's most expensive medications costing a patient about $400,000/year for treatment. The company has fundamental strength, technical price strength and hopefully will become a strong holding within my own portfolio.
Thank you again for visiting my blog. If you have any comments or questions, please feel free to leave them right here on the website.
Yours in investing,
Bob
Sunday, 8 September 2013
Prestige Brands (PBH)
Hello Friends! Thanks so much for stopping by and visiting my blog Stock Picks Bob's Advice! As always, please remember that I am an amateur investor, so please remember to consult with your professional investment advisers prior to making any investment decisions based on this website.
 I don't spend a lot of time talking about how I got interested in investing years ago, but I give credit mostly to my father, the late Lt. Col. Sumner Freedland, who taught me to look at labels, read stock prices, and buy equities. I purchased my first shares 46 years ago this month and have followed the market since.
In his own Peter Lynch style, my father like to invest in things he understood. I remember that his favorite investments were AT&T (T) (way prior to the spin off of all of the 'baby bells'), and Merck (MRK). He used to enjoy showing me all of his stock certificates and the many splits he had received over the years. He convinced me!
Like my father, I occasionally get on what might be called 'health kicks'. I have been convinced of the helpfulness of Vitamin D in the diet and take a supplement, I take some Omega 3's (being aware of recent controversy about Omega 3's and Prostate Cancer), and I use a fiber supplement for those benefits.
I will attest to greater compliance attributable to gummies even as an adult. I am not put off by another pill or two to swallow when given the alternative of a good tasting gummy instead! There are some anecdotal suggestions that compliance in vitamin regimens will be improved as the vitamins are available in a pleasant tasting form.
 Two of the brand names that I consume include vitafusion for multiple vitamins and Fiber Choice for a fiber supplement. It turns out that vitafusion is produced by Northwest Natural Products which is now owned and produced by another one of my favorite companies, Church & Dwight (CHD). However, Fiber Choice is now owned by Prestige Brands (PBH). In some ways this is a 'revisit' of a stock pick because the original owner of Fiber Choice was a company CNS (CNXS) that I reviewed back in April, 2005.
On October 16, 2005, GlaxoSmithKline (GSK) announced its purchase of CNS, Inc. for $566 million. In December, 2011, GlaxoSmithKline sold 17 over-the-counter medicines to Presige Brands Holdings (PBH) where Fiber Choice ended up today. Thus the circuitous route of this supplement to my medicine cabinet!
I do not currently own any shares of Prestige Brands (PBH) although I briefly held some shares this past month but sold them as the market weakened. Prestige Brands closed at $31.81 on September 6, 2013.
According to the Yahoo "Profile" on PBH, the company
"....through its subsidiaries, engages in the marketing, sale, and distribution of over-the-counter healthcare and household cleaning products in North America and internationally. It operates through two segments, Over-The-Counter Healthcare and Household Cleaning. The Over-The-Counter Healthcare segment offers a portfolio of OTC products under 14 primary OTC brands, including Chloraseptic sore throat remedies, Clear Eyes eye drops, Compound W wart removers, Little Remedies pediatric healthcare products, The Doctor’s brand of oral care products, Efferdent and Effergrip denture products, Luden's cough drops, PediaCare pediatric healthcare products, Dramamine motion sickness products, BC and Goody's Analgesic powders, Beano gas prevention, Gaviscon antacids, and Debrox ear drops. The Household Cleaning segment markets household cleaning products, such as Chore Boy scrubbing pads and sponges; Comet abrasive powders, creams, liquids, and non-abrasive sprays; and Spic and Span dilutables, sprays for counter tops, glass cleaners."
On August 1, 2013, Prestige Brands Holdings (PBH) announced 1st quarter 2014 results. Adjusted revenue for the quarter actually dipped 1.9% to $143.0 million from last year's $145.8 million. Net income, however, came in at $20.7 million or $.40/diluted share, up 41.2% from the prior year's result of $14.7 million or $.29/diluted share. Analysts had been expecting $.38/share which the company beat, but they had also expected revenue of $147.1 million below expectations. Altogether, a bit of a mixed quarter.
Reviewing the Morningstar.com financials on Prestige Brands Holding (PBH), we can see that revenue has grown from $313 million in 2009, dipping to $302 million in 2010, then steadily climbing to $624 million in 2013 before the dip to $620 million in the latest twelve months (TTM).
Diluted earnings per share have improved from a loss of $(3.74) in 2009 to $1.27 in 2013 and $1.38 in the TTM. During this period outstanding shares have been fairly constant at 50 million in 2009 increasing to 51 million in 2013 and 52 million in the TTM.
Free cash flow has improved from $66 million in 2009, dipping to $59 million in 2010, and increasing to $127 million in 2013 and $135 million in the TTM.
In terms of a simplified view of the balance sheet, Morningstar reports PBH with $164 million in current assets as of March, 2013, and $97 million in total current liabilities. This results in a healthy current ratio of 1.69.
Looking at the Yahoo "Key Statistics" on Prestige Brands to get a feel for some valuation numbers, we can see that the stock is a small cap stock with a market cap of $1.63 billion. The trailing P/E is moderate at 23.05 with a forward P/E (fye Mar 31, 2015) a little better at 17.29. Still the growth rate is expected to fail to reduce the PEG into what I would consider a reasonable range (under 1.5) with a current PEG reported at 1.95.
Prestige Brands has 51.17 million shares outstanding with 50.81 million that float. Currently there is a modest number of shares out short reported to be 442,730 shares as of August 15, 2013. This results in a similarly modest short interest ratio of 1.60. (Generally I use 3.0 days to cover as suggestive of significance---my own arbitrary cut-off.) The company does not pay a dividend and no stock splits are reported on Yahoo.
Examining the 'point & figure' chart on PBH from StockCharts.com, we can see what appears to be a very strong technical chart with a sharp ascent in stock price from early 2009 when it was trading at around $4.25 to its current level of $31.81. Currently the stock is consolidating but appears (if I may be free to speculate here) that the stock is poised to move higher.

In summary, this stock market idea took a circuitous route from my bathroom medicine cabinet to this blog! Prestige Brands, a little like Church & Dwight (CHD), is putting together a large group of familiar household brands and is doing so without an excessive increase in outstanding shares or excessive debt. In addition, as this Motley Fool article points out, they are generating plenty of free cash flow that can be used for enhancement of shareholder value or perhaps a dividend (?) down the road.
The stock appears to be fairly fully priced but does have a very strong chart as well making it attractive from my perspective. I do not own any shares, but this one certainly is on my horizon and I hope to revisit this as a shareholder in the future.
Thank you again for stopping by and visiting my blog! If you have any comments or questions, please feel free to leave them here and I shall try to respond the best I can.
Yours in investing,
Bob
Newer | Latest | Older


