Stock Picks Bob's Advice
Saturday, 14 August 2004
"Looking Back One Year" A review of stock picks from the week of July 28, 2003 (Including July 26, 2003)

Hello Friends! Sorry about missing the "review" last weekend. I was away from my computer and thought it best to take a week off! It didn't really help the market lol but a guy just has to take a break once in awhile! Thanks again for stopping by! If you are new here, and even if you are a return visitor, please remember that I am an amateur investor, so please consult with your professional investment advisors prior to making any investment decisions based on information on this website,
Stock Picks Bob's Advice.

On July 26, 2003, I
posted Zoran (ZRAN) on Stock Picks at $27.28. ZRAN closed at $15.57 on 8/13/04, for a loss of $(11.71) or (42.9)%. (Not a very auspicious start for THAT week!)
On July 27, 2004, ZRAN
announced 2nd quarter 2004 results. Revenues for the quarter came in at $103.7 million, an increase of 132% over the same quarter in 2003. However, under GAAP, the Company reported a net loss of $(6.1) million or $(.14)/share compared with net income of $4.2 million or $.15/share the prior year. This actually is improved from the prior quarter, but as you know if you are a reader of this blog, I am looking for stocks that are PROFITABLE along with growing revenue!

I
posted Quality Systems (QSII) on Stock Picks on 7/28/03 at a price of $30.67. (I also purchased some shares in my
"Trading Account" as well as had my stock club pick up some shares!) QSII closed at $47.92 on 8/13/04 for a gain of $17.25 or 56.2%.
On August 3, 2004,
QSII reported 1st quarter 2005 results. Net revenues were $20.1 million, an increase of 23% over the $16.3 million in revenue last year. Net income was $3.4 million, a 49% over net income of $2.3 million last year in the same quarter. Fully diluted earnings per share came in at $.51/share for the quarter, an increase of 46% over the fully diluted $.35/share earnings recorded last year. These were great results and the stock price reflects this!

Community Health Systems (CYH) was
posted on Stock Picks on 7/29/03 at a price of $19.79. CYH closed at $23.70 on 8/13/04 for a gain of $3.91 or 20.0%.
On July 21, 2004, CYH
announced 2nd quarter 2004 results. Net operating revenues for the quarter ended June 30, 2004, were $813.7 million, a 23.8% increase over the $657.3 million reported in the same quarter last year. Net income jumped 25.6% to $38.4 million or $.37/diluted share, compared to $30.6 million or $.30/diluted share last year. These look like great results to me!
 Coventry Health (CVH) was posted
 on Stock Picks on 7/29/03 at a price of $55.77. CVH split 3:2 in February, 2004, so our effective stock pick price was actually $37.18. CVH closed at $48.87 on 8/13/04 for a gain of $11.69 or 31.4%.
On July 26, 2004, CVH
announced 2nd quarter 2004 results. Operating revenues totaled $1.31 billion for the quarter, up 19% over the 2nd quarter 2003. Earnings came in at $84 million or $.93/share (beating Thomson First Call estimates of $.87), compared to last year's $63.4 million or $.70/share on revenue of $1.1 billion.

On July 30, 2003, I
posted Guitar Center (GTRC) on Stock Picks at $33.26. GTRC closed at $40.75 on 8/13/04 for a gain of $7.49 or 22.5%.
On July 28, 2004, GTRC
announced 2nd quarter 2004 results. Consolidated net sales for the quarter ended June 30, 2004, increased 16.5% to $339.6 million from $291.6 million for the same period last year. Net income for the quarter increased 97.5% to $12.1 million or $.47/diluted share compared with $6.2 million or $.25/diluted share last year. These were indeed great results!

On July 30, 2003, I
posted Charles River Laboratories (CRL) on Stock Picks at $35.60. CRL closed at $41.76 on 8/13/04 for a gain of $6.16 or 17.3%.
On July 28, 2004, CRL
announced 2nd quarter 2004 results. Second quarter net sales were $180.2 million, a 16.7% increase over the $154.4 million reported in the same period last year. Net income for the quarter increased 27.9% to $26.3 million or $.52/diluted share up from $20.6 million or $.42/diluted share last year. Another great quarter for CRL!

On July 31, 2003, I
posted ManTech (MANT) at $24.86. MANT closed at $12.33 on 8/13/04, for a loss of $(12.53) or (50.4)%.
On July 19, 2004, MANT
announced it expected a loss for the 2nd quarter. Subsequently, it also delayed the earnings report. The street does NOT like losses and does NOT like uncertainty. The stock has traded lower!

On July 31, 2003, I
posted Chico's FAS (CHS) on Stock Picks at $27.22. CHS closed at $39.20 on 8/13/04 for a gain of $11.98 or 44%.
On May 27, 2004, CHS
announced 1st quarter 2004 results. Net sales for the quarter ended May 1, 2004, increased 52.0% to $257 million from $169 million for the same quarter last year. Net income was up 52.6% to $36 million, or $.40/share from $23 million or $.27/share last year. Comparable store sales were reported to increase 20.1% for the 13 week period ended May 1, 2004 (in the same earnings report). These were all great numbers, and the stock has appreciated since we listed it last year!

On August 1, 2003, I
posted Alliance Data Systems (ADS) on Stock Picks at $28.45. ADS closed at $36.12 for a gain of $7.67 or 27.0%.
On July 21, 2004, ADS
announced 2nd quarter 2004 results. For the quarter ended June 30, 2004, revenue increased 20% to $300.5 million from $251.0 million for the second quarter 2003. Net income was up 99% to $28 million or $.33/diluted share for the second quarter compared to $14.1 million or $.18/diluted share the prior year. In addition ADS RAISED GUIDANCE (notice the caps!) for 2004. This is a great earnings report and great guidance for this company! My kind of stock. (unfortunately I don't own any!)

Finally, on August 1, 2003, I
posted United Online (UNTD) on Stock Picks at $33.64. UNTD has been one of our WORST performers (!) and closed on 8/13/04 at $9.03/share for a loss of $(24.61) or (73.2)%.
On August 4, 2004, UNTD
reported 2nd quarter 2004 results. Total revenues were $110.6 million, up 39% vs. $79.6 million for the same quarter the prior year. Net income came in at $12.3 million or $.19/share compared to $14.6 million or $.21/share the prior year. However, the stock dropped after they also
trimmed guidance for subscriber-growth for 2004. I always prefer (!) to see POSITIVE guidance in association with great results!
So how did we do for these ten stock selections? We had gains in seven and losses in three for an average gain of 5.19%. O.K. not so spectacular but not bad for a mediocre market this past year! Remember, I suggest selling all losing stocks at 8% loss levels, so this would actually improve our performance, but for the sake of review, I evaluate as if we had a "buy and hold" strategy!
Thanks again for stopping by! If you have any questions, comments, or words of encouragement, please feel free to email me at bobsadviceforstocks@lycos.com . Wishing all of my friends a GREAT WEEKEND!
Bob
Thursday, 12 August 2004
A Reader Writes "What about IDEV"
Hello Friends! Thanks again for stopping by. I received a note from a rather sophisticated reader asking me about my opinion on IDEV. First of all, I am an amateur investor, so please consult with your investment advisors before making any decisions based on information on this website. But let me get to the letter:
Bob D. writes:
Hi Bob:
I just recently came across your site and I like it. I most likely will subscribe.
I guess I'd like a little personal attention beforehand. I'd like to know if you would buy IDEV on 8/12 at the open (or soon after) with just taking into consideration the following factors (to be brief) from my perspective and then your own analysis:
1.) IDEV recvd. FDA approval for Sanctura (a best-in-class drug for a $1.3B market) about a month ago and the stock has pulled back sharply (profit-takers after the run-up before the anticipated approval?). Stock is currently ~$6. Stock traded as high as $10 on the day of approval.
2.) Sanctura officially launches next week. 500 new sales reps, etc.
3.) IDEV revcd. a total of $300M cash infusion from Pliza (a Eurpoean pharma.) in a joint-venture co-op fund for the launch of Sanctura.co-op.
4.) Downtrend seems to be reversing (last 2 days) and I believe the target price is $15. by factoring in a capture of 25% marketshare by the end of 2005. They say the drug is that good against its competition.
5.) Cash position is about $4.50 a share (w/cash infusion).
6.) Dry powder is there doing nothing and this stock seems compelling. The sizzle is there.
Would you please let my know what you think tomorrow morning?
Sincerely & TIA,
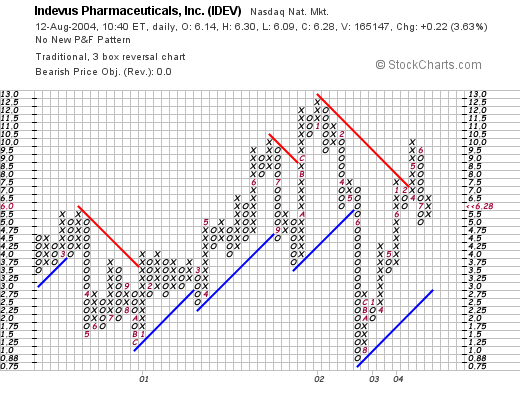
Bob DLet's take a look at IDEV.
 align="center">
Well technically, the graph looks nice having broken through its recent resistance level. What about the earnings?
(I do not own any shares of this stock by the way). IDEV currently trading up $.17 or 2.81% on the day at $6.23 in an otherwise weak market. Earnings are to be released on 8/16/04. On May 11, 2004, IDEV announced 2nd quarter 2004 results. They reported a net LOSS of $(11,370,000) or $(.24)/share for the quarter ended March 31, 2004, compared to a net loss of $2.9 million or $(.06)/share the prior year. Not only are they LOSING money, but they are LOSING MORE MONEY than last year. This isn't material for this website. I don't pick stocks that are losing money.
Furthermore, if we look at the "5-Yr Restated" financials on Morningstar.com, we can see that revenue peaked at $27.8 million in 2000, and has dropped to $5.4 million in the trailing twelve months. Again an "F" in my department. I am looking for growing revenues.
Free cash flow has grown increasingly negative from $(2) million in 2001 to $(32) million in the trailing twelve months.
Cash looks o.k. to cover their increasing liabilities for the time being.
What do I think? I think this website is increasing its readership. However, my investing techniques are based on investing discipline, staying with a strategy, using rational methods to assess a stock, and not going with hype or possible future markets. These may be profitable investment techniques for some, but I am looking for a specific type of company with progressive earnings and revenue growth, free cash flow, balance sheet, valuation, technicals and not just a bunch of potential products with a "great story".
Bob, I hope I have not disappointed you in your suggestion, and good-luck to you if you choose to pursue this one....it may turn out to be a "ten-bagger", it is just not my style! Thanks so much for stopping by. If you have any questions, comments, or words of encouragement, please feel free to email me at bobsadviceforstocks@lycos.com
Bob
Tuesday, 10 August 2004
A Reader Writes "What happened to DHB?"
Hello Friends! Well, we got a little reprieve from the market today. Thanks so much for stopping by! As always, please remember that I am an amateur investor sorting out investments so please consult with your professional investment advisors before making any investment decisions based on information on this website! If you have any questions or comments, please feel free to email me at bobsadviceforstocks@lycos.com and I will try to get back to you as soon as possible.
Speaking of email, I had a note this weekend from one of my readers here, who pointed out that almost as soon as I had posted DHB Industries, the stock was down 18%.
Vishwa wrote:
Hello Bob,
Keep up your good advice!
I have a question on DHB industries. Despite amazing 2nd quarter earnings yesterday (Aug. 5) why did the shares of this company fall 18% today (Aug 6)?
I don;t quite understand what's going on! Could you throw some light on what to expect from this company's shares in the near future and in the next 1 year?
Thanks,
Vish'On August 2, just 8 days ago, I
posted DHB Industries (DHB) on Stock Picks at $17.05. The stock was up 12% that day and made the list of top gainers. As Vish points out, DHB dropped 18% on 8/6/04. Today, DHB closed at $14.13, up $.18 or 1.29% on the day. However, it is still trading DOWN $(2.92) or (17.1)% from my post in just a week.
Vish points out that on August 6, DHB
reported earnings for the 2nd quarter 2004. Earnings came in at $7.7 million or $.17/share vs. $4.1 million or $.09/share the prior year. Sales were up 52% to $86.1 million from $56.5 million. I also don't see any other news to explain the drop in the stock price.
I already dropped Vish a note saying that the market was weak and it was sloppy. What does all of that mean? Well, as William O'Neill, the brilliant stock-picker and founder of Investors Business Daily likes to point out it is the M in CANSLIM that affects so many stocks in so many ways. In other words, the overall bearish tone of the market this past weak has dragged down DHB. I mention "sloppy" in terms of trading action, which in my opinion means that the market is ignoring fundamental factors in its action, that is, punishing the good with the bad! There really WASN'T any good reason that I am aware of to explain the price action on this stock!
So how does an investor AVOID such punishing price moves? First of all, I personally sell stocks that hit an 8% or greater loss as soon as they pass that threshold. I don't care HOW MUCH I like the stock, out it goes. If I had puchased shares in DHB and it dropped the next day, out the shares would go. I would take my loss, "lick my wounds" and not look back.
What else can an investor do? I use internally generated signals from my OWN portfolio to let me know whether I should even be making a purchase! That is, if you have been reading my blog, you will know that my latest trade was a sale of Sanderson Farms on weakness. Thus, I am sitting on my hands waiting for a sale of one of my stocks at a gain to "give me the green light" to add a new position. This avoids me going against the market, which is a foolhardy move...and results in again what I call "sloppy" trading, with lots of traders "throwing out the baby with the bath water!"
If we look at the latest Point and Figure Chart on DHB:
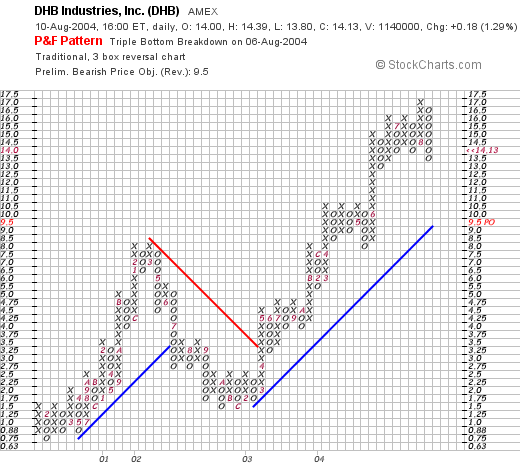
we can see that the stock has NOT actually broken down, in spite of its recent pull-back, the overall trend upwards appears uninterrupted at least at the current levels.
Vish also asked me about what to expect from DHB now and in the future. I am NOT a soothsayer or fortune teller....so your guess is as good as mine! However, I can tell you that the current PEG as reported on "Key Statistics" is only 0.80, suggesting that analysts who may know something about future prospects are predicting results such that the Price/earnings compared to the growth rate is under 1.0 suggesting that the growth rate is anticipated to be growing faster than the current p/e which is at 32. Thus earnings are expected to be greater than 32% over the next five years. As with all of my stock picks, I would hope that this would mean that the price would appreciate, and I am confident that a portfolio of such stocks will perform well, however, any particular stock can be higher or lower than when I "pick" it for my blog.
Thanks so much for stopping by! I hope my thoughts are helpful as you have asked very good questions and raised concerns regarding the whole process! Good luck investing and you are welcome to keep me posted regarding your own experiences in investing!
Bob
Posted by bobsadviceforstocks at 4:08 PM CDT
|
Post Comment |
Permalink
Updated: Tuesday, 10 August 2004 4:15 PM CDT
Friday, 6 August 2004
"Trading Transparency" SAFM
Hello Friends! Just wanted to update you on a recent transaction. I just sold 135 shares of SAFM at $44.92. These shares were purchased at $35.86 on 2/3/04. Thus they were sold with about a 25% gain. I sold these shares as my new sell point on this issue was at a 30% level...I had sold twice at gains and allowing the stock to retrace 50% gives me a new sell point at around 30%.
Thanks so much for stopping by. If you have any questions, or comments, please feel free to email me at bobsadviceforstocks@lycos.com
Bob
Tuesday, 3 August 2004
August 3, 2004 Mentor Corp (MNT)
Hello Friends! Thanks very much for stopping by. I have grown discouraged about the NASDAQ recently. Who wouldn't?
It appears that the NASDAQ rolled over sometime in late January, 2004, and since then we have had a series of lower highs and lower lows. I really would like to see this reversed on the next rally. As always, please remember that I am an amateur investor so please do your own investigation into all stock market ideas discussed here and please consult with your professional investment advisors prior to making any investment decisions.
 Mentor (MNT) was at the top of the list of top % gainers on the NYSE. MNT closed today at $34.45, up $3.10 or 9.89% on the day. I do not own any shares nor do I have any leveraged position in this stock. According to the Yahoo "Profile", Mentor "...manufacturers and markets products serving the medical specialties market." Some of their more notable products include breast implants, implantable prostheses, and impotence and incontinence devices.
 As I have pointed out many times on this blog, what often drives stocks higher over the short-term is announcements of good news or favorable earnings reports. Yesterday, after the close, Mentor announced 1st quarter 2005 results. Sales jumped 16% to $122.4 million compared to the prior year sales figure of $105.1 million. Diluted earnings per share for the quarter came in at $.39, up 18% from last year's $.33/share. At the same time, Mentor reaffirmed that it expected fiscal year 2005 sales to grow at a low double-digit growth rate with sales over sales of $422.2 million in the 2004 fiscal year. This was a nice announcement for Mentor, and the stock responded positively, even on a very weak day otherwise.
How about longer-term? If we review a "5-Yr Restated" financial statement from Morningstar.com, we can see that revenue has grown steadily from $249.3 million in 2000 to $422.2 million in 2004. Earnings have not been as consistent but have grown from $.73/share in 2000 to $1.15 in the trailing twelve months.
MNT even pays a small dividend and has increased it from $.05/share in 2000, to $.85/share in the trailing twelve months.
Free cash flow has been positive, increasing from $43 million in 2002 to $56 million in the trailing twelve months.
The balance sheet, as reported on Morningstar, appears solid to me. MNT has $118.4 million in cash and $209.6 million in other current assets as compared to liabilities of $129.9 million in short-term debt, and $170.5 million in long-term liabilities.
What about valuation? If we look at Yahoo "Key Statistics", we can see that this is a Mid-Cap stock with a market cap of $1.45 billion. The trailing p/e isn't bad at 28.38, with a forward (fye 31-Mar-06) p/e of 22.08. Thus, the PEG is reasonable at 1.53.
Yahoo reports 42.21 million shares outstanding with 40.50 million of them that float. There are 2.96 million shares out short as of 7/8/04, representing 13.436 trading days. This level of shorts might well explain the bit of a panic today of some buyers (?). As noted above, MNT does pay a small dividend of $.60/share yielding 1.91% return. The last stock split was a 2:1 on 1/21/03.
And what does the chart look like? Well, if we look at a nice Point and Figure Chart,
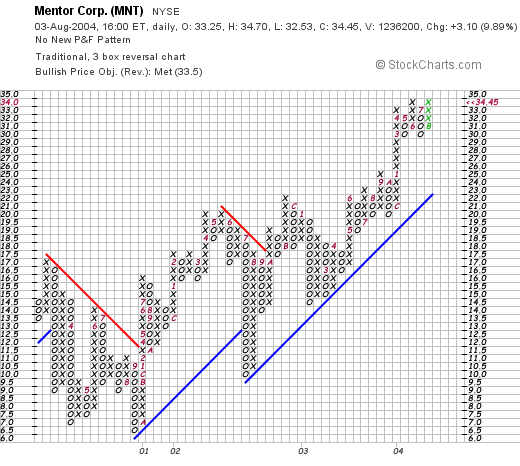
Per the chart, MNT last showed significant weakness through late 2000 when it dropped from $17.50 to a low of $6.50. Since that time, MNT has headed steadily higher.
Well, in conclusion, the stock actually looks nice to me. The recent earnings report was strong, the Morningstar 5-Yr record looks quite good, although earnings were NOT that consistent, they have been strong recently. The free cash flow is attractive and the technicals imho look fine. There is even a large level of short-sellers, poised to drive the stock even higher if the news on this company pushes the stock higher in the short-term.
Thanks so much for stopping by! If you have any comments, questions, or words of encouragement, pleae feel free to email me at bobsadviceforstocks@lycos.com.
Bob
Monday, 2 August 2004
August 2, 2004 DHB Industries (DHB)
Hello Friends! Thanks so much for stopping by. I am trying to do my posting of stocks in the evening. My days just get busier and busier! As always, please remember that I am an amateur investor and that all information on this website should be read with that in mind. Please consult with your professional investment advisors and do your own investigation on all stocks discussed here prior to making any investment decisions.

Looking through the lists of top percentage gainers, I came across DHB Industries (DHB) on the AMEX that closed today at $17.05, up $1.84 on the day or 12.10%. This is a security/armor company, and the recent announcements of Orange terror alert drove this stock higher. According to the
Yahoo "Profile", DHB "...is a holding company consisting of two divisions: DHB Armor Group (Armor Group) and DHB Sports Group (Sports Group)." I do not own any shares nor do I have any leveraged positions in this company.

On May 6, 2004, DHB
announced 1st quarter 2004 results. For the first quarter ended March 31, 2004, revenues came in at $74.4 million, a 61% increase over the prior year's $46.2 million. First quarter income available to common stockholders was $6.269 million, or $.14/diluted share, as compared to $4.929 million or $.12/diluted share in the first quarter of 2003. On a bullish note, the company raised its previous guidance on revenue and "...now expects revenues of at least $275 million for the full 2004 year."
As many of you will realize, at this point in the investigation of a stock, I like to look at a longer-term picture. For this I turn to the
"5-Yr Restated" financials on Morningstar.com. Here we can see a steady and impressive growth in revenue from $35.1 million in 1999 to $258.3 million in the trailing twelve months. Generally, earnings have gradually improved from $(1.24) in 1999 the $.36 in the trailing twelve months. Free cash flow which was $(3) million in 2001, $(16) million in 2002, improved to $2 million in 2003 and $6 million in the trailing twelve months.
The balance sheet on Morningstar.com shows only $500,000 in cash but $103 million in other current assets. This easily covers BOTH the $27.8 million in current liabilities and the $25.9 million in long-term liabilities. This looks very strong!
How about "valuation"? Looking at
"Key Statistics" on Yahoo, we can see that this is a small cap stock with only $695.84 million in market capitalization. The trailing p/e is a bit rich at 47.23, but the stock is growing so fast that the PEG is reasonable at 1.19. Yahoo reports 40.81 million shares outstanding with 24.20 million that float. There were 3.84 million shares out short, representing only 2.085 trading days of activity.
No cash dividend and no stock dividends are reported on Yahoo.
How about "technicals"? If we look at a Point & Figure chart from stockcharts.com:
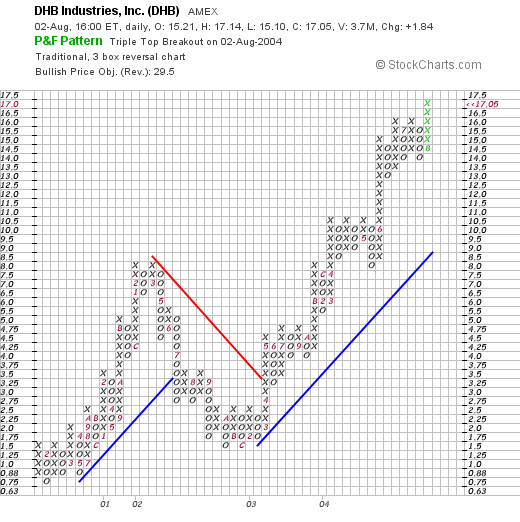
we can see that this stock rallied from $.75/share in 2000 to a level of $8.50 in March, 2002. It then pulled back to the $1.50 level in November, 2002, then charged ahead not looking back to its current level in the $18.00 region. The chart looks quite strong to me!
 So what do I think? This is the third Armor type company I have reviewed here including Ceradyne (CRDN), and Armor Holdings (AH). Certainly, this "terror problem" does not appear to be disappearing anytime soon. This company has a great track record of revenue and earnings growth. They are spinning off increasing free cash flow on top of an already healthy balance sheet. The p/e is a bit steep, but the growth rate anticipated over the next five years is such that the PEG is just a little over 1.0. Thus, the value isn't bad. Technically, the stock chart looks just fine to me as well. Overall, I like this stock, but simply cannot buy any shares in my portfolio until I have once again confirmed the market's strength with a sale of one of my existing holdings at a gain!
Thanks so much for stopping by! If you have any questions, comments, or words of encouragement, please feel free to email me at bobsadviceforstocks@lycos.com .
Bob
Posted by bobsadviceforstocks at 9:02 PM CDT
|
Post Comment |
Permalink
Updated: Monday, 2 August 2004 9:08 PM CDT
Friday, 30 July 2004
"Looking Back One Year" A review of stock picks from the week of July 21, 2003
Hello Friends! Well we made it to Friday. One political convention down and one to go. Why we even ended up the week with the indices in positive territory! I like to use the weekend to look back on this website about a year earlier and see what happened to those stock picks that were mentioned here. As always, please remember that I am an amateur investor, so please do your own investigation into all stocks discussed on this website and please consult with your professional investment advisors before taking any actions based on information here!

On July 21, 2003, I
posted IDEXX (IDXX) on
Stock Picks Bob's Advice at $38.29. IDXX closed on 7/30/04 at $50.39 for a gain of $12.10 or 31.6%.
On July 23, 2004, IDXX
announced 2nd quarter 2004 results. Revenue rose 13% to $137.4 million from $121.8 million the prior year. Quarterly income rose to $23.9 million or $.66/share from $16.7 million, or $.47/share last year. Excluding one-time gains, this still worked out to $.57/share while analysts were looking for $.52. The company also raised estimates of 2004 and 2005 results. All in all, a very nice earnings report for IDXX!

Also on July 21, 2003, I
posted DSP Group (DSPG) on my blog at $25.23. DSPG closed at $19.71 on 7/30/04 for a loss of $(5.52) or (21.9)%.
On July 19, 2004, DSPG
reported 2nd quarter 2004 results. Revenue for the quarter came in at $44 million, up 14% from $38.6 million the prior year. Net income for the quarter increased 71% to $9.4 million, compared to $5.5 million last year. On a diluted earnings per share basis the earnings increased 58% top $.30/share compared to $.19/share last year. However, on the very next day, DSPG
reduced guidance for the second half of 2004 by $.06-$.07 due to lowered revenue expectations. Negative guidance is never helpful in boosting a stock price!

On July 21, 2003, I also
posted Simpson Mfg (SSD) on this blog at $40.75. SSD closed 7/30/04 at $56.01 for a gain of $15.26 or 37.4%.
On July 20, 2004, SSD
announced 2nd quarter 2004 results. Net sales increased 24.2% to $181.8 million compared to $146.5 million in 2003. Net income increased 23% to $21.8 million for the second quarter of 2004 compared to net income of $17.7 million in 2003. Dilued net income per share came in at $.89 this year compared to $.71/share last year. These look like nice results to me!

On July 22, 2003, I
posted Vital Images (VTAL) on my blog at $21.66. VTAL closed on 7/30/04 at $11.49 for a loss of $(10.17) or (47)%.
On April 29, 2004, VTAL
announced 1st quarter results. Revenue came at $7.7 million, a 14% over last year's results. They reported a loss of $(1.1) million or $(.09)/share compared to net income of $654,000 or $.07/share the prior year. Clearly the stock has suffered from this earnings deterioration.

On July 22, 2003, I
posted Cognizant Technology Solutions (CTSH) here on Stock Picks at $30.22. CTSH split 2:1 on 6/18/04, thus our selection price was effectively $15.11. CTSH closed on 7/30/04 at $27.55 for a gain of $12.44 or 82.3%.
On July 26, 2004, Cognizant
announced 2nd quarter earnings results and raised full-year guidance. For the second quarter, revenue increased 59% to $138.7 million from $87.4 million last year. Earnings were $23.8 million or $.17/share up from $13.5 million or $.10/share last year. These were great results!

QLT Inc. (QLTI) was
posted on Stock Picks on July 23, 2003, at a price of $15.39. QLTI closed on 7/30/04 at $17.95 for a gain of $2.56 or 16.6%.
On July 22, 2004, QLTI
announced 2nd quarter results. Sales of Visudyne were $109.3 million, a 23% increase over sales in the second quarter of 2003. Earnings for the second quarter of 2004 came in at $.20/share, up $.04 from the prior year's second quarter of $.16/share. A satisfactory earnings performance and a subsequent satisfactory price appreciation followed!

Fair Isaac (FIC)
was posted on Stock Picks on July 24, 2004, at $55.42. FIC had a 3:2 split in March, 2004, making our selection price effectively $36.95. FIC closed on 7/30/04 at $28.58 for a net loss of $(8.37)/share or (22.7)%.
On July 28, 2004, FIC
announced 3rd quarter 2004 results. Revenue was up 6% to $173.2 million from $163.0 million the prior year. Net income totaled $28.8 million or $.39/share on 73.1 million diluted shares, vs net income of $30.0 million or $.40/share on 79.4 million diluted shares. Thus revenue was up only slightly, and net income was actually DOWN. Thus, we have the price pull-back!

On July 24, 2003, I
posted Sierra Health Services (SIE) on Stock Picks Bob's Advice at a price of $27.09. SIE closed at $44.20 on 7/30/04 for a gain of $17.11 or 63.2%.
On July 21, 2004, SIE
announced 2nd quarter results. Revenues grew to $441 million from $370 million a year ago. Earnings came in at $38.2 million, or $1.10/share up from $20.3 million, or $.67/share last year. These are GREAT results! In addition, the company BOOSTED ESTIMATES for 2004 to between $3.35 and $3.45 from the prior guidance of $2.90 to $3.00. Clearly this company is "firing on all cylinders"!

Finally, on July 24, 2003, I
posted Columbia Sportswear (COLM) on
Stock Picks Bob's Advice at $52.00/share. COLM closed at $54.75/share on 7/30/04 for a gain of $2.75/share or 5.3%.
On July 21, 2004, Columbia Sportswear
announced 2nd quarter results. Global sales increased 12.5% to $171.1 million. Net income rose to $10.7 million or $.26/share compared with $9.4 million or $.23/share the prior year. In addition, COLM also raised its net income outlook to between 10 to 11% growth over 2003. They also announced that 3rd quarter net income to show a 3-5% growth with revenue up 9-10%.
So overall how did we do? We had results ranging from a loss of (47)% with Vital Images (VTAL), to a gain of 82.3% with Cognizant (CTSH). In summary, during the past year, this week's selections had six positive returns and four negative returns with an average gain of 16.1% for all nine stocks posted that week!
Thanks again for stopping by! I hope the rest of your weekend goes well. Remember, as always that I am an amateur investor so please consult with your professional investment advisors. If you have any questions, comments, or words of encouragement, please feel free to email me at bobsadviceforstocks@lycos.com .
Bob
Posted by bobsadviceforstocks at 8:29 PM CDT
|
Post Comment |
Permalink
Updated: Saturday, 31 July 2004 11:10 PM CDT
Thursday, 29 July 2004
July 29, 2004 Flowserve (FLS)
Hello Friends! Thanks so much for stopping by! Your visits are indeed appreciated and in fact I look forward to hearing from you at bobsadviceforstocks@lycos.com . Please do remember that I am an amateur investor, so please consult with your professional investment advisors prior to making any decisions based on information on this website.

Taking a look at the
USAToday list of top % gainers on the NYSE, I came across Flowserve Cp (FLS) which closed today at $23.90, up $2.07 on the day or 9.48%. I do not own any shares nor do I have any options or leveraged positions in this company. According to the
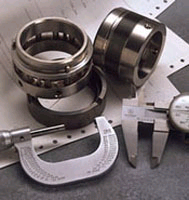
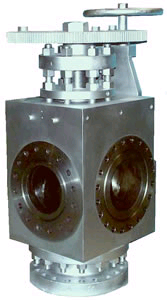
Yahoo "Profile", FLS "...develops and manufactures precision-engineered flow control equipment for critical service applications that require high reliability, including pumps, valves and mechanical seals."
As I have noted on many occasions on this website, what often drives a stock higher on any given trading day is often the release of good news, especially earnings news. Today, just before the opening of trading, FLS
announced 2nd quarter 2004 results. Second quarter sales increased 7% to $654.6 million. Net income came in at $18.4 million or $.33/share compared with $15.3 million or $.28/share the prior year.
Taking a look at a longer-term view, we can see with Morningstar's
"5-Yr Restated" financials, that revenue has grown nicely from $1.1 billion in 1999 to $2.4 billion in 2003. Earnings have been less consistent dropping from $.32/share in 1999 to a loss of $(.27)/share in 2001, and increasing sequentially to the latest report.
Free cash flow, which was a negative $(83) million in 2001, has improved to $155 million in 2003. The balance sheet looks good with $53.5 million in cash and $1.04 billion in other current assets, as opposed to $632.7 million in current liabilities and $1.35 billion in long-term liabilities.
What about valuation? If we take a look at
"Key Statistics" from Yahoo, we see that the market cap is a mid-cap $1.32 Billion. The trailing p/e is a moderate 23.76 with a forwards p/e (fye 31-Dec-05) of 15.42. Thus, the PEG is a very nice 1.14, and the Price/Sales is 0.49.
Yahoo reports that there are 55.27 million shares outstanding and of these, 54.60 million of them float. There is a modest 997,000 shares out short as of 7/8/04 representing 2.724 trading days. No cash dividend is paid per Yahoo, and the last stock split was a 3:2 in March, 1994.
How does the chart look? If we look at a Point & Figure chart from Stockcharts.com:
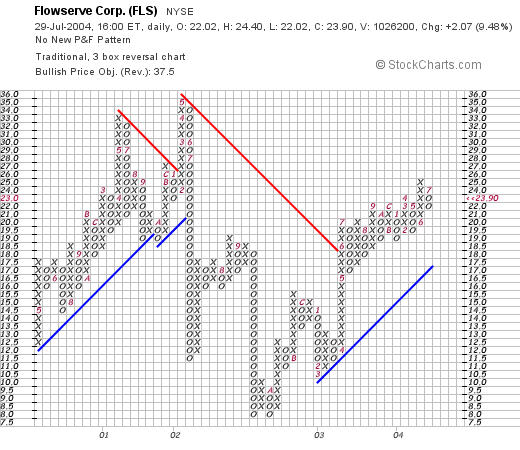
we can see that this stock initially traded higher from $12.50 in May, 2001, and peaked at $36.00 in May, 2002. From that point it traded lower, bottoming at $8.00 in October, 2002, and since that time has traded steadily higher above its current support level. The stock looks good but not over-valued chartwise, in my amateur humble opinion. Again, I am not a technician, so if anyone else has a different opinion on this, please let me know.
Overall, I like this particular stock just fine. The latest earnings report is solid if not spectacular, the recent earnings growth has been steady the last few years. Free cash flow is solidly positive. The balance sheet looks just fine. And the valuation is great with a PEG just over 1.0 and a price/sales under 1.0. The chart looks fine and not at a point that the price has gotten way ahead of itself.
Now, if only I could sell one of my existing positions at a gain! Then I could BUY something new! Currently in my Trading Portfolio, I am down to about 19 positions, so I have room for six more.
Again, thanks for stopping by! If you have any questions, comments, or words of encouragement, please feel free to email me at bobsadviceforstocks@lycos.com .
Bob
Wednesday, 28 July 2004
July 28, 2004 National Instruments (NATI)
Hello Friends! Thanks so much for stopping by! I took a break from the Democratic Convention (I am a total political junkie and love to watch all of the politicians from both parties speak!), and decided I had better take care of my blog! Please remember, as always, that I am an amateur investor, so please consult with your professional investment advisors before taking any action based on information on
Stock Picks Bob's Advice.

National Instruments (NATI) had a very nice day today, closing at $27.89, up $3.13 or 12.64%. According to the
Yahoo "Profile", NATI "...is a supplier of measurement and automation products. Its products consist of application software, and hardware components together with industry-standard computers, networks and the Internet to create measurement and automation systems." If THAT is less than clear to YOU, well, you are not alone. Clearly this is a high-tech manufacturing firm....but THAT is not what attracted me in some Peter Lynch style, but the NUMBERS...which I will review for you!
Yesterday, after the close of trading, NATI
announced 2nd quarter results. In a nutshell they were terrific: second quarter revenue was up 27% to $127 million, operating income was up 70% from last year, fully diluted earnings were $.14/share, up 56% from $.09/share the prior year. In addition, the company released guidance for the next two quarters anticipating continued growth in earnings and revenue. As always, these actions and results are very helpful in pushing a stock price higher, and NATI obliged!
How about longer-term? Looking at
"5-Yr Restated" financials from Morningstar.com, we can see that revenue, although slightly erratic, has grown from $329.6 million in 1999 to $451.4 million in the TTM.
Earnings, while improving the last couple years, have been inconsistent, peaking at $.69/share in 2000, dropping to $.39/share in 2002, and then improving steadily since. Free cash flow looks nice with $(8) million reported in 2001, improving the $41 million in the TTM.

Looking at the balance sheet on Morningstar, we find a superb set of numbers starting with $198.8 million in cash compared to $83.1 million in current liabilities and only $10.3 million in long-term debt. In addition, NATI has $156.2 million in other current assets. This looks very nice!
How about "valuation"? Looking at
"Key Statistics" on Yahoo, we can see that this is a Mid-Cap stock with a market cap of $2.20 billion. The trailing p/e is steep at 52.33, with a forward p/e (fye 31-Dec-05) of 28.46. The PEG is also a bit rich at 2.09, and the Price/Sales is 4.08.
Yahoo reports 78.84 million shares outstanding with 48.10 million of them that float. There are a LOT of shares out short. As of 7/8/04, there were 3.31 million shares out short representing 13.127 trading days. The move today 'might' be a bit of a squeeze of the short-sellers as they scrambled to buy back pre-sold shares. This short interest is most likely due to the steep valuation (p/e), but with the latest quarterly results, I would be hard pressed defending anyone who was interested in selling this company short. (just my opinion.)
The company does pay a small dividend which it initiated in 2003, paying $.20/share yielding 0.81%. The last stock split was a 3:2 in February of this year.
How about the chart? Taking a look at a stockcharts.com Point & Figure Chart:
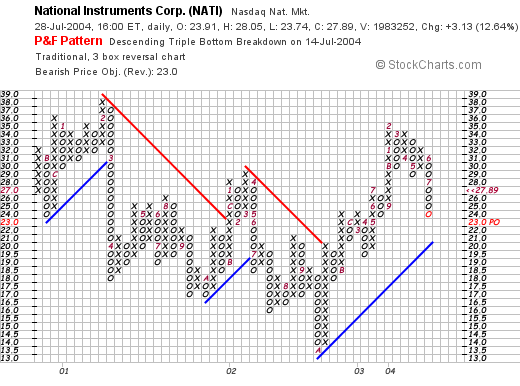
looking at the chart, and I am NOT a technician by any means, but you can see that this stock was trading lower between February, 2001 through October 2002, when it bottomed at $13.50. Since then it has been trading higher. The chart looks nice to me as the stock is currently heading higher and doesn't appear over-extended. Then again, take a look yourself at the graph and see what you think!
Well, what do I think? Well, I like the recent quarterly report a lot. I like the fact that NATI is predicting a continued growth in revenue and earnings for the next two quarters. I wish I had a better feel for their products....but the numbers aren't bad. The "valuation" is a bit steep both with a high p/e and a PEG just over 2.0, however, if the current explosive earnings growth continues, these numbers will be adjusted in a positive fashion. NATI is generating loads of cash and the balance sheet is superb. In addition, the recent initiation of cash dividends is always a plus as this will add additional investors who are looking for dividends as well as growth. Technically, the graph looks just fine and I like the fact that there are a LOT of short sellers out there. That is bullish imho. I would even consider buying some shares, but you know the story....I have to wait to sell something at a gain from my current portfolio!
Thanks so much for bearing with me! I hope that my discussion and links were helpful to you. If you have any questions, comments, or words of encouragement, please feel free to email me at bobsadviceforstocks@lycos.com .
Bob
Tuesday, 27 July 2004
July 27, 2004 L-3 Comms Hldgs (LLL)
Hello Friends! Thanks so much for stopping by
Stock Picks Bob's Advice. I try real hard to polish up my posts, but please remember that I am an amateur investor so please check with your own professional investment advisors before taking any action based on information on this website. Also, do your own investigations on all investment ideas you see here as well as anywhere on the internet!
I was scanning the lists of
Price % Gainers on the NYSE and saw that L-3 Communications (LLL) was doing quite well, currently trading at $59.24/share as I write, up $2.74 on the day or 4.85%. I do not own any shares of this nor do I have any options or leveraged positions.

According to the
Yahoo "Profile", L-3 "...is a supplier of a range of products used in a number of aerospace and defense platforms. It is also a supplier of subsystems on platforms, including those for secure communications networks; mobile satellite communications; information security systems; shipboard communications; naval power systems; fuses and safety and arming devices for missiles and munitions; microwave assemblies for radars and missiles; telemetry and instrumentation, and airport security systems."
As is commonly seen on this website, what drove the stock higher today was an earnings report; specifically LLL
reported Second Quarter 2004 results. Sales increased by 36.9% to $1.68 billion from $1.23 billion last year during the same quarter. Net income for the second quarter increased by 65.0% to $88.1 million compared to $53.4 million in the second quarter 2003. Diluted earnings per share rose by 52.8% to $.81/share compared to $.53/share last year. In addition, the company raised expectations saying they expected sales for 2004 compared to 2003 to "...grow in excess of 30% to more than $6.6 billion". Operating income was estimated to "...grow by more than 26% resulting in diluted earnings per share of approximately $3.40." The street liked what it heard and the share price took off accordingly!
How about longer-term? Looking at a
"5-Yr Restated" financials from Morningstar.com, we can see a very nice growth picture with $1.4 billion in revenue in 1999, $1.9 billion in 2000, $2.3 billion in 2001, $4.0 billion in 2002, $5.1 billion in 2003 and $5.5 billion in the trailing twelve months (TTM). You can see from the recent announcement, that L-3 expects $6.6 billion in revenue for 2004!
Earnings have also increased in an uninterrupted fashion from $.88/share in 1999 to $2.88 in the TTM. Free cash flow has also been increasing from $125 million in 2001 to $373 million in the TTM. The balance sheet on Morningstar, shows $205.5 million in cash and $1.9 billion in other current assets, plenty to cover the $994.6 million in current liabilities and make a big dent in the $2.7 billion in long-term debt.
What about other parameters of valuation? Looking at
"Key Statistics" on Yahoo for LLL, we see that the market cap is a large $6.27 billion. The trailing p/e isn't bad at 20.62 with a forward p/e (fye 30-Dec-05) of 15.53. The PEG is reasonable at 1.11, and the Price/Sales is also downright cheap at 1.11. The company is selling for just over 2x book.
Yahoo reports 105.99 million shares outstanding with 99.30 million of them that float. Of these, 3.28 million shares are out short, but with the high trading volume, this represents only 3.531 trading days. The short interest is down from the previous month's 4.83 million. (short interest is as of 7/8/04). Thus, some of the shorts are taking their "bets" off the table. Who would want to bet against THESE numbers?
A nice touch is that the company DOES pay a small dividend of $.40, yielding 0.71%. The last stock split was a 2:1 in May, 2002. It appears from Morningstar, that this dividend is a new plus to this stock and again indicates the confidence (imho) of the management in the reliability of future earnings.
How about some technicals? If we look at a point and figure chart from stockcharts.com:
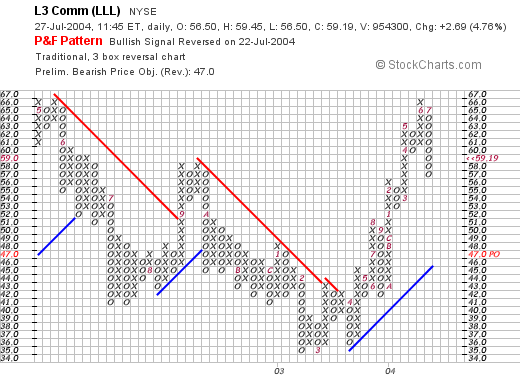
we can see that this stock was actually trading lower from May, 2002, until March, 2003, when it bottomed at around $35/share. Since then it has traded strongly higher above its support level and in my simple view of the graph, well it looks strong to me and heading higher! Again, I am not a technician, but what do you think?
So, in summary, what do I think of this stock? Well, if I had available cash it would be a stock that I might buy in my portfolio. (I don't need to go over my trading strategy AGAIN do I? But if you haven't read it, I am personally waiting to sell a portion of one of my EXISTING holdings in my "Trading Portfolio" before I add a new position.) That being said, I LOVE the recent quarterly report that came out today, both for the STRONG current revenue growth (even excluding growth attributed to acquisitions, the organic growth in revenue was in the mid-teens), STRONG current earnings growth, and the RAISED expectations. The STEADY growth in revenue and earnings the past 5 years looks nice. I don't mind that it now pays a dividend making it more attractive to investors looking for a little income, and the GROWING free cash flow along with a solid balance sheet is nice. Valuation looks pretty with a relatively LOW p/e, with an EXCELLENT PEG, and Price/Sales ratio, why we even have some short sellers out there that would need over 3 days to cover. EVERYTHING looks nice to me, except that it is a defense contractor...and some people might just want to avoid this group, knowing the possible volatility in defense contracting issues as the political winds change. Other than that, looks great to me.
Again, thanks for stopping by! If you have any questions, comments, or words of encouragement, please feel free to email me at bobsadviceforstocks@lycos.com .
Bob
Newer | Latest | Older


