Stock Picks Bob's Advice
Monday, 20 December 2004
"Trading Transparency" DRS Technologies (DRS)
Well that nickel didn't stay in my pocket very long! Looking through the lists of top % gainers, I came across DRS Technologies, a defense contractor that I have owned in the past.
I purchased 200 shares of DRS at $44.69 in my trading account. DRS is currently trading at $44.67/share as I write, up 3.71% on the day. I will try to update the DRS story later!
Regards!
Bob
"Trading Transparency" Cantel (CMN)
Hello Friends! This is a quick post to let you know that I hit a sale point on Cantel (CMN) on the upside. A few moments ago, I sold 55 shares, representing approximately 1/4 of my 225 shares of Cantel as it hit a 60% gain. The 55 shares were sold at $33.75. I have a cost basis of $20.04, and thus had a gain of $13.71 or 68.4%. These shares were acquired on 6/4/04, and thus I have owned them just over six months.
I sold my first shares (of my 300 shares originally purchased); 75 shares were sold 7/8/04 at a price of $25.20, for a gain of $5.16 or 25.7% (a little shy of the 30% gain!). Cantel recently announced a 3:2 stock split, but I am not sure what is driving the stock higher today as it is up $2.64 or 8.47% on the day enabling me to sell a portion of my holdings.
My favorite part of this is that I can now look around to purchase a new position! I don't have to sit on my hands at the moment...and I shall let you know if I find anything suitable to buy for my account!
Bob
P.S. Sorry about not getting that "Weekend Review" out...will address that soon hopefully!
Sunday, 19 December 2004
December 19, 2004 C R Bard (BCR)
Hello Friends! Thanks so much for stopping by my blog,
Stock Picks Bob's Advice. As always, please remember that I am an amateur investor, not a certified investment advisor, so please consult with your professional investment advisors prior to making any decisions based on information on this website. As alway, remember that I cannot be responsible for your losses nor do I want to take credit for any of your gains. If you have any questions or comments, please feel free to email me at bobsadviceforstocks@lycos.com or leave them right here on the blog!
Earlier this week I intended to post C R Bard (BCR) here on Stock Picks, and quite frankly I never got around to it! It had a nice day with a big jump in price on Thursday, when it made the list of top % gainers and got my attention:
 Now in retrospect, interestingly, the stock not only made a nice move higher, it has held onto that gain showing how strong that price move really was!
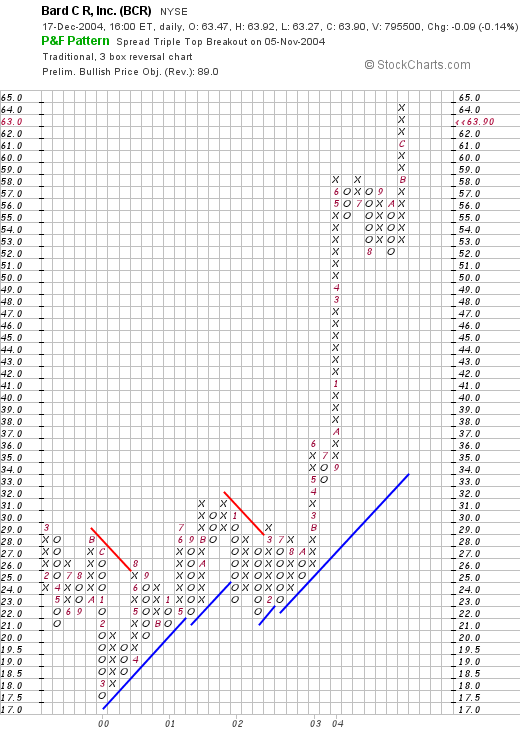
BCR closed on Friday, December 17, 2004, at $63.90, down $(.09) or (.14)% on the day. According to the Yahoo "Profile", C.R.Bard "...is engaged in the design, manufacture, packaging, distribution and sale of medical surgical, diagnostic and patient care devices." I do not own any shares nor do I have any options or leveraged positions in this stock.
What drove the stock higher Thursday was a report released on Wednesday 12/15/04, after the close, that the company saw 2005 earnings growth of at least 14%. In addition, the company predicted revenue growth of 10 to 11% adjusted for currency exchange rates. The company also suggested that the next quarter's results of $.61, in line with consensus, was reaffirmed except that if it missed the target it "will be because profits exceeded the estimate." This comment is a way of raising guidance, almost always bullish for a stock price!
 How about the latest quarter's results? On October 19, 2004, BCR reported 3rd quarter 2004 results. Net sales came in at $421.9 million for the quarter ended September 30, 2004, up 17% over the prior year's net sales of $361.8 million. (Adjusting for currency exchange rates, this still came in for a 15% increase in net sales!). Net income was $102.4 million and diluted earnings came in at $.95, up 99% and 94% respectively over the prior year. Excluding one time items, net income and diluted eps still came in at a gain of 33% and 31% respectively compared to the same quarter in 2003. These were very strong results!
How about 'longer-term'? Taking a look at the Morningstar.com "5-Yr Restated" financials, we can see the steady revenue growth from $1.04 billion in 1999 to $1.61 billion in the trailing twelve months (TTM).
Earnings during this period have been steadily, if not perfectly, growing from $1.14/share in 1999 to $2.37/share in the trailing twelve months. Dividends (!) have also been steadily increasing with small increases each and every year since 1999 when the dividend was $.39/share, to the TTM when it was reported on Morningstar at $.47/share.
Free cash flow, while not increasing, has been strong at $230 million in 2001, holding at $205 million in the TTM. The balance sheet is also quite solid with $485.2 million in cash and $485.4 million in other current assets, plenty to cover both the current liabilities of $375.8 million AND pay off all of the long-term liabilities of $258.5 million and still have current assets left over!
 What about 'valuation' questions? Looking at "Key Statistics" on Yahoo, we can see that this is a large cap stock (over $3 billion market cap) with a market cap of $6.69 billion. The trailing p/e is moderate at 26.97 with a forward p/e (fye 31-Dec-05) of 22.82. The PEG also suggests a slight premium for this stock at 1.76. It doesn't look like we are the first to discover this company!
Yahoo reports 104.65 million shares outstanding with 101.7 million that float. Currently, as of 11/8/04, there are 1.41 million shares out short, which although sounding like a large number, actually only represents 1.38% of the float or 2.023 trading days to cover. So it isn't a big deal imho.
As I noted earlier, the company currently has a dividend of $.48/share yielding 0.75%. The company also recently (6/1/04) split their stock 2:1.
How about 'technicals'? If we take a look at a Point & Figure Chart on C.R.Bard, we can see the very strong price performance on this company. Trading sideways between March, 1999, and August, 2003, at around the $30.00 range, the stock has exploded to the upside to the $64 range. If anything, the stock may be a bit over-valued and the price ahead of itself...but I usually do not try to outsmart the graph. Thus, the stock chart, at least at this time, looks very strong!
So what do I think? Well the latest earnings report was very strong. They raised guidance, the past five years have been solid with steady free cash flow generated and the balance sheet is excellent. The valuation is a bit steep and the stock chart might be a bit over-extended. Otherwise I love this stock. Unfortunately, I don't have any available cash to buy any shares....and am waiting, in any case, for a buy signal with my own portfolio.
Until then, I shall sit on my hands and not buy anything! Thanks again for stopping by and visiting! If you have any questions, comments, or words of encouragement, please feel free to email me at bobsadviceforstocks@lycos.com .
Bob
A reader writes, "What about Rogers Corp.?"
Hello Friends! I always enjoy receiving comments and questions from readers. Yesterday I received a nice note from pdhanks, Thank You for the kind words pd. I also received a question from Chingow, who asked me about Rogers Corp (ROG). Let me try to tackle that question. Even though pd is kind, I am indeed an amateur investor so please consult with your professional investment advisors before acting on anything I write! By the way, I do not own any stock in Rogers (ROG)...but wish to share with you anything I can find that either makes this stock an investment consistent with my goals or perhaps a fine investment that just doesn't fit into my investment goals.

First of all, Rogers (ROG) closed at $45.28 on December 17, 2004, down $(.37) or (.81)% for the day. According to the
Yahoo "Profile" on Rogers, Rogers "...manufactures and sells specialty polymer composite materials and components that it develops for markets and applications around the world." O.K. sounds ok so far!

The first place I like to look when thinking about a stock is the latest quarter results. That way, I can try to get a feeling for how a company is doing right "now". On October 20, 2004, Rogers
announced 3rd quarter 2004 results. They reported that quarterly income rose to $6.5 million or $.38/share, up from $6.3 million, but down from $.39/share last year. So THAT was a mixed report; revenue jumped slightly, but earnings edged lower. However, net sales jumped 53% to $86.7 million from $56.5 million last year. THAT is the kind of result I do like. Apparently $10.4 million in additional revenue was do to an acquisition of "Durel".
HOWEVER, as part of that earnings report, Rogers LOWERED expectations, predicting profit of $.40 to $.45/share on sales of $82-$87 million. Analysts had been expecting $.54/share on revenue of $91.7 million. I always PREFER companies that RAISE expectations above analysts views instead of lowering them. Raising expectations is sort of like raising the thermostat on a cold winter day (boy can I ever relate to THAT here in Wisconsin!), first you raise the thermostat and later the whole house warms up! If you lower that "thermostat" by lowering expectations, I am afraid there is a good chance, at least short-term, to see a decline in the stock price.

How about longer-term? My next step is usually to navigate over to the Morningstar.com site. For Rogers, looking at the
Morningstar.com "5-Yr Restated" financials, I start with the easily understood bar graphs at the top of the page where the revenue results are displayed. I prefer to see continually increasing revenue bars. For Rogers, revenue actually declined from $247.8 million in 1999 down to $216.0 million in 2001. It has been improving recently, and Morningstar shows $363.5 million in the trailing twelve months (or TTM as Morningstar calls it!) With the last several years showing improvement, that isn't bad, but imho, I prefer steady growth all five years.
Earnings also have been a bit erratic dipping to $.98/share in 2001 from $1.19 in 1999, but since then they have been growing very strongly to $2.32 in the TTM. So this doesn't look too bad either.
Free cash flow? Well that is sort of the actual money either being generated or consumed by the operation in question. For ROG, according to Morningstar, Free Cash Flow has been positive, with $21 million in 2001, dropping to $5 million in the TTM. Again, this looks nice, but to look 'fabulous' I like to see positive and increasing free cash flow.
How about their 'balance sheet'? At least on Morningstar.com, this looks fine. They are showing $29 million in cash and $118 million in other current assets. That is plenty to cover both the $55.3 million in current liabilities and $30.6 million in long-term debt.

So what do I check next? My next step is to try to figure out 'valuation' questions, at least on a basic level. For this, I again turn to Yahoo, looking at the
"Key Statistics" on Rogers. Here we can see that ROG is a mid-cap stock (see market capitalization definition
here), with a market cap of $758.8 million. The trailing p/e is nice at 19.49 (anything under 20 with a reasonable growth rate is "nice" to me!), and the forward p/e (based on earnings estimates instead of actual recorded earnings) is 17.02 (fye 28-Dec-05). Also showing reasonable valuation is the PEG which is reported at 1.02. Anything near 1.0 is a good PEG imho.
Yahoo reports 16.76 million shares outstanding with 14.20 million of them that float. Currently there are 544,000 shares out short (as of 11/8/04) representing only 3.83% of the float or 6.044 trading days of volume. I arbitrarily use 3.0 trading days, and anything higher than that is a bullish indicator, imho, suggesting a more significant level of shares out short that eventually need to be 'covered' by being purchased.
ROG does not pay a dividend and the last stock split was in May, 200, when the company split 2:1.
How about 'technicals'? For this I turn to
the Point & Figure Chart on Stockcharts.com. I have started to fairly exclusively rely on these "Point & Figure" style of charts which show buying pressure and upward price movement with columns of 'x's' and columns of 'o's' for descending prices. This graph looks like this:
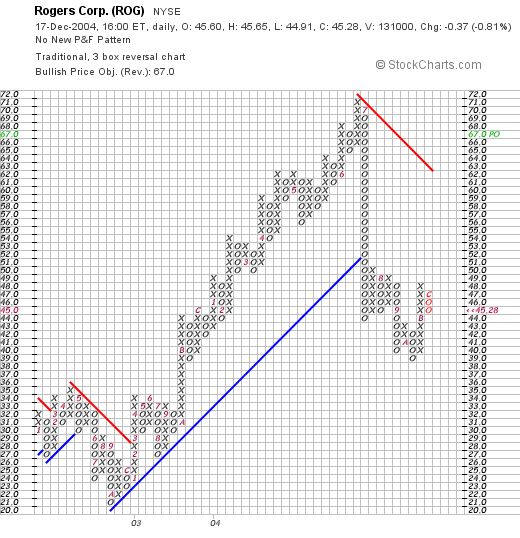
Here we can see what appears to be a very strong chart from October, 2002, when the stock was trading around $21 to a peak at about $71 in July, 2004. However, the stock really looks like it broke down after that and I am not convinced it has found an area of support where it appears to be moving higher. The chart looks discouraging to me.
So what do I think? Well, the latest quarter result leaves some things to be desired. Revenue DID jump strongly but earnings faltered and the company lowered expectations for the upcoming quarter. The Morningstar.com report looked nice, at least for the last several years, and valuation was reasonable. However, the chart leaves a bit to be desired imho.
This stock might turn out to be a fabulous investment. My thoughts are that it just doesn't fit into my criteria. That does not mean the stock might not rise from here and turn out to be a fabulous purchase. It just is that it doesn't fit into my target parameters. I hope you understand what I am saying! Also, I AM an amateur investor, so please consult with your professional investment advisors before making any decision one way or another. If you have any questions, you can post them on my blog, Stock Picks Bob's Advice, on my Xanga blog, or email me at bobsadviceforstocks@lycos.com .
Thanks so much for visiting, for participating in my blog, and for all of the kind words! Have a wonderful Sunday and a very happy Holiday Season!
Bob
Sunday, 12 December 2004
"Looking Back One Year" A review of stock picks from the week of October 27, 2003

Hello Friends! Thanks so much for stopping by and visiting my blog,
Stock Picks Bob's Advice. It is Sunday evening, and I REALLY should have gotten this together earlier, but I am a BIG procrastinator. THAT will be one of my New Year's Resolutions once again...to be more proactive about getting things done! As always, please remember that I am an amateur investor, so please consult with your professional investment advisors prior to making any investment decisions based on information on this website to make sure such decisions are timely, appropriate, and likely to be profitable for you. If you have any questions about this or any other aspect of this blog, please feel free to email me at bobsadviceforstocks@lycos.com .

On October 28, 2003, I
posted Portfolio Recovery Associates (PRAA) on Stock Picks at a price of $26.93. PRAA closed on 12/10/04 at a price of $36.67, for a gain of $9.74 or 36.2%.
On 10/21/04, PRAA
announced 3rd quarter 2004 results. Total revenue was up 28% to $28.3 million from $22.2 million last year. Net income came in at $7.0 million or $.44/diluted share for the quarter ended September 30, 2004, a 26% increase from the $5.5 million or $.35/diluted share last year.

I
posted Altiris (ATRS) on Stock Picks On October 28, 2003, at a price of $31.93. ATRS closed at $30.07 on 12/10/04 for a loss of $(1.86) or (5.8)%.
On October 25, 2004, ATRS
announced 3rd quarter 2004 results. Total revenue came in at $40.7 million, up strongly from the $25.4 million reported in the third quarter of 2003. Net income was $3.4 million or $.12/diluted share. This compares unfavorably with net income last year of $3.8 million or $.15/diluted share.

I
posted Opnet (OPNT) on Stock Picks on 10/29/03 at a price of $14.10. OPNT closed on 12/10/04 at $8.05, down $(6.05) from the pick price of a loss of (42.9)%.
On October 28, 2004, OPNT
reported 2nd quarter 2005 results. Revenue for the second quarter ended September 30, 2004, was $14.2 million up from $13.4 million last year. Earnings per share, however, came in at $.02/diluted share, down sharply from $.07/diluted share in the same quarter last year. Once again we see stock prices following earnings results, both good & bad.

On October 29, 2003, I
posted SpectraLink (SLNK) on Stock Picks at a price of $18.54. SLNK closed at $14.62 on 12/10/04 for a loss of $(3.92) or (21.1)%.
On October 20, 2004, SpectraLink
announced 3rd quarter 2004 results. Net sales for the quarter ended September 30, 2004, increased to $23.0 million from $18.3 million last year. Diluted earnings came in at $.15/share, up from $.12/share last year. Overall a reasonably good quarter.
 Kyphon (KYPH) was posted on Stock Picks
 on October 30, 2003, at a price of $29.15. KYPH closed at $23.30 on 12/10/04, for a loss of $(5.85) or (20)%.
On October 26, 2004, KYPH
reported 3rd quarter 2004 results. For the quarter ended September 30, 2004, net sales came in at $55.8 million, a 59% increase over the $35.1 million in the same period in 2003. Net income for the quarter came in at $6.1 million, or $.14/diluted share compared with $.11/diluted share the prior year.

On October 30, 2003, I
posted Netscreen (NSCN) on Stock Picks at a cost of $27.16. Early in 2004, Juniper (JNPR) purchased NSCN for 1.404 shares of Juniper. JNPR closed at $28.14 on 12/10/04, making the Netscreen shares worth $39.51 for a gain of $12.35 or 45.5%.

So, overall, how did we do that week? (Please note that the entire analysis involves a buy and hold strategy which I do not employ in my own trading account!). For the week, I had four losers ranging from (5.8)% to (42.9)%, and two gainers gaining 36.2% and 45.5%. Overall the average, for the six picks, I had an average loss of (1.33)%. Could have been better!
Thanks so much for stopping by! If you have any questions, comments, or words of encouragement, please feel free to email me at bobsadviceforstocks@lycos.com .
Bob
Posted by bobsadviceforstocks at 7:27 PM CST
|
Post Comment |
Permalink
Updated: Sunday, 12 December 2004 11:01 PM CST
Wednesday, 8 December 2004
December 8, 2004 Cogent Systems (COGT)
Hello Friends! Thanks so much for stopping by and visiting my blog,
Stock Picks Bob's Advice. As always, please remember that I am an amateur investor, so please consult with your professional, Certified Investment Advisors, to make sure that all of your investment decisions are appropriate, timely, and likely to be profitable for you!

Looking through the
list of top % gainers on the NASDAQ today, I came across Cogent Systems (COGT), which as I write is trading at $35.027, up $2.847 on the day or 8.85%. I do not own any shares of Cogent nor do I have any other leveraged related positions in this issue.

According to the
Yahoo "Profile" on COGT, Cogent "...is a provider of automated fingerprint identification systems (AFIS) and other fingerprint biometrics solutions to governments, law enforcement agencies and other organizations worldwide."
On November 1, 2004, COGT
reported 3rd quarter 2004 results. For the quarter ended September 30, 2004, revenues came in at $23.4 million, up 37% SEQUENTIALLY from the prior quarter which had $17.1 million in revenue. This was up over 1,500% from the $1.3 million in revenue reported in the same quarter in 2003. Net income on a GAAP basis, came in at $19.8 million or $.28/diluted share compared to net income of $7.2 million or $.10/diluted share the PRIOR quarter! The prior year same quarter showed a loss of $(973,000) or $(.02)/diluted share. This is a very new publicly traded company, having come public during this third quarter. It apparently is in the sweet spot of the security world and provides a product that is in high demand in our age of heightened security awareness and identification needs.
How about longer-term? If we look at a
"5-Yr Restated" financials on Morningstar.com, we can see that revenue was stagnant between 1999 at $16 million, dropping to $13 million in 2001, then increasing steadily since then to $55 million in the trailing twelve months (TTM).
Morningstar does not show any earnings, but the latest report as noted above shows rapid earnings growth.
Free cash flow has also turned decidedly positive with $3 million reported in 2001, dropping to $2 million in 2002, then climbing to $19 million in 2003 with $27 million reported in the trailing twelve months.

If we look at the Morningstar.com balance sheet as presented on the same page we can see that the company is plenty solvent with $22.5 million in cash and $24.7 million in other current assets. That is enough to easily cover both the $14.2 million in current liabilities and the $13.4 million in long-term liabilities combined.
How about valuation? This picture isn't quite as pretty. This company has a market cap of $2.82 billion, making it almost a large cap company. The trailing p/e is rich at 63.92, the forward p/e isn't much better per Yahoo at 67.12 (fye 31-Dec-05), and the PEG is at 2.78. In spite of all of this pricey valuation, this company is growing SO FAST, I mean earnings up 1,500% year over year....and revenue up 37% sequentially....that I probably wouldn't be frightened away from this one...but this isn't any kind of "Filene's Bargain Basement" kind of stock!
Yahoo reports 80.79 million shares outstanding with 19.00 million of them that float. Of these 327,000 shares are out short as of 11/8/04, representing 1.72% of the float or only .372 trading days of volume, so that isn't much! No cash dividend nor any stock dividends are reported on Yahoo.
How about "technicals". Looking at a
Point and Figure Chart from Stockcharts.com:
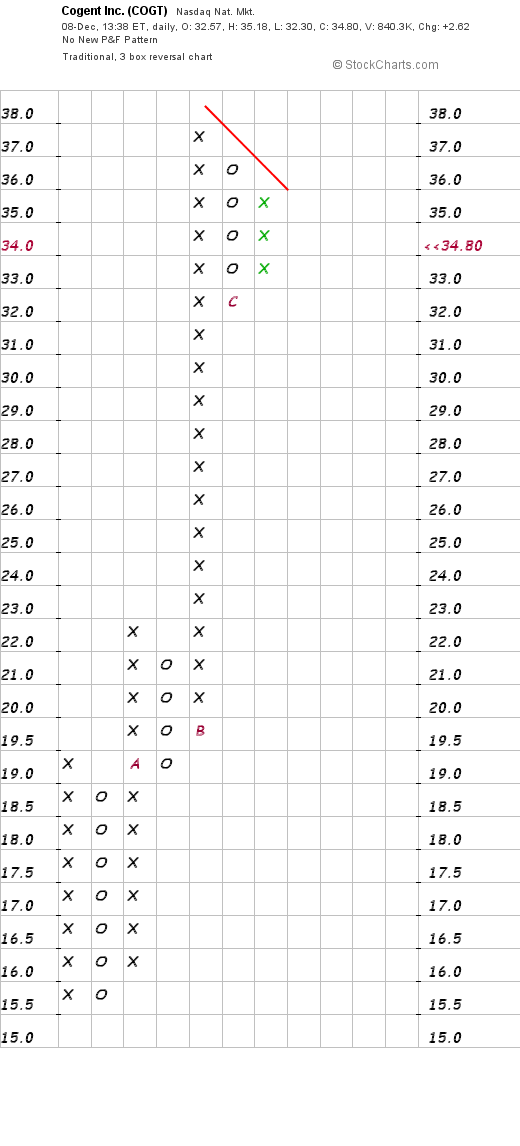
we see a very limited chart in duration, but wow, look at this stock go!
So what do I think? Well this is a very interesting stock. It reminds me a little bit of Ceradyne (CRDN) which I have reviewed on this blog elsewhere. The business, fingerprint identification, is about as timely as any business I have looked out. This company has a product, is profitable, is generating free cash flow, and has a nice balance sheet. On top of this, they have unbelievable earnings and revenue growth the last couple of quarters. In addition, their chart shows amazing strength. I suspect that the security issues propelling this stock ahead will not just disappear and we may see a lot of growth in this business in the future! Of course, we don't know if other technology will prove better or if other companies will offer competing products...but for the moment, well if I had some money to invest, I probably would be buying some shares!
Thanks so much for stopping by. If you have any questions, comments, or words of encouragement, please feel free to email me at bobsadvicefostocks@lycos.com .
Bob
Tuesday, 7 December 2004
"Trading Transparency" XXIA
Well there goes XXIA. A few moments ago I checked my holdings and sure enough IXIA (XXIA) hit my 8% limit, and I pulled the plug. I now need to sit on my hands before buying another stock until I sell some shares at a gain! Full details: 400 shares of XXIA were sold at $13.70. I had purchased the 400 shares just a couple of days ago at $15.19. Thus, I had a loss of $(1.49)/share or (9.8)%.
Thanks for stopping by!
Bob
Monday, 6 December 2004
December 6, 2004 DaVita (DVA)
Hello Friends! Well, if you are reading this blog, you will know that earlier today I reported on
Stock Picks Bob's Advice that I had purchased shares of DaVita (DVA) in my
"Trading Portfolio". Now I could have sworn that I already had posted this stock somewhere on this blog...and I indeed may have, but even I find it a bit tough to sort through all of the entries, and I didn't locate any post or discussion, so I promised you I would talk about DaVita right here. I did own some shares in my trading account in the last year, and sold on a dip even though I was in a profit situation...so I am back into this stock! Please remember that I am an amateur investor so please consult with your professional investment advisors before making any investment decisions based on information on this website.

DaVita (DVA), according to the
Yahoo "Profile" on DVA "...is a provider of dialysis services in the United States for patients suffering from chronic kidney failure, also known as end-stage renal disease (ESRD)." As I noted earlier, I just purchased 200 shares of DVA in my own trading account. DVA is doing well today and showed up in the
list of top % gainers on the NYSE. Currently, as I write, DVA is trading at $36.42, up $2.92 on the day or 8.72%.

On November 2, 2004, DVA
reported 3rd quarter results. For the quarter ended September 30, 2004, net operating revenue came in at $595.5 million up from $513.3 million last year. Net income was $60.4 million or $.59/diluted share up from $38.1 million in the same quarter in 2003 or $.36/diluted share. These results look solid to me!

After determining that the latest quarterly earnings report was satisfactory, I like to turn to Morningstar.com to get a longer-term view. The
"5-Yr Restated" financials on DVA show that revenue has steadily been growing from $1.4 billion in 1999 to $2.2 billion in the trailing twelve months (TTM). During this time, the company has also steadily improved its earnings from a loss of $(1.21) in 1999 to $1.96/share in the TTM. Free cash flow has also been positive with $214 million in 2001 and $193 million in 2003.
The balance sheet on Morningstar whows $200.7 million in cash and $547.7 million in other current assets, plenty to cover the $384.4 million in current liabilities and enough to make a bit of a dent on the sizeable $1.3 billion in long-term debt. Hopefully, with the generation of nearly $200 million in free cash flow annually, we will see the balance sheet continuing to improve.
How about "valuation"? For this I turn to
Yahoo "Key Statistics" on DVA. Here we can see that this is a large cap stock, if we cut off mid-cap at $3 billion. The market cap is $3.57 billion. The trailing p/e is nice at 16.51 with a forward p/e of 15.91 (fye 31-Dec-05). The PEG, with the steady growth, is reasonable at 1.18, and price/sales also nice at 1.46.
Yahoo reports 97.6 million shares outstanding with 96.90 million of them that float. Currently there are 1.64 million shares out short (11/8/04), representing 1.70% of the float or 1.549 trading days, so this doesn't look very significant to me.
No cash dividend is paid. The company did recently split its stock with a 3:2 split reported in June, 2004.
How about "technicals"? If we use a Point & Figure chart from
Stockcharts.com:
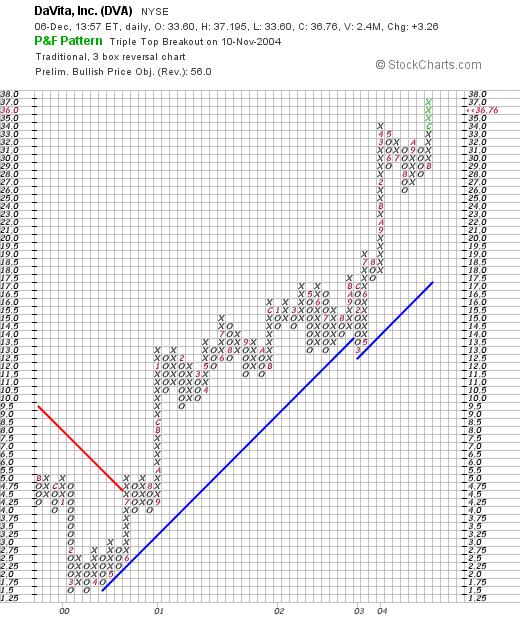

We can see that this stock has a very strong chart, having "bottomed" in March, 2000, at around $1.50/share, it has climbed steadily to its current level with hardly a pull-back! Might even be a tad ahead of itself (?).
So what do I think? Well, I liked this stock enough to purchase some shares. I have been kicking myself when I got "whip-sawed" earlier and dumped this stock when I thought an earnings report was bad...and had moved a bit too quickly. The latest report is solid, the steady revenue and earnings growth looks great, valuation is nice with a p/e in the mid-teens, and the chart and balance sheet is terrific!
Thanks again for stopping by! Again remember I am an amateur so PLEASE consult with your professional advisors as I CANNOT be responsible for your losses and shall not take credit for your gains! If you have any questions or comments, please feel free to email me at bobsadviceforstocks@lycos.com .
Bob
"Trading Transparency" Davita (DVA)
Hello Friends! Well you know how that nickel burns a hole in my pocket (boy is THAT line ever getting old)! Well, I sold a small position in my smallish position in SBUX and this entitled me to purchase a new position! Looking through the lists of top % gainers, I came across Davita (DVA), which I could have sworn that I had reviewed in the blog....but I just don't see where! So I shall need to review this stock a little later.
Making a short story long, I purchased 200 shares a few moments ago at $36.25/share. I am slowly but surely working back up to my 25 position goal. However, if we sell a stock on the downside, I shall be sitting on my hands once again!
Thanks so much for stopping by! Please remember that I am an amateur investor, so please consult with your professional investment advisors before using any information on this website. If you have any questions or comments, please feel free to email me at bobsadviceforstocks@lycos.com .
Bob
Saturday, 4 December 2004
"Looking Back One Year" A review of stock picks from the week of October 20, 2003
Hello Friends! Thanks so much for visiting my blog,
Stock Picks Bob's Advice. As always, please remember that I am an amateur investor so please consult with your professional, certified investment advisors, to make sure that all of your investment decisions are timely, appropriate, and likely to be profitable for you! Please feel free to email me with any of your questions, comments, or words of encouragement at bobsadviceforstocks@lycos.com .
If you are new to this website, well welcome and make yourself at home! What I like to do here, is to look at the active stocks of the day, review their fundamental findings (things like earnings, revenue growth, free cash flow, balance sheet, and valuation); take a brief look at their chart and see if it looks like a "solid" company to me! Of course that is only MY opinion, and you or professional investors might think otherwise. THAT is the fun of all of this. If we all thought the same way, who would care? Since the blog has been up now since May, 2003, and have something like 671 entries here (!), it is nice to review the past picks and see how they would have turned out if we had simply "bought and held". As many of you know, I am NOT a buy and hold investor. I sell stocks quickly at losses of 8% and sell slower on gains. But for the sake of analysis, that is what I like to do on weekends; look back one year and figure out if the ideas listed were 'good' ones!

On October 20, 2003, I
posted SFBC Int'l (SFCC) on Stock Picks at a price of $34.60. SFCC had a 3:2 stock split on 5/20/04 making our effective pick price actually $23.07. SFCC closed at $39.40 on 12/3/04 for a gain of $16.33 or 70.8%.
On 10/27/04, SFCC
reported 3rd quarter 2004 results. Revenue was up 38.8% to $40.4 million from $29.1 million the prior year. Net earnings for the quarter came in at $5.27 million vs. $3.42 million last year or $.34/diluted share vs $.28/diluted share the prior year. These were solid results!

On October 20, 2003, I
posted Renal Care Group (RCI) on Stock Picks at a price of $36.31. RCI had a 3:2 split on 5/25/04 giving us an effective stock pick price of $24.21. RCI closed on 12/3/04 at $33.40 for a gain of $9.19 or 38.0%.
On 10/26/04, RCI
announced 3rd quarter results. Net revenues climbed 40.3% to $356.1 million from $253.8 million the prior year. Net income rose 14.8% to $30.5 million compared with net income of $26.5 million in the 3rd quarter of 2003. Diluted net income per share was up 25.7% to $.44/share compared with $.35/share in the same quarter of 2003.

On 10/20/03 I
posted Varian Medical Systems (VAR) on Stock Picks at a price of $60.78. VAR had a 2:1 stock split on 8/2/04. Thus, the effective stock pick price was actually $30.39. VAR closed at $42.86 on 12/3/04 for a gain of $12.47 or 41.0%.
On October 27, 2004, VAR
reported 4th quarter 2004 results. Revenues for the quarter came in at $345 million, up 14% from the prior year. Net earnings for the quarter came in at $51.8 million, up from $43.6 million the prior year or $.37/diluted share vs. $.31/diluted share in 2003. Solid results imho.

On October 21, 2003,
Exponent (EXPO) was posted on Stock Picks at a price of $20.04. (This is currently the only stock on this weeks group that I currently own in my
"Trading Portfolio") EXPO closed on 12/3/04 at $27.95 for a gain of $7.91 or 39.5%.
On October 18, 2004, EXPO
reported 3rd quarter 2004 results. Revenues came in at $38.04 million, a 7% increase over the $35.66 million reported in the same quarter in 2003. Net income was up 11% to $3.17 million or $.37/diluted share compared with $2.85 million or $.36/diluted share the prior year. These were good results if not quite as spectacular as a couple of the prior posts.

On October 21, 2003, I
posted AirTran Holdings (AAI) on Stock Picks at a price of $19.56. AAI closed at $12.34 on 12/3/04 for a loss of $(7.22) or (36.9)%.
On 10/27/04, AAI
reported 3rd quarter 2004 results. AAI reported revenue of $245.6 million, up from $237.3 million last year. However, the company lost $(9.8) million or $(.11)/share down from a profit of $19.6 million or $.24/share last year. These were NOT good results and the stock price reflected this.

On October 22, 2003, I
posted Headwaters (HDWR) on Stock Picks at a price of $17.41. HDWR closed at $30.47 on 12/3/04 for a gain of $13.06 or 75.0%.
On November 10, 2004, HDWR
announced 4th quarter 2004 results. Revenue for the fourth quarter ended September 30, 2004, came in at $198.6 million (including acquisitions), up 86% from the $106.5 million the prior year. Net Income increased to $19.5 million or $.57/diluted share compared with $11.2 million or $.40/diluted share in the prior year. These results were good and the stock price reflects these developments.
 Shenandoah Telecommunications (SHEN) was posted on Stock Picks
 on 10/23/03 at $43.50/share. SHEN had a 2:1 split February 23, 2004, making out effective stock pick price $21.75. SHEN closed at $31.01 on 12/3/04 for a gain of $9.26 or 42.6%.
On October 19, 2004, SHEN
announced 3rd quarter results. For the quarter ended September 30, 2004, total revenues increased 13.4% from last year. Earnings came in at $.41/share up from $.35/share last year. In addition, SHEN announced a dividend increase. All of these are positive developments for the stock price!

I
posted SM&A (WINS) on Stock Picks on October 23, 2003 at a price of $13.248. WINS closed on 12/3/04 at $8.09, for a loss of $(5.158) or (38.9)%.
On October 18, 2004, WINS
reported 3rd quarter 2004 results. Revenue came in at $16.1 million DOWN from the $18.7 million reported for the same quarter last year. Net income came in at $1.7 million or $.08/diluted share compared with net income last year of $2.9 million or $.13/diluted share. These results are reflected in the lower stock price!

Finally, on October 24, 2003, I
posted Business Objects (BOBJ) on Stock Picks Bob's Advice at $32.15/share. BOBJ closed at $23.65 on 12/3/04 for a loss of $(8.50) or (26.4)%.
On November 3, 2004, BOBJ
reported 3rd quarter 2004 results. Revenue came in at $219.5 million and earnings per share were $.12. This compares with revenue of $129.1 million in 2003. Earnings, however, came in at $.17/share in 2003. Thus, imho, the lower stock price at this time!

So how did we do that week a little over a year ago? Of the nine stock picks that week we had six with gains ranging from 38.0% to 75.0%, and three with losses ranging from (26.9)% to (38.9)%. Our average percentage gain came out at 22.7%. THAT was a great week! Of course, past performance is NOT any kind of guarantee for future performance!
Thanks so much for stopping by! I hope you all have a wonderful weekend and get all of your Holiday Shopping and visiting done! If you have any questions or comments, please feel free to email me at bobsadviceforstocks@lycos.com .
Bob
Newer | Latest | Older


