Stock Picks Bob's Advice
Friday, 21 January 2005
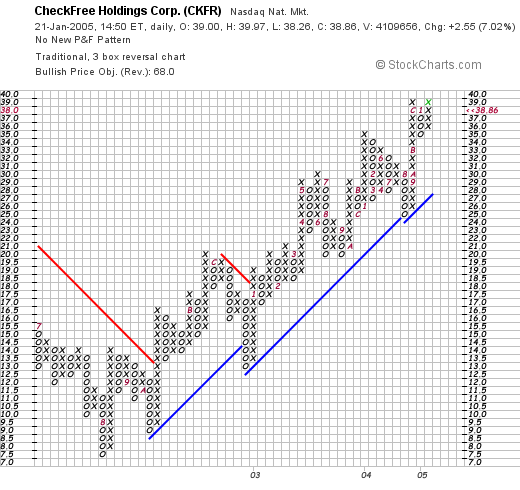
January 21, 2005 CheckFree (CKFR)
Hello Friends! Thanks so much for stopping by and visiting my blog,
Stock Picks Bob's Advice. As always, please remember that I am an amateur investor, so consult with your professional advisors prior to making any investment decisions based on information on this website. If you have any comments, questions, or words of encouragement, please feel free to email me at bobsadviceforstocks@lycos.com .

Looking through the
list of top % gainers on the NASDAQ, I came across CheckFree (CKFR) which as I write is trading at $38.82, up $2.51 or 6.91% on the day.

According to the
Yahoo "Profile", CKFR "...is an electronic payment processing company. The Company provides financial electronic commerce products and services."
Yesterday, 1/20/05, after the close of trading, CKFR
announced 2nd quarter 2005 results. Revenue came in at $185.8 million, up from $150 million in revenue last year. Earnings came in at $13 million, or $.14/share, up from a loss of $(1.9) million or $(.02)/share last year. In addition, CKFR raised guidance slightly for both revenue and earnings for the upcoming 3rd quarter. The "street" liked what it saw, and bid up the stock price today. I do not own any shares or options in this company.

How about "longer-term"? Taking a look at the
"5-Yr Restated" financials on Morningstar.com, we can see a steady record of revenue growth from $310.2 million in 2000 to $643 million in the trailing twelve months (TTM).
Earnings dipped from a loss of $(.61)/share in 2000 to a low of $(5.04) in 2002, but have increased steadily since then to the latest $.25/share in the TTM.
Free cash flow has been strong and improving the last few years from $19 million in 2002 to $151 million in the TTM.

CKFR has a solid balance sheet. As reported on Morningstar.com, they have $217.7 million in cash, enough to pay off both the $187.6 million in current liabilities AND the $30.4 million in long-term debt. In addition, CKFR is reported to have $249.0 million in other current assets.
What about "valuation"? Taking a look at
"Key Statistics" on Yahoo, we can see that the market cap is a large cap $3.51 billion. The trailing p/e is high at 93.61, but going forward (fye 30-Jun-06), the p/e looks better at 26.79. The company has a PEG of 1.31 (5 yr-expected), and a Price/Sales ratio of 5.11.
Yahoo reports 90.46 million shares outstanding with 84.0 million that float. Of these, 11.91 million are out short as of 12/8/04, representing 14.17% of the float. IMHO this is significant, with a short raio of 11.91. I tend to use 3.0 days as a significant volume of shares to make a significant difference in case of a "short squeeze".
No cash and no stock dividends are reported.
What about "technicals"? The chart looks strong. CKFR was trading down lower in July, 2002, but in what appears to be in October 2002, the stock broke through a resistance level at around $12.50 and has traded higher since. This chart appears strong to me!
So what do I think? Well, I like this stock a lot. The latest quarter was solid, the earnings growth is very nice which has been growing alongside the revenue. Free cash flow is superb. The balance sheet is nice, and at least going forward the valuation is reasonable with moderate PEG, and forward p/e.
Now, if only I had some money to invest! LOL....thanks again for stopping by and visiting here on Stock Picks.
Bob
A Reader Writes "Should I buy SIRI"?

Hello Friends! Thanks so much for stopping by and visiting my blog,
Stock Picks Bob's Advice. As I always warn you, I am an amateur investor and cannot be responsible for your trades, so please consult with your professional investment advisors prior to making any decisions based on information on this website!
I was checking my mail the other day, and noticed I had a very nice email from Steve S. who wrote:
Hey Bob,
First off I want to say that I enjoy reading your blog everyday. You
definitely give some insightful advice for investors. You do a great
job with it and I just wish I had some capital to invest in the
market. I just graduated college in spring and recently got hired with
a full time career job at a bank. Unfortunately, I don't have too much
money saved up to start investing in the stock market right now. But I
really want to put some money into it and see how it turns out. My
main problem is that most of the stocks listed on your site are out of
my range to make a purchase. Do you think it is better to start with
out some smaller cap stocks and buy more shares or go with a larger
cap stock when I can buy fewer shares?
One stock that I have been watching recently which I really like is
SIRI. It has been on quite a rocky ride in the past few months but I
believe that XM and Sirius and satellite radio, in general, are going
to be the wave of the future. I mean, the price is right especially
when you look at XMSR at $35/share and SIRI hovering around $6/share.
Now that they also have some major contracts locked up the subscribers
should be jumping onto SIRI. Is it a good idea to buy on speculation
like this? I just don't know if I want to make my first stock market
purchase on a stock like this. But then again it could be a good stock
to hold onto for a year or two to see where it goes. Anyways, thanks
again for taking your time to do the blog. Please let me know if you
have any suggestions as to where I should invest.
SteveLet me try to answer this email the best I can. First, thanks for the kind words on the blog. I hope that what I write in useful to all of you in thinking about stocks and what makes a good investment.
Your next question was about stock price and picking stocks. I want to clear up one thing first. I think you probably understand this but "small cap" and "large cap" have nothing directly to do with stock price. What you want to talk about is small stock price vs. large stock price.
Let me make sure that everyone else understands the difference. In a nutshell, the market capitalization of a given stock is what it would cost to buy every single share at its current trading price. That is, if we multiply the number of shares of a stock by its price, we get the "market cap".
There are a lot of different definitions of market capitalization. Looking through Google, I found a
Market Cap Definition showing small-cap to be under $500 million of capitalization, Mid-cap to be between $500 million to $1 billion, and Large-cap to be above $1 billion. Lately, most definitions place this higher.
In fact, an
"Investopedia" site defines Market Cap as follows:
Mega Cap - This group includes companies that have a market cap of $200 billion and greater. They are the largest publicly traded companies and include names such as Microsoft, Exxon, Wal-Mart, and General Electric. Not many companies will fit in this category, and those that do are typically the leaders of their industry.
Big/Large Cap - These companies have a market cap between $10-$200 billion. Many well-known companies fall into this category, which includes names like Yahoo, IBM and Citigroup. Typically, large-cap stocks are considered to be relatively stable and secure. Both mega and large cap stocks are often referred to as "blue chips."
Mid Cap - Ranging from $2 billion to $10 billion, this group of companies is considered to be more volatile than the large and mega-cap companies. Growth stocks represent a significant portion of the mid caps. Some of the companies might not be industry leaders, but they are well on their way to becoming one.
Small Cap - Typically new or relatively young companies, small caps have a market cap between $300 million to $2 billion. Although their track records won't be as lengthy as that of the mid to mega caps, small caps do present the possibility of greater capital appreciation--but at the cost of greater risk.
Micro Cap - Mainly consisting of penny stocks, this category denotes market capitalizations between $50 million to $300 million fall into this category. The upward potential of these companies is similar to the downside potential, so they do not offer the safest investment, and a great deal of research should be done before entering into such a position.
Nano Cap - Companies having market caps below $50 million are nano caps. These companies are the most risky, and the potential for gain is often relatively small. These stocks typically trade on the pink sheets or OTCBB.
So clearly there are a lot of definitions of market cap.
Now to get back to your question (!), is it better to buy a lot of shares of a lower priced stock or a few shares of a higher priced stock when investing? In my opinion, higher
quality stocks are often higher priced! Thus, I would first try to determine whether the stock was the kind of quality I was looking for (using my parameters) and then buy my previously determined dollar amount, and then adjust the number of shares.
I do not think that your goal of looking for a particular price point for your stocks is a good idea...not from my perspective. As a small investor, you might want to check out the
"Sharebuilder" website. I have no affiliation with them, I have never used their services, but I believe that you are able to make relatively small dollar purchases of stocks and purchase fractional shares. I started out investing years ago with Merrill Lynch, even though I am currently utilizing mostly Fidelity and Schwab. At that time, I could buy even $100 of a stock and purchase fractional shares. I would rather see a beginning investor buy fractional shares of a quality company than buy lots of cheaply priced penny stocks.
Finally, back to your question on SIRI. I am a big satellite radio fan, owning an XM radio in my old Jeep. My kids fight over which channel they want to listen to, while me getting to the age where news and commentary are what I enjoy, prefer to flip over to CNBC or CNN...or even Air America. But as an investment, that is, as they say, a "horse of a different color." I am not a big believe, a la Peter Lynch, just because a product is out there, and there is a lot of "hype" about a stock, that you should "chase" it. SIRI
might turn out to be a great investment, and I could be totally wrong about that particular stock, so you should make up your own mind, but it just doesn't fit into my style of stock picks!
What do I mean? Let's briefly go over the usual steps I use when looking at a stock: first, latest quarter. On October 27, 2004 SIRI
posted 3rd quarter results. The company
widened it's loss at $(169.4) million or $(.14)/share from $(106.7) million or $(.11)/share the prior year. Now total revenue DID jump from $4.3 million to $19.1 million. But note, the company lost almost $175 million in order to have $19.1 million in revenue. This isn't my kind of company!
Looking at a
"5-Yr Restated" financials on Morningstar.com, we can see the explosive revenue growth from $1 million in 2002 to $47 million in the trailing twelve months (TTM).
However, I am looking personally for stocks of companies that are profitable. And I would suggest that a novice start with those companies. SIRI has been EXPANDING its losses from $(97) million in 1999, to $(598) million in the trailing twelve months. On a per share basis, this doesn't look as bad because of the DILUTION of shares. DILUTION is a bad sign. That means the company is pouring out (issuing) new shares that dilute ownership.
In fact, SIRI had 24 million shares in 1999, increased in to 76 million in 2002, 827 million in 2003, and 1.2 BILLION shares in the trailing twelve months. Not a good sign imho.
The company continues to spend away cash with $(413) million in free cash flow in 2001, and $(337) million in the TTM. Not very promising!
Balance Sheet? Well, per Morningstar, they have $523 million in cahs and $47.1 million in other current assets, which should be plenty. But they have $165 million in current liabilities that need to be paid, and with their free cash flow of $(337) million, that means they have about another 12 months of operating cash until such time that they will need to borrow money or float some additional dilutive shares.
The whole picture is simply unattractive to me, no matter how much I like the concept of SIRI, no matter how much I think Howard Stern might bring in subscribers, it just is far too speculative for me, and probably isn't the place for a novice to start.
If you do buy some shares, good-luck! It might be a GREAT investment. Just not my style in any case. And I do NOT own any shares, nor do I have any short positions or puts or calls or anything like that. I am just giving you my take on this.
Thanks so much for stopping by! Please feel free to email me back at bobsadviceforstocks@lycos.com if you have any comments or questions...and let me know what you decided to do!
And for all of the rest of you, have a great weekend and feel free also to email me with any thoughts, questions, or comments; I hope that my thinking is helpful in getting you all to think as well! Some of you may even help ME understand stuff :).
Bob
"Trading Transparency" ASKJ
Hello Friends! Thanks so much for stopping by. I haven't been posting much here for a few days, have been busy and haven't been finding that much to like in the midst of this bearish market!
As always, please remember that I am an amateur investor, so PLEASE consult with your professional investment advisors prior to taking any action based on information on this website.
I am going to have to think that latest "rule change" of mine. I sold my EXPO on some bad news, but decided since it wasn't at a loss, I could just replace the stock...Bad idea. I think that we will have to go back to the more conservative idea of only buying a new position on clear selling on good news. The rest just doesn't count.
Anyhow, I was checking my portfolio last night and realized that my ASKJ had passed my (8)% loss level. So I pulled the plug this morning. At the open, I sold my 240 shares of ASKJ at $27.55/share. I had just purchased these shares at $30.10 on 1/14/05, so I had a loss of $(2.55) or (8.5)%. Hmmm.....I will have to learn to SIT on my hands a little better.
Thanks so much for stopping by. I will try to get an answer to a letter up a little later today...and maybe go looking for a stock to discuss!
Bob
Saturday, 15 January 2005
"Looking Back One Year" A review of stock picks from the week of November 24, 2003

Hello Friends! Thanks so much for stopping by and visiting my blog,
Stock Picks Bob's Advice. This is the entry that I like to do to review in a methodical fashion all of the stock picks I have posted on this Weblog. Please remember, like always, that I am an amateur investor. So consult with your professional investment advisor before making any investment decisions based on information on this website! If you have any questions, comments, or words of encouragement, please feel free to email me at bobsadviceforstocks@lycos.com .

The first stock I posted on Stock Picks that particular week was Odyssey Healthcare (ODSY). I
posted Odyssey (ODSY) on November 24, 2003, at a price of $35.94. ODSY closed at $12.11 on 1/14/05, for a loss of $(23.83) or (66.3)%.
On November 1, 2004
ODSY reported 3rd quarter 2004 results. Net patient revenue for the third quarter of 2004 ended September 30, 2004, actually jumped 23.1% to $87.5 million, compared to $71.0 million the prior year. Net income for the quarter was $9.0 million, a 14.7% increase over the $7.8 million the prior year. On a per diluted share basis, this came in at $.24, a 14.3% increase over the $.21 in the same quarter in 2003. Overall, not too bad results.
However, if we look at the ODSY
Point & Figure chart from Stockcharts.com, the graph still looks awful.
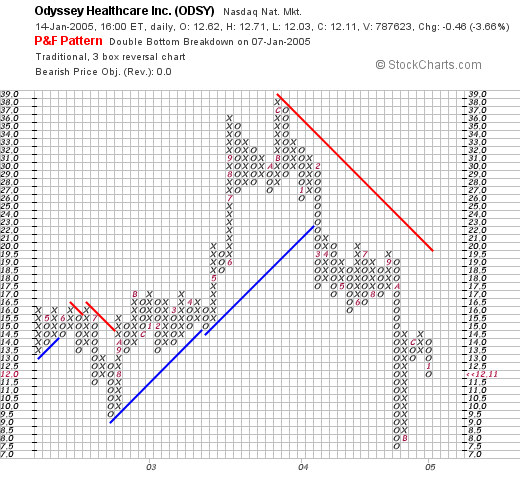
The stock broke down in February, 2004, when it broke through a support level at around $23 and has traded lower since. It actually is significantly off its lows of $7.50 which it reached in October, 2004. I would like to see the stock above $19.50 to feel it might be reversing its downward trend.
 On November 26, 2003, I made the second post of the week and posted H&R Block (HRB) on Stock Picks at a price of $53.41. HRB closed at $47.34 for a loss of $(6.07) or (11.4)%.
On November 23, 2004, HRB reported 2nd quarter results. Revenues for the quarter ended October 31, 2004, came in at $539.3 million a 5.2% drop from the second quarter of 2003. In addition they reported they lost $(52.2) million or $(.32)/share compared to a loss of $(10.4) million or $(.06)/share last year. To top off this dismal report, HRB lowered its expectations for earnings for the year to $3.50 to $4.00/share from $4.00 to $4.25/share previously provided as guidance.
You can imagine how the stock responded! Looking at a Point & Figure on HRB from Stockcharts.com, we can see how the stock seemed to be moving higher from its lows in December, 2002, at around $29.00 to a high of $60 in February, 2004. However it broke through support in October 2004, and has been under the support line since.
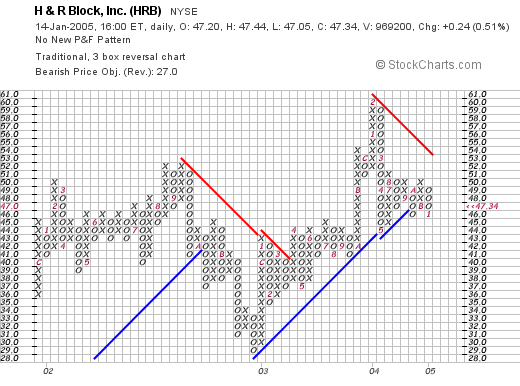
Overall, a fair chart, but not very encouraging to me!
So how did we do? In a word, lousy. The week of November 24, 2003, I picked two stocks on this blog: ODSY which is now down (66.3)% and HRB which is down (11.4)% for an average loss of (38.85)%. So what does this prove? First of all, that this "system" of picking stocks is no less fallible than the next one and that is why you should consult with your advisors! Next, it shows the importance, imho, of NOT letting your losses run, and instead, cutting them short. I use an 8% stop in my trading and I would suggest that every investor have some sort of loss limit when they make a decision to buy a stock.
We have had many outstanding weeks on Stock Picks, but this one I would rather forget!
Thanks so much for stopping by! Please leave your comments right here on the blog or drop me a line at bobsadviceforstocks@lycos.com if you have any questions or comments.
Bob
Posted by bobsadviceforstocks at 10:20 AM CST
|
Post Comment |
Permalink
Updated: Saturday, 15 January 2005 10:23 AM CST
Friday, 14 January 2005
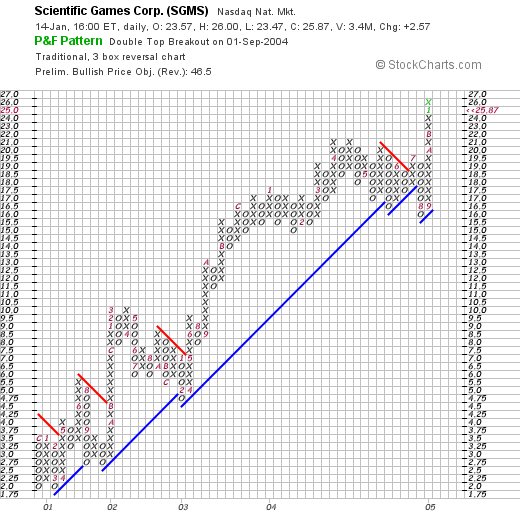
"Revisiting a Stock Pick" Scientific Games (SGMS)
Hello Friends! It is the end of the week and we got a bit of a rally today. The market was getting terribly oversold after multiple down days this year, and it was time to see a few "bargain hunters" jumping in to bid up prices. I will wait and see if there is any follow-through next week; I just don't see the catalyst for a new bull run...but then again, I do not claim to be any kind of expert on predicting the market! In fact, I would like to thank you for visiting my blog,
Stock Picks Bob's Advice. As I like to point out multiple times around here, I am an amateur investor, so please consult with your professional investment advisors prior to making any investment decisions based on information on this website.

After blogging over a year-and-a-half, and making literally hundreds of stock picks, I think I owe it to myself and to my readers to revisit stocks if they are still worthy of being discussed. Recently I started the process of re-posting a stock, if it has been over a year since I originally discussed it, and if it again makes the list of top % gainers, and deserves to be noted! Scientific Games (SGMS) is such a stock!

I first
posted Scientific Games (SGMS) on Stock Picks on September 12, 2003, when it was trading at $11.55/share. To give you some perspective, SGMS closed today at $25.87, up $2.57/share or 11.03% on the day! And to think that even I did NOT ever buy any shares :(.

According to the
Yahoo "Profile" on SGMS, SGMS "...is a provider of services, systems and products to both the instant ticket lottery industry and the pari-mutuel wagering industry based on revenues." What drove the stock higher today was a
report that SGMS and International Game Technology (IGT) have formed a "worldwide, long-term strategic alliance to jointly provide products for the converging gaming market." Clearly, the "street" liked the idea of the alliance of these two gaming 'titans'.

If we look at the latest quarterly result for SGMS, on November 1, 2004, Scientific Games
reported 3rd quarter 2004 results. For the quarter ended September 30, 2004, revenues increased 36% to $179.3 million from $132.1 million reported in the same quarter of 2003. On a diluted basis, net income increased 60% to $.24/share from $.15/share in 2003. These were great results!
How about longer-term? Taking a look at the
"5-Yr Restated" financials on Morningstar, we can see that revenue has grown nicely from $211.1 million in 1999 to $719.7 million in the trailing twelve months (TTM).
Earnings dipped from $.01/share in 1999 to a loss of $(.84)/share in 2000. Since that year, earnings have improved each year to the current $.84/share in the TTM.
Free cash flow, according to Morningstar, has also improved from $55 million in 2001 to $108 millin in the trailing twelve months.
The balance sheet appears adequate, if a bit heavy on long-term debt, with $96.6 million in cash and $164.1 million in other current assets. That is plenty to cover the current liabilities of $129.5 million and to make a bit of a dent in the long-term debt of $566.3 million.
What about "valuation"? To assess this, I like to review the
"Key Statistics" from Yahoo. Here we can see that SGMS is still defined (under $3 billion) as a mid cap stock with a market capitalization of $2.28 Billion. The trailing p/e is moderate at 30.87 with a forward p/e (fye 31-Dec-05) of 23.31. The "5-Yr" PEG is nice at 1.16, and the Price/Sales ratio isn't bad at 2.85 (but not exactly cheap.)
Yahoo reports 88.08 million shares outstanding with 61.80 million of them that float. Of these there are 3.31 million shares out short as of 12/8/04, representing 5.36% of the float, or 3.456 trading days of volume.
Yahoo does not report any cash dividends. The stock last split 2:1 in October, 1993.
What about "technicals"? If we take a look at a
Point & Figure chart from stockcharts.com, we can see an extremely strong stock that has not faltered in any significant fashion since late 2000. In August, 2004, the stock broke through a support level down to $16/share, but has been climbing steadily since. This chart looks nice to me!
So what do I think? Well, I wish I HAD bought some shares back in 2003. Quite frankly, the stock almost looks stronger than ASKJ which I DID buy some shares...hmmm. Anyhow, the move today is nice, the latest quarter was impressive, the alliance with IGT is convincing, the free cash flow is great, the balance sheet is solid, and the chart looks super. What else can I say. Now if I hadn't bought that ASKJ so quickly....lol. You all have a great weekend!
Thanks again for stopping by! If you have any questions, comments, or words of encouragement, please feel free to email me at bobsadviceforstocks@lycos.com .
Bob
"Trading Transparency" ASKJ
Well, about 15 seconds after I posted that last post on ASKJ, I decided I convinced myself and purchased 240 shares at $30.07 in my trading account. Hopefully, the bear market doesn't return and gobble up my principle, so I will be watching this one closely! Thanks again for stopping by.
Bob
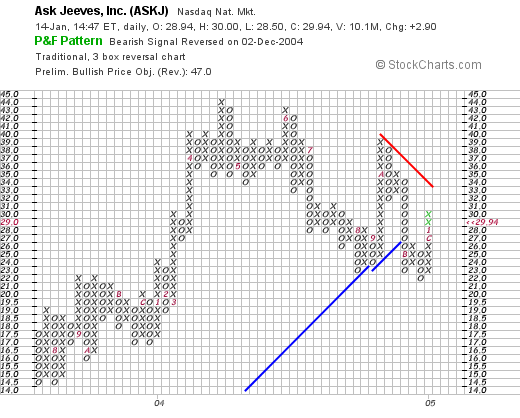
January 14, 2005 Ask Jeeves (ASKJ)
Hello Friends! Thanks again for stopping by and visiting my blog,
Stock Picks Bob's Advice. As I always like to remind you, please remember that I am an amateur investor, so please consult with your professional investment advisors to make sure that all investments discussed are appropriate, timely, and likely to be profitable for you, prior to making any investment decisions based on information on this website. As always, please feel free to email me at bobsadviceforstocks@lycos.com if you have any comments, questions, or words of encouragement.

Looking through the
list of top % gainers on the NASDAQ, I came across Ask Jeeves (ASKJ), the internet company responsible for the search engine of the same name. ASKJ, as I write, is trading at $29.59, up $2.55 or 9.43%. Prior to the opening today, Piper Jaffray
upgraded the stock from "market perform" to "outperform". This apparently was enough to lift the stock price in an already strong market today.

According to the
Yahoo "Profile", ASKJ "...operates four websites dedicated to search: Ask.com, Ask.co.uk,. Teoma.com, and AJKids.com." Also "Ask Jeeves also delivers or syndicates its search technology and advertising products to approximately 41 third-party Websites as of December 31, 2003."

Looking for the latest quarterly report, I found that
ASKJ reported 3rd quarter 2004 results on October 27, 2004. For the quarter ended September 30, 2004, revenue came in at $75.7 million, a 178% increase over revenues of $27.2 million the prior year.
Using GAAP (Generally Accepted Accounting Practices) income from continuing operations came in at $10.7 million or $.15/share, up from $3.8 million or $.07/share the prior year.

How about longer-term? Taking a look at the
"5-Yr Restated" financials on Morningstar.com, we can see that revenue HAS been a bit erratic, increasing from $22.0 million in 1999 to $95.7 million in 2000, dropping to $65.0 million in 2002, but then steadily increasing to $207.1 million in the trailing twelve months (TTM).
Earnings dropped from a loss of $(5.51)/share in 2000 to $(11.48)/share in 2001, however, they have improved steadily since then and ASKJ reported a profit of $.67/share in the trailing twelve months.
Free cash flow which WAS negative at $(33) million in 2001 and $(44) million in 2002, turned positive at $20 million in 2003 and $41 million in the TTM.
The balance sheet appears solid. ASKJ has $89.5 million in cash, enough to pay off the $48.3 million in current liabilities, and to pay off a big part of the $1115.9 million in long-term debt. In addition ASKJ has $44.7 million in other current assets.

What about "valuation"? Taking a look at
"Key Statistics" on ASKJ from Yahoo, we can see that this is a mid-cap stock with a market cap of $1.74 billion. The trailing p/e is 43.88, and the forward p/e (fye 31-Dec-05) is nicer at 21.65. The "5-Yr restated" PEG is only 0.86. Price/sales is a bit rich at 7.61.
Yahoo reports 58.25 million shares outstanding with 54.30 million of them that float. Currently there are 6.44 million shares out short as of 12/8/04. This represents 11.87% of the float, but only 1.505 days of trading volume. Yahoo reports no cash dividend and no stock splits!
What about "technicals"? If we take a look at the
Point & Figure Chart for ASKJ on Stockcharts, we can see that the stock was moving ahead nicely through 2003 and much of 2004, until breaking through a support level at around $27 in late 2004. The stock does appear to be pushing higher, but it would be nice to see it break through around $32 before feeling like the bullish trend has been re-established.
 So what do I think? Well the stock is moving higher on a brokerage house upgrade...the latest quarter was quite strong, the last several (if not the last 5) years have been strong, free cash flow is moving positive, the balance sheet is solid, and valuation isn't bad with a 5-Yr PEG under 1.0. It really doesn't look bad to me and I just might add it to the "Trading Portfolio". I haven't made up my mind, now with the EXPO sale, I can feel that nickel "burning a hole in my pants pocket."
Thanks again for stopping by! I hope that my discussions are helpful for you. I know they help me think clearly about stocks and determine why or why not I want to own them!
Bob
Posted by bobsadviceforstocks at 1:53 PM CST
|
Post Comment |
Permalink
Updated: Friday, 14 January 2005 2:00 PM CST
"Trading Transparency" EXPO
Hello Friends! Thanks so much for stopping by and visiting my blog,
Stock Picks Bob's Advice. As always, remember I am an amateur investor, so please consult with your professional investment advisors prior to making any decisions based on information on this website!
I was looking through my
"Trading Portfolio" earlier today and noted that my stock in Exponent (EXPO) had a sharp drop in an otherwise strong market. In fact, as I write, EXPO is trading at $25.90, down $3.19 or 10.97%. Now, since I had already sold a portion of my holdings at a 30% gain, and the EXPO stock was still selling at about a 30% gain, this was not a sell signal by price alone. However, I was determined to get to the bottom of the price drop!
Yesterday, after the close of trading, EXPO
announced preliminary 4th quarter results and 2005 guidance. They announced that the fourth quarter would come in under previous guidance due to some delays in anticipated contracts and that the 1st half of 2005 also would come in a little slower than expected. This is not the kind of news I like to hear!
I purchased these 150 shares on October 21, 2003, so it has been more than a year that I have held on to them. In fact, they were purchased with a cost basis of $19.77/share. Thus, at the current price of $25.90, I have a gain of $6.13/share or 31%.
Thus, I have a new "rule" for trading. If I sell a stock in my portfolio "pre-emptively", that is on the announcement of bad news affecting fundamentals, then as long as I have a gain of significance, then I can replace that stock with another purchase! (You know how those nickels burn a hole in my pocket.)
So I am out of Expo and am now looking for a new position to replace it. I will keep you posted. Meanwhile, if you have any questions, comments, or words of encouragement, please feel free to email me at bobsadviceforstocks@lycos.com .
Bob
Thursday, 13 January 2005
"Revisiting a Stock Pick" Ventana Medical Systems (VMSI)

Hello Friends! Thank you for stopping by and visiting my blog,
Stock Picks Bob's Advice. It has definitely been a "bearish" January. Hopefully, it will turn out to be more of a "Yogi Bear" market than one of those mean growling kind of mauling bear markets. I will vote for Yogi, one of my favorite bears growing up. As always, please remember that I am an amateur investor. (Now what KIND of professional investment advisor would run a picture of Yogi Bear in the midst of a stock decline, anyhow?). So if you like what you read here, please go ahead and consult with your professional investment advisors prior to making any investment decisions to make sure that such decisions are appropriate, timely, and likely to be profitable for you! If you have any questions or comments, please feel free to email me at bobsadviceforstocks@lycos.com.

On December 23, 2003, I
posted Ventana (VMSI) on Stock Picks at $39.80. In fact, I like Ventana so much, that I ended up buying some shares for my
"Current Trading Portfolio" and I still do own 150 shares in that account.
Looking through the
list of top % gainers on the NASDAQ today, I saw that VMSI had made the list. As I write, VMSI is trading at $64.36, up $4.54 or 7.59% on the day. Since it has been over a year since I have examined this stock on the blog, I thought it was a good idea to review a stock that I have already "picked" and is doing well enough to make the top % gainers list today!
Taking a look at the
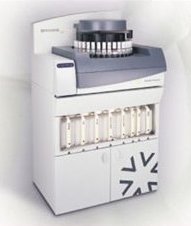
Yahoo "Profile" on VMSI, we find that Ventana "...develops, manufactures and markets instrument-reagent systems that automate slide staining in anatomical pathology and drug discover laboratories worldwide."
And what was it that drove the stock higher today? Earlier this morning, VMSI
announced that things were going to be doing "better" than what the street was expecting. In other words, they 'raised guidance.' They raised guidance for both the final quarter in 2004 as well as the 2005 outlook. In my mind, I can see about a million analysts out there doing the calculations of future earnings and revenue growth and recalculating what a proper value of the stock is today. And they did exactly that, driving the stock higher.
And what about the latest quarter that has already been reported? On October 23, 2004, VMSI
announced 3rd quarter 2004 results. For the quarter ended September 30, 2004, sales came in at $39.3 million, a 23% increase over the same quarter in the 2003 fiscal year. GAAP net income for the quarter was $4.1 million or $.23/diluted share, up from $3.3 million, or $.19/diluted share the prior year. These were solid results. The company at THAT time raised guidance for 2004, and confirmed guidance for 2005. The repeated raising of guidance is bullish (and not Yogi-bearish) indeed.

How about longer-term? If we take a look at the
"5-Yr Restated" financials on Morningstar, we can see that revenue growth has been superb, increasing from $69.4 million in 1999 to $155.8 million in the trailing twelve months (TTM).
Earnings, which dropped from $.88/share in 1999 to a loss of $(1.85)/share in 2000, have increased steadily since then to $.59/share in the trailing twelve months (TTM). Free cash flow, which was a negative $(29) million in 2001, has also been improving, and Morningstar records $15 million in the trailing twelve months (TTM).
The balance sheet is gorgeous, with $40.6 million in cash reported per Morningstar, with $32.8 million in current assets, and just $2.0 million in long-term liabilities. Amounts that are easily covered with just the available cash! In addition, Morningstar reports Ventana with $45.7 million of additional current assets.
How about "valuation"? Looking at
Yahoo "Key Statistics" on VMSI, we can see that this company is a mid-cap stock with a market capitalization of $1.12 billion. The trailing p/e is very rich at 109.61, with a forward p/e of 43.99. Thus, even with a great growth in earnings, we have a 5-yr PEG per Yahoo of 2.25. Price/sales is also rich at 6.67.
Yahoo reports 17.38 million shares outstanding with 15.30 million that float. Of these, as of 12/8/04, there were 1.63 million shares out short. This represents 10.67% of the float (!), and 17.01 trading days of average volume. Today's steep spike in the stock price may very well represent a short "squeeze" and traders hustle to cover their borrowed shares sold short. Just a possibility (?)
No stock dividend and no stock split reported on Yahoo.
How about "technicals"? If we take a look at a
"Point & Figure" chart on VMSI from Stockcharts:
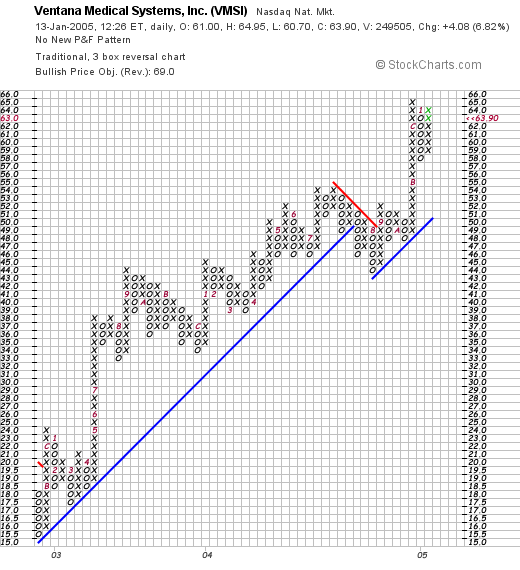
we can see a very strong price chart for Ventana from late 2002, when the stock was trading around $15/share, to the latest trades of around $64. Except for a short period of weakness in August, 2004, this stock has literally roared ahead!
So what do I think? Well I do own some shares of this stock, so please take that into consideration. I love the latest earnings guidance for 2005, the latest quarterly report was wonderful, the Morningstar analysis looks good, but the only thing holding me back a little is the "value hat" I try to wear as well, and the stock looks a bit pricey (I mean with a p/e over 100!). So let the buyer beware!
Thanks again for stopping by! If you have any questions or comments, please feel free to leave them right here or email me at bobsadviceforstocks@lycos.com .
Bob
Tuesday, 11 January 2005
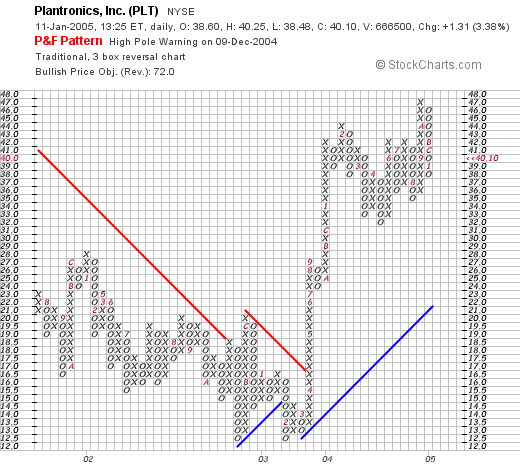
January 11, 2005 Plantronics (PLT)
Hello Friends! Thanks so much for stopping by and visiting my blog,
Stock Picks Bob's Advice. As always, please remember that I am an amateur investor, so please consult with your professional investment advisors prior to making any investment decisions based on information on this website.

Looking through the
list of top % gainers on the NYSE today, I came across Plantronics (PLT) which, as I write, is trading at $40.05, up $1.26 or 3.25% on the day. I do not own any shares nor any options on this stock!

It is another DOWN day in the market, at least thus far, and I have enclosed the only "funny" headset picture I could find on the net! I hope it brings a smile to you!
According to the
Yahoo "Profile", PLT "...is a worldwide designer, manufacturer and marketer of lightweight communications headsets for phones and cellphones, telephone headset systems, accessories and related services for business and personal use."
On October 19, 2004, PLT
reported 2nd quarter 2005 results. Revenues for the quarter increased 37% to $130.2 million up from $95.1 million in the same quarter for fiscal year 2004.
Diluted eps came in at $.49/share, up from $.27/share the prior year. The company also gave fairly bullish guidance for the 3rd quarter 2005 that is upcoming and due to be reported shortly.
How about longer-term? Taking a look at the
"5-Yr Restated" financials on Morningstar, we can see that revenue has grown, a little inconsistently, from $315 million in 2000 to $490.7 million in the trailing twelve months. Earnings were also a bit erratic, dropping from $1.22 in 2000 to $.74/share in 2002, but then steadily increasing to the $1.72/share in the trailing twelve months (TTM).
(This is a real Plantronics headset!)
Free cash flow, as reported on Morningstar, has also been fairly solid with $55 million in 2002, and $54 million in the trailing twelve months.
The balance sheet, per Morningstar is really quite impeccable. PLT has $214.3 million in cash, enough to cover BOTH the current liabilities of $74.0 million, AND the long-term liabilities of $8.1 million, almost three times over. In addition, Morningstar reports that they have an additional $158.6 million of other current assets.

How about "valuation" issues? Looking at
"Key Statistics" from Yahoo, we can see that this is a mid-cap stock with a market cap of $1.94 billion. The trailing p/e is moderate at 23.33, the forward p/e (fye 3-Apr-06) is better at 19.66. The PEG (5 yr expected) is nice at 1.31.
Yahoo reports 48.37 million shares outstanding, with 47.70 million of them that float. Currently there is a smallish 820,000 shares out short as of 12/8/04, representing 1.72% of the float or 1.934 trading days. This doesn't look like an issue to me.
In addition, the company DOES pay a small dividend of $.20/share yielding 0.52%. The last stock split was a 3:1 split, per Yahoo, in August, 2000.
How about "technicals"? Taking a look at a
PLT Point & Figure chart from Stockcharts, we can see that this stock was actually trading lower, from late 2001 through March, 2003. The stock broke through resistance in mid-April 2003, and has been trading higher since. The stock looks strong technically to me!
 (speaking of headsets, wasn't Ray Walston's "martian headgear" about as tops as you can get?)So seriously, what do I think? Well, this stock actually looks pretty nice to me. Let's review, it is strong today in an otherwise weak market, the last quarter results were quite good, and the last few years have been strong (although not consistently over the last 5). They pay a dividend! They are generating free cash flow and their balance sheet is superb. Valuation-wise it also doesn't look bad and the chart is very pretty imho.
So if I had some cash to spend, would I be buying? Well, this does fit my criteria, so it would probably be a buy!
Thanks again for stopping by. If you have any comments, questions, or words of encouragement, please feel free to email me at bobsadviceforstocks@lycos.com. Please excuse my extra photos, I have just been so disappointed with the market tone, that I needed just a little levity. (not levitation, I will leave that to Bewitched.)
Bob
Newer | Latest | Older


