Stock Picks Bob's Advice
Friday, 25 March 2005
March 25, 2005 Aladdin Knowledge Systems (ALDN)
Hello Friends! Thanks so much for stopping by and visiting my blog,
Stock Picks Bob's Advice. As always, please remember that I am an amateur investor, so please consult with your professional investment advisors prior to making any investment decisions based on information on this website!
The markets are closed today since it is Good Friday, and I certainly wish all of my friends who celebrate Easter, a very Happy Easter!
For those of you who are new to this website, I like to look through stocks that are moving higher on any particular day, and see if there are any that might be worthy of consideration for addition into a portfolio. I use a few screens to assess the stocks and write up my findings. Of these many stocks, I do pick stocks to add to my own trading portfolio, and try to keep you posted when I do that. However, my timing of adding additional positions is based on the "bullish" activity within my own holdings. That is, I add a position, when I sell a portion of a holding at a targeted gain level. Otherwise, I try my hardest to just "sit on my hands". But I am still looking and thinking about new stocks virtually every day!

One of the first places I like to go when I start exploring for a new stock idea, is the
list of top % gainers on the NASDAQ. Yesterday (3/24/05), Aladdin Knowledge Systems LTD (ALDN), made the list, and closed at $23.26, up $1.81 on the day or 8.44%. I do NOT own any shares nor do I have any options on this company.

According to the
Yahoo "Profile" on ALDN, Aladdin "...is active in the digital security market, providing solutions for Software Digital Rights Management and Enterprise Security."
In my methodical fashion, I next check the latest earnings report...looking for positive revenue and positive earnings growth. On January 24, 2005,
Aladdin reported 4th quarter 2004 results. Revenues for the fourth quarter ended December 31, 2004, increased 24.7% to $18.8 million from $15.1 million for the same period the prior year. Net income for the fourth quarter jumped 121% to $2.6 million or $.20/diluted share up from $1.2 million or $.10/diluted share the prior year. These, imho, were very strong results!

O.K., they had a great quarter. But from my perspective it is the
persistence of these results that makes a great stock investment! For this consistency in performance, I like to review a longer-term assessment by looking at Morningstar. Within this website, are the "financials" and in particular the "5-Yr Restated" financials that I find personally so helpful. For ALDN, they are located
here.
First thing, looking at the series of bar graphs, we can see a nice 'ramp-up' of revenue growth from $44.3 million in 2000 the $54.7 million in the trailing twelve months.
Earnings have been a bit more erratic dropping from $.12/share in 2000 to a loss of $(1.32)/share in 2001, but has improved steadily since then, with the latest quarter showing a very strong result.
Next, free cash flow. Why do I think this is important? If you all were investing during the "dot-com" era, then you will recall all of the many start-ups that came to market without any real revenues and without any real earnings. In fact, they often talked about the "burn-rate" of these companies. What they were referring to, as I understand it, was the fact that these new ventures were consuming their cash, sort of burning it up, and had to start earning money before running out of their start-up money.

On the Morningstar section on the same page, we can see that ALDN had
negative free cash flow in 2001 at $(6) million. Howver, this has improved and is up to $5 million in the trailing twelve months (TTM).
Next, what about the balance sheet? From this, we can sort of get a financial 'check-up' on the company. That is, the more cash and assets a company has and the less the liabilities, well it is sort of obvious! Anyhow, ALDN has, according to Morningstar, $19.5 million in cash, which by itself is able to pay off both the current liabilities of $11.3 million and the $3.2 million of long-term liabilities combined. In addition, Morningsar shows that ALDN has $18.5 million of
other current assets. The financial health of this company looks just fine, thank you.
What do I check next? I like to get a handle on some "valuation" questions. I am not purely a momentum investor, a value investor, or a technician. I like to use a combination of everything :) to get a handle on a stock!
I have found the easiest place to find some value parameters is on Yahoo. In fact, for ALDN, the
Yahoo "Key Statistics" are quite helpful.
First, we can see that this is a very small company in the great big picture of things with a market capitalization of $266.98 million. This figure is determined by multiplying the price per share by the number of shares...sort of what it would cost to buy the whole company at the current price...
The trailing p/e is moderately high at 34.41. The forward p/e (based on fye 31-Dec-06 estimates) is nicer at 20.58. Thus, the PEG, which is a number telling us something about how the P/E relates to the growth rate, is at 1.00, saying it is, imho, reasonably valued.
Price/sales is a bit richer at 3.56.
Yahoo shows that there are only 11.48 million shares outstanding with 6.40 million that float. Of these, 351,000 shares are out "short" as of 2/8/05. This amounts to 5.48% of the float or 1.664 trading days of volume. From my perspective, this is not a very high level of short shares. (Short shares are shares that have been pre-sold by speculators betting that the stock will decline. Thus a high level of short sales means that there are a lot of shares that need to be purchased to cover these pre-sold shares as investors close out these trades. This pent-up demand for shares actually is bullish for a stock!)
Yahoo shows no cash dividend and the last stock split was a 3:2 on September 18, 1995. Almost ten years ago!
How about some technical issues? If you are a novice, that simply means, how does the chart look? Is the stock price climbing, declining, or doing something else? Do trends determine future price moves? I don't think so, but they can tell you something about whether people are tending to be accumulating a stock and buyers are willing to pay higher prices over time, or if the opposite is true.
Recently, I have found that "point & figure" charts are very helpful. They show columns of o's and x's which represent declining stock prices (o's) or climbing stock prices (x's). From my perspective, they give a nice "feel" for the stock price activity.
The
Stockcharts.com "point and figure" chart on ALDN shows a very strong price appreciation.
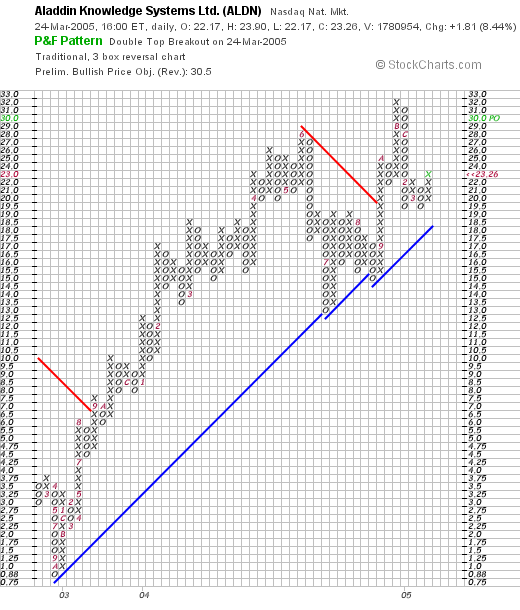
This stock bottomed out around $.88/share in October, 2003, and has been climbing since to the $23.26 level where it closed yesterday (3/24/05). The stock has consistently been trading higher than its "support" line represented by the blue 45 degree line that moves higher.
So what do I think? I actually like this stock a lot! The stock moved higher yesterday on an upgrade, the latest quarter was solid, the last few years have shown steady improvement of revenue, but a bit erratic on the earnings picture. Free cash flow is positive and growing, the balance sheet is gorgeous, valuation is reasonable and the chart looks very strong! Now, if I just had some cash, or at least a buy signal from my portfolio, I might be purchasing some shares :).
Thanks so much for stopping by and visiting. If you have any questions or comments, please feel free to email me at bobsadviceforstocks@lycos.com.
Bob
A Reader Writes "...serious hits from investing in a large company?"

Hello Friends! Thanks so much for stopping by and visiting my blog,
Stock Picks Bob's Advice. Wishing all of my friends who are celebrating Easter, a very Happy Easter! This great
rabbit drawing is my seasonal attempt :).
As always, please remember that I am an amateur investor so please consult with your professional investment advisors prior to making any investment decisions based on information on this website!
Checking through the electronic mailbox, I had a nice note from Jeremy who wrote:
Hey Bob,
I'm new to the whole stock market game and have no money invested
outside of my IRA. However, from what I've been reading it seems like
Forest Laboratoies is posed to take off. An established company with
high cash flow and low liabilities.... My question is if you've seen
people take serious hits from investing in a large company like this?
I realize that the market is volatile and of course I could deal with
the price dropping if I invested in it. But have you ever seen the
bottom drop out of such an established company? I'm not actually
going to buy any of this stock, but I'm trying to learn as much as I
can before I do start. Thanks for your time.
Jeremy
Well first Jeremy, you are welcome here anytime and thank you for writing. First of all, is Forest Labs "poised to take off"? I really don't know. I agree with you that low liabilities and great cash flow and earnings growth are probably good indicators of the potential for future price appreciation. Anyhow, those are some of the factors I like to assess prior to making any investments or listing any stocks here.
Have I ever seen people take serious hits from investing in a large company like this? Well, do you remember ENRON??? Any company can implode unfortunately. It is the sad truth that one cannot trust any company completely. Therefore, I believe that when one invests, one should spread one's risk in a basket of stocks. For me, my goal is 25 different companies. Also, it is important to have some sell points on your investments, in case the stock you pick DOES start to decline, you don't have to feel cemented to that position!
I like to use an 8% stop on my losses, that is, if a stock declines 8% from my purchase price, REGARDLESS of how long I have held it, I sell the stock. That prevents you from losing too much money. Stocks however, do not always move lower in a linear fashion, unfortunately. Often on bad news, one can actually GAP to a lower price. That is, the stock can close at one price, and then open many points lower without actually trading at any of the intervening price levels. When that happens, you are indeed out of luck. Again, if it is in my own portfolio, I will sell if I find a stock at or lower to my sell point on the downside.
In practice, I don't see too many stocks that do implode like that. Thus, when you do your homework, imho, you probably are limiting your exposure to risk. Just by making sure that a company has real revenue and real earnings, you are already reducing that risk!
Good luck in your introduction to the whole "stock market game". Let me know if I may be of further assistance in helping you understand my own perspective. If you have any additional questions, or if anyone else does, please feel free to email me at bobsadviceforstocks@lycos.com.
Bob
Wednesday, 23 March 2005
"Revisiting a Stock Pick" Forest Laboratories (FRX)
Hello Friends! Thanks so much for stopping by and visiting my blog,
Stock Picks Bob's Advice. As always, please remember that I am an amateur investor, so please consult with your professional investment advisors prior to making any investment decisions based on information on this website.

Scanning for stocks today, I did my usual routine: first, scanning through the
list of top % gainers on the NYSE, I came across Forest Laboratories (FRX), which closed at $37.90, up $1.15 or 3.13% on the day.

I actually had the opportunity of
posting FRX on Stock Picks on 6/20/03 when it was actually trading higher at $54.99. I do not own any shares of FRX nor do I own any options.
According to the
Yahoo "Profile" for Forest Laboratories, FRX and its subsidiaries "...develop, manufacture and sell ethical drug products, which require a physician's prescription, as well as non-prescription pharmaceutical products sold over-the-counter (OTC)."
So what about the latest quarter? On January 18, 2005, FRX
reported 3rd quarter 2005 results. Net sales for the quarter ended December 31, 2004, came in at $795 million, up 14% from $700 million last year for the same quarter. Net income for the quarter rose 15% to $260.8 million, from $226.1 million the prior year same quarter. On a diluted earnings per share basis this ammounted to a 17% increase to $.70/share in the current quarter compared with $.60 in last year's third quarter.

And what about "longer-term"? As always, I like to review the Morningstar.com results for the "5-Yr Restated" financials. Looking at the
Morningstar 5-Yr results on FRX, we can see that revenue has grown steadily from $.9 billion in 2000 to $3.2 billion in the trailing twelve months (TTM).
Morningstar.com shows earnings growing very steadily from $.32/share in 2000 to $2.47 in the trailing twelve months.
Free cash flow is also very pretty with $390 million in 2002, growing to $919 million (almost $1 billion) in free cash flow in the TTM.
The balance sheet on Morningstar.com is impressive with $1.8 billion in cash and $1.05 billion in other current assets balanced against $512.7 million in current liabilities and only $1.5 million in long-term liabilities. This is a very pretty picture!
How about "valuation" questions? Looking at
"Key Statistics" from Yahoo on FRX, we can see that this is a large cap stock with a market capitalization of $13.32 billion. The trailing p/e is downright reasonable at 15.30, with a forward p/e (fye 31-Mar-06) of 14.58. Thus, the PEG is nice at 0.88 (under 1.0), and the Price/Sales, not quite as reasonable at 3.99.
Yahoo shows that there are 351.38 million shares outstanding with 345 million that float. There are 7.24 million shares out short as of 3/8/05, representing 2.10% of the float or 3.856 trading days. If we use my arbitrary 3 day rule, then this appears a little more than insignificant.
There are no cash dividends paid, and the last stock split was 1/9/03 when a 2:1 split was declared.
What about "technicals"? This stock is actually
below the selection price of 6/20/03! Looking at a
"Point and Figure" chart for FRX from Stockcharts.com, we can see what looks very weak to me! The stock peaked at $78/share in February, 2004, then has slipped steadily to the current $37 level.
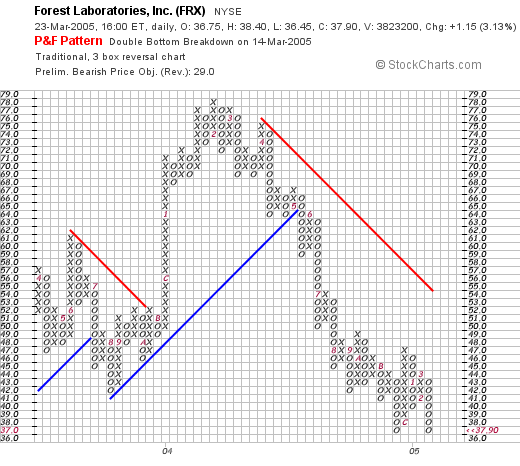
I would actually like to see this stock move higher, at least above $47, and preferably above $55 to demonstrate strength technically before committing new funds.
So what do I think? Well, the latest quarter was solid, the last five years have been also very steady with growth in both revenue and earnings. The free cash flow is beautiful, with FRX spinning off $1 billion in free cash per year. The balance sheet is gorgeous. The valuation measures are reasonable with a low p/e and a PEG under 1.0, but the chart looks awful :(.
Not exactly a great momentum play imho, but with those numbers, this could turn out to be a great buying opportunity (?).
Anyhow, I wanted to revisit this stock for you! Thanks again for stopping by and be sure to drop me a line if you have any comments, questions, or words of encouragement, at bobsadviceforstocks@lycos.com.
Bob
Sunday, 20 March 2005
A Reader Writes "What do you think of AVO"?

Hello Friends! Thanks so much for stopping by and visiting my blog,
Stock Picks Bob's Advice. (The photo at the left is from the
(LAIS),Institute of Latin American Studies at Stockholm University...but could just as well be from my backyard in Wisconsin!)
As I do all the time, I would like to remind you that I am an amateur investor, so please consult with your professional investment advisors prior to making any investment decisions based on information on this website.
I thought I would be taking a day off here, but checking for messages, I found a note from a reader who writes:
Bob, what are your thoughts on AVO? Thanks in advance,
Kevin
Advanced Medical Optics (AVO) is certainly an interesting idea Kevin, so let me take a look at it. Remember, this is another "top-down" assessment, and my "strategy" is to let stocks sort of come to me instead of the other way around!
I do not own any shares nor do I have any options in AVO.

On March 18, 2005, AVO closed at $37.75, up $.42 or 1.13% on the day. On February 8, 2005, AVO
announced 4th quarter 2004 results. Net earnings for the quarter came in at $10.1 million or $.26/diluted share, down from $9.7 million or $.28/diluted share the prior year. Clearly, they are earning more money but making less/share due to dilution. That doesn't really fit into my "philosophy".
For the full year, they had a loss of $(129.4) million or $(3.89)/share, compared with net earnings of $10.4 million or $.35/share the prior year. Again, I prefer to see stocks making profits and not losing money.
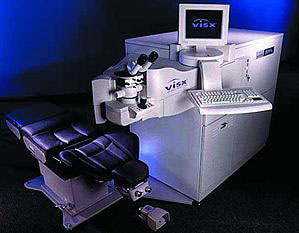
However, that doesn't mean the company might not be a GREAT investment. They spent quite a bit of money on purchasing Pfizer's "Tecnis" and "Sensar" lenses, which are intraocular lenses for use in conjunction with cataract surgery. They are also finalizing the acquisition of VISX, a leading excimer laser refractive surgery company, which might turn out to be a terrific deal. It is just that I have these guidelines when I pick stocks and this one just doesn't fit.

What about Morningstar.com? If we take a look at the
"5-Yr Restated" financials, we can see a relatively short timeline for AVO since it was recently spun off from Allergan.
AVO does show increasing revenue, after a slight dip to $538 million in 2002, increasing to $684.4 million in the trailing twelve months (TTM).
As noted above, the stock did turn to a loss in the past year with $(3.89)/share reported. Free cash flow has remained positive, with $29 million reported in the last twelve month period noted on Morningstar.
The balance sheet isn't terrible with current assets adding up to $341 million vs. $167.8 million in current liabilities. However, they do have a fairly significant $619.9 million in long-term debt to deal with.
What about "valuation"? From
Yahoo "Key Statistics" on AVO, we can see that this is a larger mid-cap stock with a market cap of $1.40 Billion. AVO has 37.18 million shares outstanidng with 36.90 million of them that float. As of 2/8/05 there were 6.95 million shares out short representing a fairly significant 18.82% of the float or 8.114 trading days of volume. Clearly there are a lot of investors betting against this stock, and with any good news, we could see a bit of a squeeze imho.
No cash dividends and no stock dividends are reported on Yahoo.
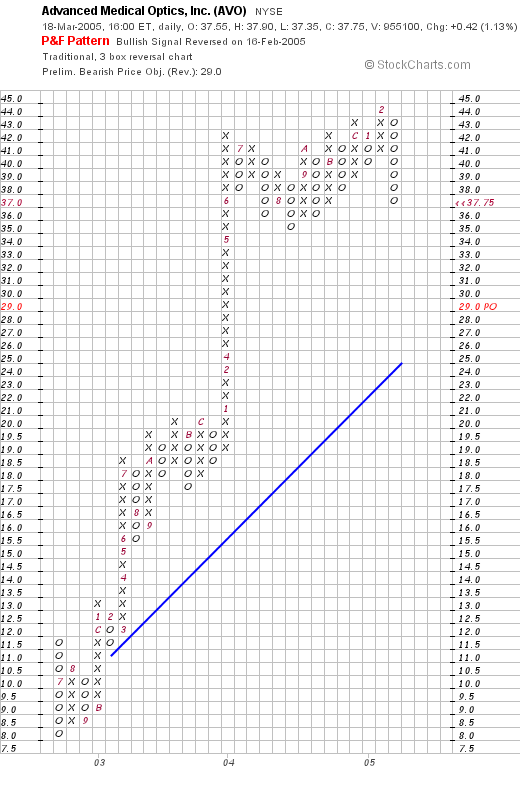
How about "technicals"? Reviewing a
"Point & Figure" chart from Stockcharts.com, we can see that this stock has been on a 'tear', with incredible strength since bottoming at $8.00 in July, 2002, and climbing steadily to its current level of around $37.75. It appears, if anything, to be a bit over-extended trading high above its support level (the blue line), but I certainly would hesitate to go against a chart like this!
So what do I think? Well it might be a terrific investment, that is, the stock might just keep on climbing, but it doesn't quite fit into my strategy with the recent losses which are apparently due to acquisitions.
While not opposed to acquisitions, my strategy is to look for steadily increasing revenue and earnings growth. I have one eye stock in my own portfolio, Cooper (COO), that has done well for me. That company is about "old technology" that is contact lenses mainly, as opposed to the "new technology" of excimer laser vision correction. I cannot argue against the potential of this company which does appear to be good, but just that my own perspective would keep me from recommending it!
I sure hope that was helpful for you! Thanks again for taking the time to write and participate in this blog. If you or anyone else has any questions, I will try to get to them and respond at bobsadviceforstocks@lycos.com.
Bob
Saturday, 19 March 2005
"Looking Back One Year" A review of stock picks from the week of February 3, 2004

Hello Friends! Thanks so much for stopping by and visiting my blog,
Stock Picks Bob's Advice. As always, please remember that I am an amateur investor so please consult with your professional investment advisors prior to making any investment decisions based on information on this website.
It is the weekend! And one of the things I like to do around here is to go back about a year and see how stock picks during that particular week have done since that time. Of course, this review assumes a buy and hold technique, when in reality, I utilize a system of limiting losses by selling them quickly at 8% loss limits, and then selling my winners slowly at designated gain targets. That being said, I feel it is still informative to see how stocks I picked have done since the time of their selection.

On February 4, 2004, I
picked American Dental Products (ADPI) for Stock Picks at a price of $13.00. ADPI closed at $22.98 on 3/18/05, for a gain of $9.98 or 76.8%.

On February 23, 2005, ADPI
announced 4th quarter 2004 results. For the quarter ended December 31, 2004, net revenue was $44.8 million, up 7% from $42 million last year. Net earnings were $2.1 million, up 18% from $1.8 million last year. Diluted net earnings per share came in at $.26/share, up 8% from $.24/share last year.

On February 4, 2004, I
selected Hain Celestial Group (HAIN) for Stock Picks at $22.55/share. HAIN closed at $18.20/share, down $(4.35) or (19.3)% since selection.

On February 3, 2005,
HAIN reported 2nd quarter 2005 results. Sales for the quarter ended December 31, 2004, increased nicely by 19% to $169.8 million from $142.8 million in the same quarter the prior year. However, GAAP net income was fairly flat at $10.7 million up from $10.4 million the prior year. On a per share diluted basis this came at $.29/share unchanged from last year's $.29/share.

On February 4, 2004, I
selected Avon Products (AVP) for Stock Picks at $68.29/share. AVP had a 2:1 stock split on 6/1/04, for an effective stock pick price of $34.15. AVP closed at $40.41 on 3/18/05 for a gain of $6.26 or 18.3%.
On February 1, 2005, AVP
reported 4th quarter 2004 results. For the quarter, adjusted for currency exchange rates, sales grew 7%. Net income for the quarter grew to $288.8 million or $.61/share, up from $261.3 million, or $.55/share.

On February 5, 2004, I
picked Claire's Stores (CLE) on Stock Picks at $20.30. CLE closed at $22.68 on 3/18/05 for a gain of $2.38 or 11.7%.
On March 10, 2005, CLE
reported 4th quarter 2004 results. Sales increased 9% to $395.9 million from $364 million on a same-store sales growth of 5%. Net income rose to $55.5 millilon from $52 million or $.56/share from $.53/share a yealr ago. As good as this result was, the company warned that comparisons will be more difficult in 2005.
Finally, on February 6, 2004, I
picked Starcraft (STCR) for Stock Picks at a price of $17.50. STCR was acquired by Quantum (QTWW) in an acquisition that was complete by 3/3/05. STCR stock holders received 2.341 shares of Quantum (QTWW) for each share of Starcraft. QTWW closed at $4.89 on 3/18/05. Thus, based on the current price of QTWW, we have a resultant value of $11.45/share on this stock. This represents a loss of $(6.05) or (34.6)%.
On March 9, 2005, QTWW
announced 3rd quarter 2005 results. Revenue for the quarter came in at $5.4 million with a loss of $(2.9) million or $(.09)/share. Revenue is up from last year's $4.4 million and a loss of $(3.1) million or $(.10)/share as well.
So how did I do with these picks? I had two losing issues (HAIN and STCR), and three gainers for an average gain of 10.58%.
Thanks again for stopping by! If you have any questions or comments, please feel free to email me at bobsadviceforstocks@lyco.com.
Bob
Friday, 18 March 2005
A Reader Writes: "What do you think of SBC and Microsoft (MSFT) for the next 1-5 years??"
Hello Friends! Thanks so much for stopping by and visiting my blog,
Stock Picks Bob's Advice. As always, please remember that I am an amateur investor, so please consult with your professional investment advisors prior to making any investment decisions based on information on this website.
Trying to catch up with my email, I had a nice letter from Jonathan C. who I shall share with you. He wrote:
Hi Bob,
I just started on xanga today, mainly for the purpose
of interacting with other traders and business people,
and I came across your blog. I just have one
question, and was wondering if I could get your
opinion on it:
-What do you think of SBC and Microsoft (MSFT) for the
next 1-5 years?? SBC is investing a lot of money in
developing the IPTV system and getting it to market
within 1-2 years. It pretty much would be the future
now, with having all your home entertainment media:
internet, TV, cable, telephone, satellite, computer,
music, etc. streamlined onto one device, the TV. If
you look in the current Fortune, there is a great
article on what they are trying to do. I believe that
this is what people have been wanting for a while from
technology, having all home entertainment connected,
streamlined, and controlled from one place.
-And with Microsoft, they are also looking into this
market on the software side, as they have been working
on IPTV for the past six years. Also, their legal
troubles are behind them, they are acquiring a few
companies and software technologies, they are pushing
more into business project networking, and the new
Windows (Longhorn) is coming out in 2006.
I apologize about the email being a little long. I
was just wondering what your thought might be on these
two companies, and their outlook/performance for the
next 1-5 years?? Thanks a lot.
-Jonathan
Well, first of all, you are utilizing a strategy that we could call "top-down investing". In fact I am a "bottom-up investor". Now what does all of
that mean?
I wrote up a piece on a MSN board not too long ago about the "Zen of Investing". Others have written similar pieces as well. What that means is that I try to be a very passive investor. That doesn't mean that I don't think; to the contrary, I am thinking all of the time :). What that means is that instead of trying to divine the future sort of with some sort of divining rod, and using an "intelligent guess" about what sort of stocks
ought to be doing well in the future, I let the stocks "come to me"...sort of "Ouija" style I guess :).
I do not spend time thinking about current trends and which company will probably be doing well in the future. I am spending much more time finding out which stock is doing well
today; looking at the daily momentum lists and then determining whether they show evidence of financial results that might justify a price appreciation in the future.
Briefly, let's for the sake of discussion take a look at the Morningstar on each of those stocks...and I will give you my off the cuff take on them. But they would not qualify for purchase in my perspective unless they showed up in the daily momentum lists first. Just my idiosyncracy I guess :).
First SBC: the Morningstar.com report is located
here. Revenue, which climbed from $49.5 billion in 1999 to $51.4 billion in 2000, has been declining each and every year on Morningstar. I wouldn't be looking further than that.
Earnings/share have declined from $2.56 to $1.85 in the trailing twelve months. Another negative point from my perspective. Free cash flow has been solidly positive and the balance sheet looks adequate although the $48 billion in long-term debt is a concern.
What about MSFT? This picture looks better on the Morningstar report
here.
MSFT shows growing revenue from $23.0 billion in 2000 to $37.8 billion in the TTM. The latest earnings are down a tad at $.74 per Morningstar vs $.75 in 2004. Free cash flow is superb and the balance sheet is gorgeous with billions (!) of cash in the bank.
So what do I think about these two? Well of the two, MSFT fits my "perspective" better than SBC. Now that doesn't mean that either stock will perform positively. And you will note that I have not given any thought to everything you said about the future. There are enough variables in the past and the present that I don't think that divining the future is worthwhile...I leave that to brighter minds. I also believe that by being a bottom-up investor, one leaves oneself open to new ideas that you probably would never have thought of by yourself!
Just a thought. I hope that my writing is helpful to you and that you continue to comment on the posts and add some of your own insight to the discussion! Have a great weekend.
If you or anyone else has any questions or comments, they can reach me at bobsadviceforstocks@lycos.com .
Bob
A Reader Writes: "What about DRIP's?"
Hello Friends! Thanks so much for stopping by and visiting my blog,
Stock Picks Bob's Advice. As always, please remember to check with your professional investment advisors prior to acting on any information on this website as I am just an amateur investor.
I have been trying to catch up a little with my "homework" on this site, and answering my emails is one of the important tasks. I was fortunate enough to have an article mentioning "Stock Picks" in the local paper, and received a few letters about things since then.
One of the letters I got follows:
Hi Bob,
I was happy to learn of your blog in Sundays paper! I had heard of blogs, but have never taken the time to investigate them, and would enjoy sharing my interest in stocks with others. I see in your recent blogs, you talk of your trading account, do you also discuss long term investing of buying and holding?
What are your thoughts on "drips" for long term investing? If you were to pick a Company to directly purchase $300.00 worth of their stock per month for one to two years would you have some thoughts?
My enjoyment in the stock market over the years has been to keep adding Companies, like Fastenal, Microsoft, G.E.,etc. and watch them grow to valuable levels through stock splits.
Look forward to hearing from you,
Al B.
Let me try to comment on this letter which raises some excellent questions. First of all, am I a "trader" or a "long-term investor"? I would rather not be pigeon-holed on that one. When I buy a stock, I hopefully will also be holding on to it for years and years! However, I do not stick my head in the sand when a stock declines. I sell it. In fact, if it drops to an 8% loss after holding it for 24 hours I will sell the stock without hesitation. In that case, I am a "trader".
However, I am trying hard to buy stocks that I might hold on to for years just like you do! I look hard at identifying stocks that have growth characteristics much like Fastenal has had, or Microsoft or GE in years past. That is, steady revenue and earnings growth year after year! In that case, we are thinking much alike.
What about "DRIPS"? For some people, they are a great way to buy into a stock with small amounts of money. There isn't anything wrong with doing that. In fact, it works quite well. It just isn't my style.
Perhaps if you can build up a portfolio of five or six stocks using a "drip" technique and arbitrarily set the "cost" as the average price, you could then start implementing a more active management plan more like I do if that was your interest. Otherwise, I have never said that my approach is the only way at all...only that it is the method that I have been using recently.
Once one has a portfolio set up, I would prefer to add money in the form of cash on a regular basis, and use the cash to make periodic purchases if called for by the sale of portions of a holding at a gain. If you follow....
Thanks so much for your question and your participation here on the website. Please DO feel free to share your interest, thoughts, experience, etc. There are many different ways to invest in stocks and I try to learn from all of them!
If you have any other comments, or if anyone else has comments, please feel free to leave them right here on the blog or email me at bobsadviceforstocks@lycos.com.
Bob
"Revisiting a Stock Pick" DRS Technologies (DRS)

Hello Friends! Thanks so much for stopping by and visiting my blog,
Stock Picks Bob's Advice! I found this photo of a blizzard in 2004 from a national weather service website and boy does it ever feel like that around here today. Just two days to Spring and we are getting snow here in the upper Midwest!
Since so many visitors here are new to my investing strategy, I will try to clearly go over the steps I use to select a stock that might be worth an investment. Above all, please remember that I am an amateur investor, so please consult with your professional investment advisors prior to taking any action based on information on this website.

I first wrote up
DRS Technologies (DRS) on Stock Picks Bob's Advice on August 6, 2003, when it was trading at $27.98. Currently, as I write, it is trading at $42.43, up $1.18, or 2.86%, which was enough for it to make the
list of top % gainers on the NASDAQ. I do not own any shares of DRS nor do I own any options.

Over the years, I have found the "top % gainers" lists to be quite helpful as a first screen of potential stocks that might be positioned to continue with their same-day momentum to higher price levels. More about DRS: according to the
Yahoo "Profile" on DRS, this company "...is a supplier of defense electronic products and systems. The Company provides products and services to all branches of the United States military, aerospace and defense prime contractors; government intelligence agencies; international military forces, and industrial markets."
Generally, I have found it most useful to stay with stocks above $10. Otherwise, the volatility of the lower-priced stocks will cause me to sell the stock at an 8% loss far too often after a purchase.
Before settling on a stock, I first check the latest quarter earnings report looking for both growth in earnings as well as revenue. On February 9, 2005, DRS
reported 3rd quarter 2005 results. Fiscal third quarter results showed revenues from continuing operations at $338.2 million, a 23% increase over revenues of $274.4 million the prior year. Earnings before interest, taxes, depreciation and amortization (EDITDA), came in at $48.1 million, a 34% increase from the prior year's $35.8 million in EBITDA earnings. Third quarter net earnings were $17.5 million or $.62/diluted share, up from $11.2 million or $.44/diluted share the prior year. These were strong results!

After passing the "latest-quarter test", I look for a longer-term evaluation of earnings and revenue growth. One could call this "earnings persistence", a key criterion in my opinion, for a successful stock investment. For this I have turned to
Morningstar.com and in particular the "5-Yr Restated" financials which for DRS is found
here.
So what do I look for on this page? First of all, I love to see a beautiful 'ramp-up' of revenue growth as pictured by the series of bars on the graph at the top of the page. DRS has grown its revenue from $400 million in 2000 to $1.3 billion in the trailing twelve months (TTM).
Next, looking in the chart itself, I review the earnings growth history. For DRS, this is a
beautiful picture of uninterrupted earnings growth from $.76/share in 2000 to $2.02 of earnings in the TTM.
Third, I like to review the "free cash flow" situation. Positive free cash flow means the company is basically building up genuine cash, and a growing positive free cash flow is even better. From this same page we can see that DRS had $14 million in free cash flow in 2002, and that this has been increasing so that in the TTM, this was up to $99 million.
Next, I try to assess the overall financial "health" of the company by looking at the balance sheet. What is crucial to me is that the current assets (cash and other current assets) is greater than the current liabilities. For DRS, the current assets total $485.5 million, which is more than enough to cover the $352.1 million in current liabilities and also enough to make a dent in the $588.8 million in long-term liabilities reported. While it would be nice to have current liabilities greater than the combined current and long-term debt, the balance-sheet picture for DRS still looks healthy to me, especially with the growth in free cash flow!

Having reviewed some of the basic fundamental issues underlying this stock, I now try to briefly assess the valuation questions. While not a "value-investor" by any means, all things being equal, I am more optimistic in investing in a stock that shows good value than not.
I have found that an easily accessible site for finding valuation numbers is Yahoo on the
"Key Statistics" for DRS page. Some key facts: the market cap is $1.16 billion, making this stock a mid-cap stock.
The trailing p/e is very reasonable (imho) at 21.94 and the forward p/e (based on fye 31-Mar-06 estimates) is even nicer at 17.73. Thus, the PEG is at 1.38. The PEG is a measure of valuation that takes into consideration the growth rate; that is, the price/earnings ratio compared to the growth rate, with 1.00 being considered fairly valued.
Price/sales is also cheap at 0.90. Again, using the 1.00 number as a cut-off on valuation.
Yahoo reports 27.32 million shares outstanding with 26.70 million that float. Of these, there were 1.99 million shares out short as of 2/8/05, representing 7.45% of the float or 6.311 trading days of volume. I have arbitrarily started using 3.0 days of short interest as a "significant level".
For anyone that doesn't understand "short interest", these are shares that speculators have borrowed and sold, anticipating a decline in share price to make a profit. They will have to be "covered" at a later date by repurchasing these shares by the short-sellers. Thus, a high level of short interest can become a bullish or positive factor in stock price performance, if there is a rush to buy shares on the development of good news. This "rush" is called a "short squeeze".
Finally, on Yahoo, one can see that there are no cash dividends and no stock dividends are reported in the recent past.
What do I do next? Well basically, if the fundamental issues, like recent earnings/revenue results, and the long-term earnings/revenue results, free cash flow, and balance sheet, as well as valuation is reasonable, well I like to check a "technical" picture by reviewing a stock chart.
I have been using
Stockcharts.com for charting purposes, and have grown to like the "point & figure" charts, which for DRS is located
here:
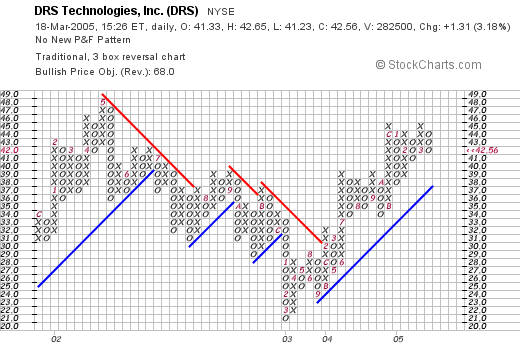
So what do I think of this chart? Well, the stock price, which peaked in May, 2002, at $48, declined from that point until March, 2003, bottoming at $21. Since then, it has been climbing once more, staying above the resistance line (blue), to its current level at $42.56. The graph looks strong for the past two years, and at the same time does not appear over-valued.
Overall, DRS is very attractive. On the downside, it is a defense-contractor, which may be subject to the political climate, however, there does not appear to be any let-up in demand for their services! The stock looked nice to me a year-and-a-half ago, when it was about 40% lower in price. The stock still looks strong, with great earnings, consistent revenue/earnings growth, growing free cash flow, reasonable balance sheet, reasonable valuation, and a decent if not overwhelming price chart.
If I were in the market to buy a stock, I might be considering this. However, my portfolio has actually been contracting, and I am, in fact, more likely to be unloading an issue than adding one in the immediate future!
Thanks again for stopping by! I hope that my discussion was not too verbose. If you have any comments, questions, or words of encouragement, please feel free to email me at bobsadviceforstocks@lycos.com.
Bob
A Reader Comments: "How about KOMG vs. SYNA?"
Hello Friends! Thanks so much for stopping by and visiting my blog,
Stock Picks Bob's Advice. As always, please remember that I am an amateur investor so please consult with your professional investment advisors before making any investment decisions based on information on this website.
A short while back, I had a comment on the blog:
"Hello,
How about your thoughts on KOMG relative to SYNA?"
As you probably know, if you have been following my trading, I bought some SYNA, and then stopped out shortly after the purchase with an 8%+ loss.

Anyhow, I have
reviewed Synaptics (SYNA) on Stock Picks on February 26, 2005...so let's take a quick look at Komag (KOMG). I currently do not own any shares of either of these stocks.
KOMG is currently trading at $23.32, up $.46 or 2.01% on the day in an otherwise weak market. That's a plus!
Looking at
Komag "Headlines" on Yahoo, we can see that they recently announced that the 1st quarter revenues for 2005 will be ahead of 4th quarter 2004 results. That is ALSO a plus!
How about the latest quarter? On February 2, 2005, KOMG
reported 4th quarter results. "Net sales" rose to $131.2 million from $118.2 million last year. However, quarterly income came in at $15.7 million, or $.51/share down from $16.4 million or $.65/share last year. That is a NEGATIVE. (at least for the way I look at stocks.)
How about longer-term? What does the Morningstar.com '5-Yr Restated' Financials look like? The Morningstar.com
financials show KOMG to be growing, but revenue has been inconsistent. In fact they grew to $358.5 million in revenue in 2000, then dropped to $282.6 million in 2001, and have improved since then. Earnings have improved from $1.47/share in 2003 to $1.94 in the trailing twelve months. Free cash flow, which was negative at $(49) million in 2001, grew to $50 million in 2003, and came in at $14 million in the TTM. The Current Assets total about $192.9 million, and the Current and Long-term liabilities together total only $132.6 million, so overall the balance sheet is solid.
So what do I think? Recall that SYNA has a much cleaner picture of revenue growth on the
Morningstar.com report, with revenue improving from $43.4 million in 2000 to $141.8 million in the Trailing twelve months. Earnings have been up consistently with $.31/share in 2003, $.48/share in 2004 and $.55/share in the TTM.
Free cash flow has been steady at around $12 million/year. And the balance sheet on SYNA looks even nicer with $137.8 million in Current Assets, and only $25.5 million of Current liabilities on Morningstar.com showing, and only $2.4 million in long-term debt.
Now, you may have to
pay for that higher 'quality' as KOMG has a trailing p/e of only 13.13 with a PEG of 0.93. SYNA has a trailing p/e of 30.07, with a PEG even nicer at 0.67. So, it is not clear that KOMG is necessarily the better value...but that depends on whether you trust estimates going forward.
So what do I think? Well, my system led me to pick SYNA, but I stopped out with an 8% loss. The latest quarter would keep me from posting KOMG, but that doesn't mean it isn't a great investment, it is just it doesn't enter my universe of stocks as it misses a couple of my screening tests.
Does that answer your question? I hope so. Good luck and let me know what you decided to do. You can see that my own decision led me to a small loss, so I do not claim to be omniscient; I only hope to do better than average :). (Or should I say better than the "Averages"!).
If you have any questions or comments, please feel free to enter them right on the blog or email me at bobsadviceforstocks@lycos.com. I cannot answer all emails, but I will try to get to as many as possible!
Bob
Wednesday, 16 March 2005
March 16, 2005 Career Education (CECO)
Hello Friends! Thanks so much for stopping by and visiting my blog,
Stock Picks Bob's Advice. As always, please remember that I am an amateur investor so please consult with your professional investment advisors prior to making any investment decisions based on information on this website.

I have had lots of email recently about what I think about this or that particular stock. Let me explain something about what I am doing. First, I cannot predict what any particular stock is likely to do. And I cannot really tell you whether you should or should not buy any particular stock. That is where your professional investment advisors come in.
In general, my investment approach is to scan the lists of top percentage gainers most days to see if any stocks that happen to be on those lists are worthy of consideration. As for my own investments, I only buy a stock if I get a signal from my own portfolio to purchase. A signal is a sale of an existing partial position at a gain. A signal to sit on my hands is a sale at a loss or bad news.
So today, I decided to take a look at the
list of top % gainers on the NASDAQ. Here I came across Career Education (CECO), which, in spite of a lousy market, closed today at $36.35, up $3.61 or 11.03% on the day. I do have some shares of this particular stock in a managed account of mine. That is, I do not pick the stocks to buy or sell in that account, I defer to the professional manager.
What drove the stock higher today? Apparently, CECO
released a "10-K", which is a required document for the SEC. As
reported by Reuters,
"The shares of Career Education Corp. surged more than 14 percent on Wednesday after the education company disclosed in a Securities and Exchange Commission filing that an investigation into its accounting practices and other allegations was nearly over."
As often is the case, it is the
uncertainty of financial events that deters investors.

My next step after identifying a stock on the top % gainers list is to check the latest quarterly result. (So much of what I do on this blog is what I would call "common sense").
On February 15, 2005, CECO
reported 4th quarter 2004 results. For the fourth quarter ended December 31, 2004, total revenue came in at $485.9 million, a 33% increase over the revenue of $366.7 million the prior year same period. According to the report, this increase was primarily due to a 30% increase in "same-school revenue", much like same-store revenue numbers we would comment on for retail ventures.
Net income was $59.8 million, or $.57/diluted share, up 18% from the prior year's result of $50.7 million or $.49/diluted share.
Thus, this company has had both increases in revenue
and earnings the latest quarter, a key requirement to my particular screening process.

My next step is to look for a pattern of longer-term growth in earnings in revenue. It is my goal to develop a portfolio of stocks of companies that consistently grow their earnings and revenue year after year, and maintain a healthy balance sheet with positive free cash flow.
Where do I find this result? For this information, I turn to the
Morningstar.com "5-Yr Restated" financials on the Morningstar website.
Here we can see that first of all, the revenue growth has been steady and impressive (as demonstrated by the ramp-up of revenue on the bar-graph representation) from $224 million in 1999 to $1.6 billion in the trailing twelve months (TTM).
How about earnings? These have also steadily grown from $.17/share in 1999 to $1.71/share in the TTM.
And "free cash flow"? Also impressive, with $(3) million in 2001, improving to $45 million in 2002, $133 million in 2003, and $233 million in the TTM.
And balance sheet? As reported on Morningstar, CECO has $274.5 million in cash and $187.2 million in other current assets. This can be balanced against the $289.1 million in current liabilities and the smaller $66.1 million in long-term liabilities. From this, it appears that CECO can cover their current liabilities easily, and in fact, have enough left over in current assets to pay off their long-term debt as well!

Next, I try to take a look at "valuation" questions. For this I turn back to Yahoo for the
"Key Statistics" section on Yahoo Finance. Here, we find some assorted facts that help me judge this company and the investment.
First, this is a large cap stock with a market capitalization of $3.73 billion. The trailing p/e is moderate at 21.26, but the forward p/e is even more attractive at 13.27. The "5-yr expected" PEG is beautiful at 0.58. The PEG, for me, is a number that is useful in determining the valuation of a growth stock. It is the ratio of the P/E to the estimated growth rate. Thus, under 1.0 suggests a real "bargain" if the growth actually happens as expected!
Price/sales is a bit richer at 1.94.
Yahoo reports 102.5 million shares outstanding with 101.50 million of them that float. Of these, there are 10 million shares out short as of 2/8/05. This represents 9.85% of the float or 4.667 trading days. I personally use an arbitrary 3.0 days as a cut-off of significance. Thus, we can see that with good news as happened today, there could well be a bit of a short squeeze as the short-sellers rushed to cover their shares pre-sold.
There are no cash dividends and the last stock split, per Yahoo, was a 2:1 on August 25, 2003.
How about a chart? Does the stock-price 'pattern' appear promising? For this I like to use the chart service on
Stockcharts.com. The last few years, I have become comfortable with what are called
"Point and Figure" charts. This is the
"Point and Figure" chart for CECO:
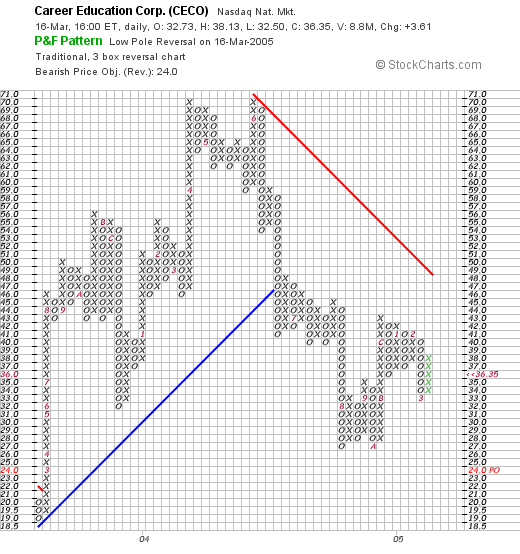
Quite frankly, this price graph looks awful! The stock broke down in June, 2004, when it fell from $70/share to $42/share over a few weeks. The stock continued past its support level (the blue line), down to a low of $26. However, the stock appears to be climbing higher once again. I guess if I were a technician, I would be waiting to see the stock break through the $48 resistance level (the red line), in a convincing fashion. But then again, I am not a technician...but it is helpful to at least look at the chart!
So what do I think. Well, I am NOT in the market for a stock. I do happen to own some shares of this one in a different account not under my control. But the last quarter's results were impressive, the five year results look nice, the valuation is great, the free cash flow is superb, the balance sheet is solid. But the chart is a bit weak. And I personally would wait for all of the apparent accounting questions to be cleared up prior to buying any shares....but then again, that might be a bit late....the market does anticipate things!
Thanks so much for stopping by. I hope that you peruse lots of the stocks I have discussed and you will continue to get a handle on my own perspective. If you have any questions or comments, please feel free to email me at bobsadviceforstocks@lycos.com .
Bob
Newer | Latest | Older


