Stock Picks Bob's Advice
Friday, 13 May 2005
"Happy Birthday to Me!" Two Years Young!

Hello Friends! Thanks so much for stopping by and visiting my blog, Stock Picks Bob's Advice. As always, please remember that I am an amateur investor, so PLEASE remember to consult with your professional investment advisors prior to making any investment decisions based on information on this website.
It is hard to believe that I have passed the two year mark around here, starting my third year writing "Stock Picks". I hope it has been a good couple of years for you all too! I appreciate your visits, and especially your emails and comments which let me know that you are all out there reading and thinking about what I write. Of course, please never forget that I truly am an amateur! So do your own investigations and consult with your professional advisors prior to acting on what I write.
Yesterday marked the two year anniversary of Stock Picks, and I would like to share with you my first pick on Stock Picks on 5/12/03 (St Jude STJ):
May 12, 2003 St Jude Medical
This is one I picked up today. STJ is the stock symbol. I do not as I write and publish this own any shares. Am thinking about suggesting this to my stock club. Company had a great day today with a nice move on the upside. Last Quarter was good and the past five years have been steady growth. Closed at $55.30 up $2.92. So the daily momentum helped it make the list.
It is my belief, that if we can assemble portfolios of stocks that consist of companies that are growing steadily and profitably, we have an above average chance of having a profitable investing strategy.
The stocks that I write up are all stocks that I might consider buying. Of course I cannot own them all and in fact own just a small portion of the many issues that I discuss on this blog.
I also believe that some sort of portfolio management system is appropriate that lets you move more towards stocks when times are good and more towards cash when the market is retreating.
In addition, at all costs, I avoid "falling in love" with any particular stock. I sell my losing stocks quickly and my winning stocks slowly. Thus, the bias is to keep profitable stocks in the portfolio.
Does all of this work? Time will tell. In my own trading portfolio, it is not 100%, but it appears to be a profitable strategy!
I would love to hear from all of you readers as to what your own investment strategy is working, how what I write affects your own thinking, and ways that I can improve this blog. You can email me at bobsadviceforstocks@lycos.com or leave your comments right here on the website.
Thanks so much for stopping by and visiting!
Bob
Thursday, 12 May 2005
May 12, 2005 Pall Corporation (PLL)
Hello Friends! Thanks so much for stopping by and visiting my blog,
Stock Picks Bob's Advice. As always please remember that I am an amateur investor so PLEASE consult with your professional investment advisors prior to making any decisions based on information on this website. I cannot be responsible for any of your trading decisions!
What I try hard to do around here is to look around at stocks which are doing well on that particular day, and of those, decide which stocks might have characteristics to suggest that they will continue to do well. And as for that, I mean continue to perform in a business sense, and secondarily, to hopefully appreciate in price! I combine this with a bit of rudimentary portfolio management in my own holdings, selling losers quickly, and selling winners slowly at set price targets. Nothing on this blog is about "getting rich quick". As I have commented elsewhere, if this were a baseball game, my approach is to get base hits one after another.
Looking through the
list of top % gainers on the NYSE today, I came across Pall Corporation, which, as I write, is trading at $28.58, up $2.18 or 8.26% on the day. I do not own any shares of Pall currently, but have owned them in the past. In fact, I came across Pall reading one of my favorite books by Gene Walden,
100 Best Stocks to Own in America. I really owe a lot to Mr. Walden, who presents a common-sense approach to investing, an approach that I subscribe to for the most part...finding companies with consistent earnings and revenue growth may result in great stock picks!
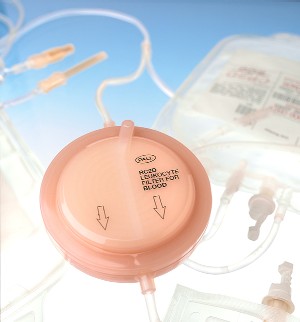
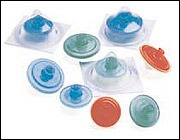
According to the
Yahoo "Profile" on Pall, PLL "...is a supplier of fine filters, principally made by the Company using its own filter media, and other fluid clarification and separations equipment for the removal of solid, liquid and gaseous contaminants from a variet of liquids and gases."
One of the first places I go in my analysis, is to review the latest quarterly results of any prospective company. (This stuff is not genius material imho...just sort of common sense!).
On March 1, 2005, PLL
reported 2nd quarter 2005 results. Sales for the quarter jumped 9.5% to $469.5 million, from $428.1 million last year. Earnings came in at $32 million or $.26/share, up from $24.9 million, or $.20/share last year. These were nice results imho.
How about "longer-term results"? For this I like to review the
"5-Yr Restated" financials from Morningstar.com. First thing is revenue growth, and here we can look for, and for Pall
find, a nice ramp-up of purple bars indicating a steady growth in revenue from $1.2 billion in 2000 to $1.9 billion in the trailing twelve months (TTM).
My next step is earnings growth evaluation. This often does not follow revenue exactly, and unless lately, the earnings are also growing, I will not continue looking at a stock. In PLL's case, we can see that earnings actually
dropped from 2000 when they earned $1.18/share down to $.59/share in 2002. However, since then earnings have been growing and came in at $1.24/share in the TTM.
Next step is free cash flow. Pall has fairly solid free cash flow performance with $86 million in free cash flow in 2002, increasing to $120 million in the TTM.
And balance sheet? Here we look at current assets, consisting of "cash" and "other current assets" as compared to "current liabilities". I prefer to see the sum of current assets outweighing at least the current liabilities and if possible, the long-term liabilities as well!
For Pall, according to the Morningstar information, cash stands at $227.1 million and "other current assets" are at $886.3 million. Thus, there is a total of about $1.1 billion in current assets. This is balanced against $400 million in current liabilities and $691.8 million in long-term liabilities. Pall could pay off
both the current and the long-term liabilities with just the current assets. Thus, the balance sheet looks solid to me on my perspective.
What about some "valuation" parameters? For this information, I have been using Yahoo Finance again, in particular the
Yahoo "Key Statistics" for Pall. Here we can see that this is a large cap stock with a market capitalization of $3.52 Billion. The trailing p/e is modest (imho) at 22.90, and the forward p/e (fye 31-Jul-06) is even nicer at 17.58. The PEG (5 yr expected) is reasonable, if not cheap, at 1.54.
The Price/Sales ratio is 1.77. Lately, I have been looking at other companies in the same "industry group" to see what kind of valuation this represents.
According to my my Fidelity source, PLL is a part of the "Diversified Machinery" industry group. The Price/Sales of Pall at 1.8 is midway between a low for Eaton (ETN) at 0.9, Ingersoll-Rand (IR) at 1.3, Illinois Tool Works (ITW) at 2.0, and Roper (ROP) at 3. Thus valuation per this parameter is "fair". Not cheap, not expensive, sort of Goldilocks "just right!"
Other numbers from Yahoo show 124.45 million shares outstanding with 121.60 million that float. Currently there are 2.97 million shares out short (as of 4/8/05) representing 2.44% of the float, or 6.105 trading days of volume. Thus, in my own 3 day rule, this is a significant short interest, and any upward movement of the stock price, might induce other short sellers to scramble trying to cover their "presold" shares.
The company does pay a small dividend of $.40/share yielding 1.52%. The last stock split was a 4:3 split, according to Yahoo, way back in December, 1992.
How about "technicals"? How does the chart look like? I have been using "point & figure" charts from Stockcharts.com for this purpose. This
chart actually is interesting to me. The company really went nowhere between 1999 and 2003 when it traded in a range between $15.50 and $25/share.
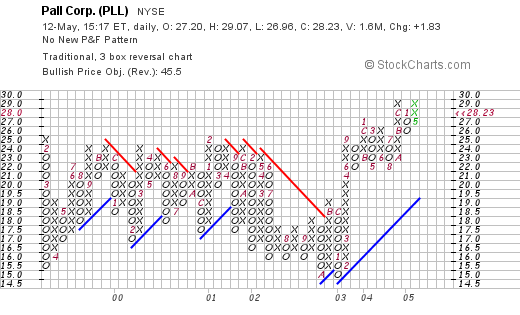
It was only in september, 2003, when it failed to return to the mean and then in what appears to be about October, 2004, when it broke through the $26 level and headed higher. The stock chart actually looks quite nice and does not appear over-valued. (always imho).
So what do I think? Well, you know I wouldn't list the stock on this blog unless I liked it :). The latest quarterly report was solid, the Morningstar sheet looks good with growing revenue, earnings, free cash flow, and a solid balance sheet. The valuation looks nice. And the chart looks pretty solid to me. I guess I like it :).
Thanks so much for stopping by! If you have any questions or comments, please feel free to leave them right here on the blog or email me at bobsadviceforstocks@lycos.com.
Bob
Wednesday, 11 May 2005
"Revisiting a Stock Pick" Varian Medical Systems (VAR)
Hello Friends! Thanks so much for stopping by and visiting my blog,
Stock Picks Bob's Advice. As always, PLEASE remember that I am an AMATEUR investor, so that means you need to check with a PROFESSIONAL investment advisor prior to making any decisions based on information on this website. I CANNOT be responsible for any of your trading activity, and shall not ask for any portion of your gains, nor be responsible for any part of your losses incurred using ANY trading method!

Looking through the
list of top % gainers on the NYSE today, I saw that an old pick of mine, Varian Medical Systems (VAR) had made the list, closing at $35.10, up $1.38 on the day or 4.09%. I do not own any shares nor do I own any options on this company.
I first
listed VAR on Stock Picks on 10/20/03, when it was trading at $60.78. VAR had a 2:1 split 8/2/04, making my effective stock pick price $30.39.
According to the
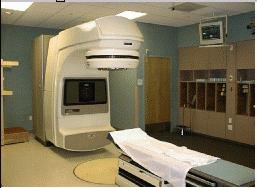
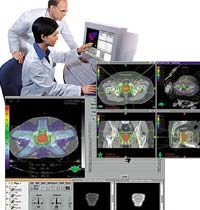
Yahoo "Profile" on Varian, the company "...is engaged in designing and manufacturing advanced equipment and software solutions for treating cancer with radiation, as well as cost-effective x-ray tubes for original equipment manufacturers, replacement x-ray tubes and flat-panel digital subsystems for imaging in medical, scientific and industrial applications."
On April 27, 2005, VAR
reported 2nd quarter 2005 results. Revenues came in at $351 million, up 9% from the prior year same quarter. Net earnings were $54 million or $.39/diluted share up from $44 million or $.31/diluted share the prior year. In addition, the company reported a strong $395 million of net orders for the quarter, up 13% from last year. The backlog of orders stood at $1.05 billion, up 20% from the prior year!
To top off a great earnings report, the company raised guidance in earnings for fiscal 2005, to a 26% increase expected. Revenue for 2005 should rise 13% over 2004 totals. Subsequent quarter results were also raised with earnings and diluted eps to rise about 20% and revenue to grow by 14%. This was a bullish call and the stock responded!
How about "longer-term"? Taking a look at the
"5-Yr Restated" financials on Morningstar.com, we can see the beautiful 'ramp-up' of revenue with the series of violet bars growing with time on the chart, from $0.7 billion in 2000 to $1.2 billion in the trailing twelve months (TTM).
Earnings, except for a slight dip from $.41/share in 200 to $.40/share in 2001, have been steadily growing: $.67 in 2002, $.92 in 2003 and $1.18 in 2004.
Free cash flow has been positive and growing from $130 million in 2002 to $210 million in 2004.
The balance sheet is also solid with $351.9 million in cash and $533.2 million in other current assets, easily covering the $461.3 million in current liabilities AND the $95.1 million in long-term liabilities with about $300 million left over!
What about some "valuation" numbers on this stock? Looking at
Yahoo "Key Statistics" for VAR, we can see that this is a large cap stock with a market capitalization of 4.69 Billion. The trailing p/e isn't bad at 26.08, and the forward p/e is also reasonable (fye 1-Oct-06) at 20.77 (imho). Thus the PEG (5 Yr Estimated) is 1.46.
Yahoo shows the Price/Sales ratio at 3.47. Seemingly high, I have started thinking about
Paul Sturm from SmartMoney.com on Price/Sales ratios. Instead of looking at them in absolute terms, it is helpful to view valuation in the context of a stock's relative P/S ratio in its industry group.
VAR is in the "Medical Appliances/Equipment" group (per Fidelity), and other stocks in the group have mostly higher Price/Sales ratios: Medtronic (MDT) at 6.3, Zimmer Holdings (ZMH) at 6.3, St. Jude (STJ) at 5.7, Biomet (BMET) at 5.2, and Edwards Life Sciences (EW)(the only stock in this group with a lower price/sales) at 2.9. Thus, by this parameter, VAR looks reasonably valued!
Some other facts from the Yahoo site include the number of shares: 133.56 million, with 132.90 million shares that float. Currently, as of 4/8/05 there are 5.12 million shares out short, representing 3.85% of the float or 4.986 trading days of volume. I have personally been arbitrarily using 3 days as a level of significance, and this stock thus has a significant number of shares out short, which, with the bullish earnings report, adds some buying support for the stock.
No cash dividend is paid, and as I noted above, the last stock split was a 2:1 split in August, 2004.
How about the chart? Taking a look at the
Stockcharts.com "Point & Figure" chart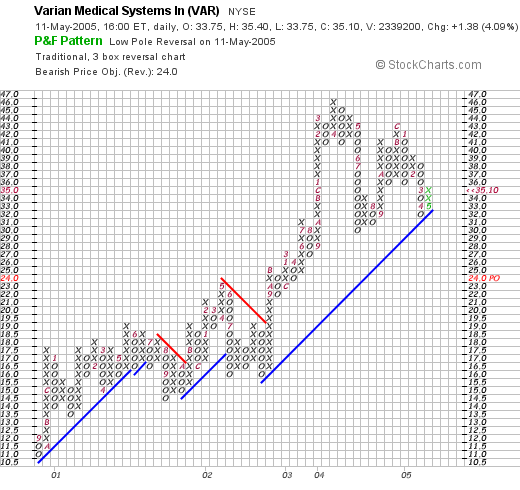
we can see that this stock has generally been quite strong, especially between August, 2000, when it was trading at $11, until late 2002 when it rose to $19.50/share. After that point, the stock soared to a high of $46/share in April, 2004, consolidating throught the last 12 months to its current level of $35.10. Overall, the stock is holding its support line, does NOT appear to be over-extended, and appears strong to me!
What do I think? Well, if I could buy a stock today, this one would probably be high on my list. The stock showed strong price action today, had a great earnings report recently, raised guidance at the same time, has shown consistent earnings and revenue growth, generates growing amounts of free cash flow, and has a solid balance sheet. Valuation-wise, the p/e doesn't look bad, and the Price/Sales ratio makes it relatively cheap within its group. And finally, the chart looks just fine to me!
Thanks again for stopping by! If you have any questions, comments, or words of encouragement, please feel free to post them right here on the blog or email me at bobsadviceforstocks@lycos.com.
Bob
Monday, 9 May 2005
May 9, 2005 Par Technology (PTC)
Hello Friends! Thanks so much for stopping by and visiting my blog,
Stock Picks Bob's Advice. As always, please remember that I am an amateur investor, so please consult with your professional investment advisors prior to making any investment decisions based on information on this website. They will be able to tell you if these decisions are appropriate, timely, and likely to be profitable for you!

Looking through the
list of top % gainers on the NYSE today, I came across Par Technology Corporation (PTC), which, as I write is trading at $22.17, up $.92 today, or 4.33%. I do not, nor do any of my family members, have any shares or options on this stock.
According to the
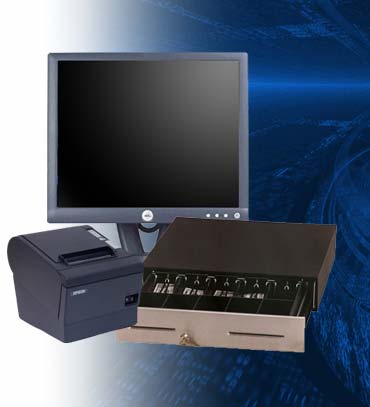
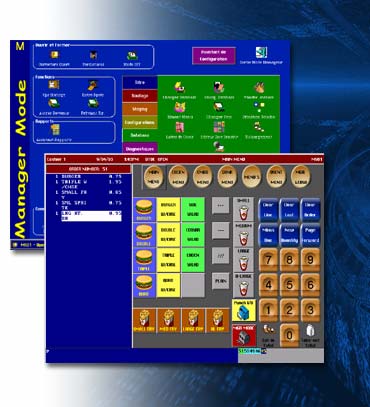
Yahoo "Profile" on PTC, the company "...operates through its subsidiary ParTech, Inc., which is a provider of management technology solutions, including hardware, software and professional services to businesses in the hospitality and retail industries."
As I always point out, the first "screen" that I like to use in picking a stock for the blog is to check the latest quarterly report. On April 27, 2005, Par
reported 1st quarter 2005 results. Revenue grew 29% to $48.8 million from $37.9 million last year. Quarterly income grew to $1.3 million or $.14/share this year, from $736,000, or $.08/share in the same quarter last year.
How about longer-term? In other words, it is great that they had a nice quarter, but can the company continue to deliver outstanding results? The best approach that I have found, is to examine the past five years through Morningstar. Hopefully, most companies that do well this quarter
and have done well the past several years will continue to do well. Now as you know, past results are NO guarantee of future results, but imho, they are about as good an indication as you can get.
Checking the
"5-Yr Restated" financials from Morningstar.com on PTC, we can see the nice "ramp-up" of revenue fromn $101.5 million in 2000 to the $174.9 million in the trailing twelve months (TTM).
Earnings also show steady growth from $.04/share in 2001 to $.61/share in 2004.
Free cash flow is positive and growing from $3 million in 2002 to $18 million in 2004.
The balance sheet, as reported on Morningstar.com, also looks nice with $8.7 million in cash and $69.0 million in other current assets, plenty to cover both the current liabilities of $45.2 million and the $3.0 million in long-term liabilities with current assets left over.
What about "valuation" questions? For this information, I find the
Yahoo "Key Statistics" page on PTC very helpful!
Here we can see that the market capitalization of this company is a small $197.82 million. Many people would put this in the "micro-cap" range.
The trailing p/e isn't bad at 33.08, the forward p/e (fye 31-Dec-06) is estimated at 20.09, and thus, the 5-Yr PEG is also estimated at 1.15. The Price/Sales ratio is nice at 1.02.
As I have written elsewhere, and as Paul Sturm has
written in Smart Money, the Price/Sales ratio is only helpful in regards to relative valuation within an industry group.
Par Technology (PTC) is in the "Business Equipment" industry. Other stocks in this group, include Nam Tai Electronics (NTE) with a P/S ratio of 1.7, Diebold (DBD) with a P/S ratio of 1.5, Herman Miller (MLHR) at 1.4, HNI Corp (HNI) at 1.3, and only Xerox is lower than PTC at 0.8. Thus, the valuation of this company actually looks quite attractive!
Also from Yahoo, it is reported that there are only 8.95 million shares outstanding with 4.90 million of them that float. As of 4/8/05 there were only 33,000 shares out short representing 0.67% of the float or only 0.75 trading days of volume. This doesn't look significant to me.
No stock nor any cash dividends are reported on the Yahoo page.
How about "technicals"? In other words, does the chart look promising? I have found that the point and figure charts from Stockcharts.com are the most helpful. Looking at the
Stockcharts Point & Figure Chart on PTC:
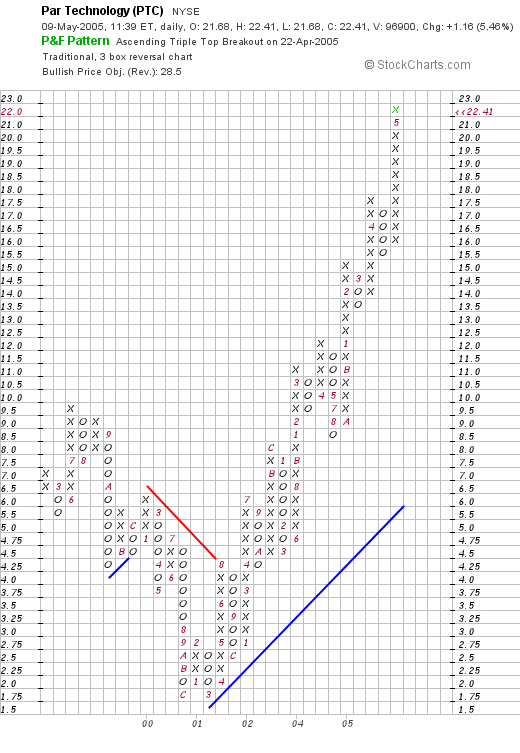
we can see that this stock was actually moving lower between December, 1999, when it peaked at around $6.00, to a low of $1.75, which was hit in March, 2001. Since that time, the stock has traded steadily higher in a very strong chart pattern. Currently, the stock appears to be right at its highs at the $22.00 level. If anything, the chart looks a bit over-extended, but I wouldn't be fighting this chart pattern!
In summary, this stock looks attractive to me because of the nice price move today, the great earnings report released last month, the five year record of growing revenue and earnings, free cash flow, and a solid balance sheet. Valuation looks reasonable, and the chart is gorgeous! What is there not to like? On the downside, this is a tiny company, and in my experience, tiny companies are subject to considerable volatility.
Besides, I am not in the market to buy anything at this time. I am sitting on my hands, waiting for one of my current investments in my trading account to hit a price target so that I can sell a portion and add a new position!
Thanks again for stopping by! Please feel free to leave any comments you might have on the blog or feel free to email me at bobsadviceforstocks@lycos.com.
Bob
Sunday, 8 May 2005
"Looking Back One Year" A review of stock picks from the week of March 15, 2004

Hello Friends! Thanks so much for stopping by and visiting my blog,
Stock Picks Bob's Advice. As always, please remember that I am an amateur investor so please consult with your professional investment advisors prior to making any investment decisions based on information on this website.
It is the weekend and for me, that means a time to stop looking for new stock picks and instead a chance to review past selections. This analysis assumes a buy and hold approach to investing which is not what I employ in my own investment portfolio. In fact, I sell stocks that decline (which is NOT infrequent) quickly, and sell stocks that gain (also NOT infrequent!) slowly. But for the sake of reviewing what happened to these stocks, "buy and hold" works just fine. Also, some people think that I am reviewing stocks that I actually have purchased. In fact, most of the stocks that I review, the great majority in fact, I have never purchased! You can view my current
"Trading Portfolio" elsewhere on this website. I am a bit behind updating the list, but those are stocks that I have actually purchased!

On March 15, 2004, I
posted Toro (TTC) on Stock Picks at a price of $58.96. TTC had a 2:1 split on 4/13/05, with a resultant adjusted stock pick price of $29.48. TTC closed at $42.86 on 5/6/5 for a gain of $13.38 or 45.4%.

On February 22, 2005, Toro
reported 1st quarter 2005 results. Sales jumped 10.6% to $346.9 million from $313.6 million the prior year. Net earnings came in at $11.2 million, up from $9.3 million, or $.47/diluted share this year, compared with $.36/diluted share the prior year.

On March 17, 2004, I
posted Autobytel (ABTL) on Stock Picks at a price of $12.93. Autobytel (now listed as ABTLE), closed at $4.79 on 5/6/05 for a loss of $(8.14) or (63.0)%.

On April 1, 2005, ABTLE
announced a request for an extension on filings of financial statements. The company is busy restating results, many officers have resigned, litigation is pending, and it will take a lot to clear this one up! An unfortunate pick for the blog!

Finally, on March 17, 2004, I
selected VCA Antech (WOOF) for Stock Picks at $34.69. WOOF had a 2:1 stock split on 8/26/04 making my effective "pick price" only $17.35. WOOF closed at $23.55 on 5/6/05, for a gain of $6.20 or 35.7%.
On April 26, 2005, WOOF
announced 1st quarter 2005 results. Revenue increased 30% to $186.9 million from $144.4 million the prior year same quarter. The company earned $17.5 million or $.21/share in the quarter, up from $14.7 million or $.18/share the prior year. In addition, the company raised outlook for the remainder of 2005!
So how did we do for that week a year ago? Well, of the three stocks "picked", two had solid gains and one just fell apart! Averaging the three selections still gives us an average gain of 6.03%. Not too bad, and would have been even better if we were stopping out that ABTLE at the (8)% loss level!
Thanks again for stopping by! Remember that I AM an amateur, so please consult with your professional investment advisors prior to using this website for investment decisions. If you have any questions or comments, please feel free to leave them here on the blog or email me at bobsadviceforstocks@lycos.com.
Bob
Friday, 6 May 2005
May 6, 2005 Multi-Color Corporation (LABL)
Hello Friends! Thanks so much for stopping by and visiting my blog,
Stock Picks Bob's Advice! Needless to say, I am an amateur investor, I am not a financial analyst but I love to look and talk about stocks. Thus, it is of utmost importance that you refer to your professional investment advisors prior to making any investment decisions based on information on this website. Only a professional can assist you in these decisions, making sure the investments are appropriate, timely, and likely to be profitable for you!

I had a little time today and wanted to see if I could find something interesting for all of the readers here. As you probably know, if you read my entries (and I hope you read the others as well!), I like to start my "search" by looking at the
top % gainers on the NASDAQ. Today I came across Multi-Color Corporation (LABL) which, as I write, is trading at $23.60, up $2.25 or 10.54% on the day. I do not own any shares or options on this stock, nor do any members of my family.

According to the
Yahoo "Profile" on LABL, this company "...is a supplier of decorative label solutions and packaging services to consumer product and food and beverage companies, national retailers and container manufacturers worldwide."
What drove the stock higher today, as is so common with stocks on this blog, was the
announcement of 4th quarter 2005 results this morning. For the quarter ended March 31, 2005, revenue increased 36% to $45.3 million from $33.3 million the prior year. Much of that increase was from an acquisition. Net income rose 80% to $2.9 million or $.43/diluted share, up from $1.6 million or $.24/diluted share the prior year. The "street" liked these numbers and has bid up the price of this stock today!

How about "longer-term"? Looking at the
Morningstar.com "5-Yr Restated" financials, we can see a beautiful ramp-up of revenue from $53.3 million in 2000 to $127.0 million in the trailing twelve months (TTM).
Earnings, however, have been a bit more erratic, dipping from $.89 in 2000 to $.76 in 2002, but increasing since then to $1.01 in the TTM.
Free cash flow has also been a bit erratic, but has stayed positive the last few years with $8 million reported in the TTM.
The balance sheet looks just fine to me with $6.8 million in cash and $24.0 million in other current assets balanced against $15.2 million in current liabilities and $23.0 million in long-term liabilities.
What about some "valuation" questions on this stock?

Taking a look at
Yahoo "Key Statistics" on LABL, we can see that this is a very small company with a market capitalization of $156.35 million. The trailing p/e isn't bad at 24.26, and apparently no estimates are available to calculate a PEG.
The Price/Sales ratio is rather cheap (imho) at 1.06. However, all of the stocks in the "Packaging and Containers" industry group (according to Fidelity information), are rather cheap including Sealed Air (SEE) at 1.1, Tupperware (TUP) at 1.1, Bemis (BMS) at 1.0, Pactive (PTV) at 0.9, and Ball (BLL) at 0.8. Thus, I would just say that it appears that LABL is reasonably priced, and certainly not the "cheapest" in its industry.
Other facts on Yahoo include the # of shares outstanding at only 6.34 million, with 5.70 million that float. There were NO short shares reported as of 4/8/05. In addition, the company DOES pay a small dividend of $.20/share yielding .95%. The last stock split was a 3:2 split in December, 2003.
What about "technicals"? What does the chart look like? Taking a look at a
Multi-Color "point & figure" chart from Stockcharts.com, we can see what looks to me as a very strong chart.
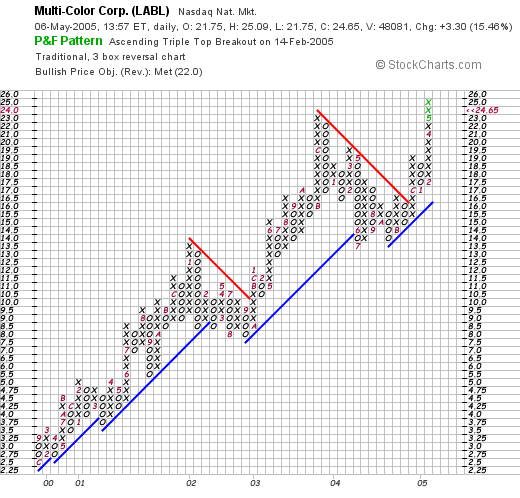
 Since late 1999 (!), when the stock was trading as low as $2.50/share, the stock has steadily moved higher, only occasionally consolidating, but following its support line rather well. As you know, I am not a professional technician, but the pattern looks pretty straightforward with a gradual price appreciation of the stock!
So what do I think? Well, I am not in the market to buy anything, but except that this is a very small company that would thus be fairly thinly traded, everything else looks just fine. The latest quarterly report is solid, the company is growing its earnings, spinning off positive free cash flow, the balance sheet is nice, valuation isn't bad at all (imho), and the chart looks nice!
Thanks again for stopping by and visiting! If you have any questions or comments, please feel free to leave them right here on the blog or email me at bobsadviceforstocks@lycos.com.
Bob
Thursday, 5 May 2005
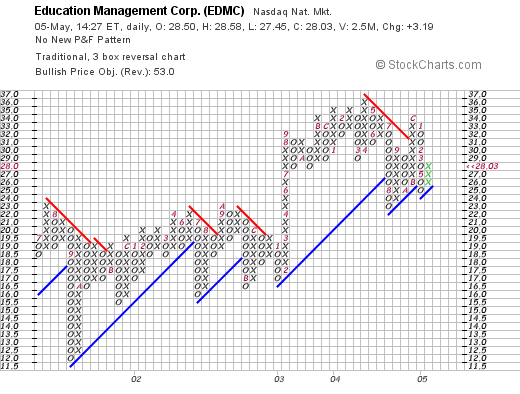
May 5, 2005 Education Management (EDMC)
Hello Friends! Thank you once again for stopping by and visiting my blog,
Stock Picks Bob's Advice. As I always remind you, please remember that I am truly an amateur investor. I like to make observations about stocks! But before you make any investment decisions based on information on this website, PLEASE consult with your professional investment advisors to make sure that your decisions are appropriate, timely, and likely to be profitable for you!

Looking throught the
list of top % gainers on the NASDAQ today, I came across Education Management Corporation (EDMC) which, as I write, is trading at $27.97, up $3.13 or 12.60% on the day. I do not own any shares or have any options on this stock. Nor do any members of my family.
According to the
Yahoo "Profile" on EDMC, this company "...is engaged in the business of providing private post-secondary education in North America."
Yesterday, after the close of trading, EDMC reported
3rd quarter 2005 results. Revenue increased 16.8% to $274.6 million compared to $235.2 million the prior year. Net income grew 34.5% to $34.2 million or $.45/diluted share, compared to $25.4 million or $.34/diluted share in the same quarter in fiscal year 2004. The street liked these numbers, and the stock has moved higher today.

How about 'longer-term'? For that I like to turn to Morningstar for some more in depth financials, in particular, I like to review the page with the
"5-Yr Restated" financials for EDMC.
First of all, the revenue growth is demonstrated by the beautiful ramp-up of "blue bars" on the graph, with revenue growing from $307.2 million in 2000, increasing steadily to $940.5 million in the trailing twelve months (TTM).
Earnings have also been extremely consistent, growing from $.38/share in 2000 to $1.18 in the TTM.
Free cash flow has not been quite as steady, with $47 million in 2002, dropping to a negative $(1) million in 2003, but then continuing to grow to $83 million in 2004 and $101 million in the TTM.
What about the balance sheet? This is probably a weak spot for EDMC with a bit more debt than I would prefer to see. Morningstar reports $34 million in cash and $82.8 million in other current assets, balanced against a larger $147.5 million in current liabilities. Long-term liabilities are not as bad at $20.1 million. I almost always insist on seeing current assets at least covering current liabilities, but with the growing free cash flow this shouldn't be a problem imho.

What about "valuation" questions? What about some statistics on the company?
For that I turn to the
Yahoo "Key Statistics" on EDMC. Here we can see that this is a large cap stock with a market capitalization of $2.07 billion. The trailing p/e is nice at 21.74, and the forward p/e is noted to be at 18.04 (fye 30-Jun-06). Thus, the PEG is under 1.0, at 0.96, suggesting a pretty good value for a share of stock.
Price/sales comes in at 1.96. This is somewhere in the middle of the industry group of "Education & Training Svcs.", with Apollo (APOL) at 6.1, and Corinthian Colleges (COCO) at the other end at 1.3. Career Education (CECO) is similar at 1.8, and DeVry (DV) is also close at 1.9. At least according to this one statistic, EDMC is fairly reasonably valued.
Other statistics on Yahoo show that EDMC has 74.04 million shares outstanding with 71.60 million of them that float. Currently, as of 4/8/05, there are 971,000 shares out short, representing 1.36% of the float, or 2.232 trading days of volume. The short situation does not appear to be a significant factor for this stock.
No cash dividend is reported, and the last stock dividend was a 2:1 split reported by Yahoo last December 23, 2003.
How about "technicals"? That is, what does the chart look like? I turn to Stockcharts.com for a
"Point & Figure" chart on EDMC. The graph looks nice to me with some weakness in September, 2001, when the price dropped from $23 range down to a low of $11.50. However, the stock has been steadily appreciating since, to the current $28 range.
In summary, the stock is making a nice move higher today on the back of a solid earnings report last night. The company has been growing steadily the past five years with both revenue and earnings growing in an uninterrupted fashion. Free cash flow is positive and appears to be growing if not completely consistently. And the balance sheet is o.k. but not perfect, but with the free cash flow growing, I expect this to improve. In fact valuation is quite reasonable and the 5-Yr estimated PEG is under 1.0.
This is a bit of a different stock, a private educational firm, not just another of my medical stocks I like to evaluate, but the numbers like good, and if I were in the market to buy a stock, this one might just be on my list :).
Thanks again for visiting. I hope that my chatter is helpful to you in some fashion. Always remember, that I am an amateur investor so please get professional assistance before using any of this information for investment decisions for your own portfolio. If you have any questions, or comments, please feel free to leave them right here on the blog or email me at bobsadviceforstocks@lycos.com.
Bob
Tuesday, 3 May 2005
"Revisiting a Stock Pick" Amedisys (AMED)
Hello Friends! Thanks so much for stopping by and visiting my blog,
Stock Picks Bob's Advice. Please always remember that I am an amateur investor so please, as I always suggest, consult with your professional investment advisors prior to making any investment decisions based on information on this website!

Looking through the lists of top % gainers today, I didn't see any new stocks that really fit my strategy and came across one that after checking, I realized I wrote up last year! Amedisys (AMED) had a great day today, closing at $33.84, up $3.21 or 10.48% on the day! I first
posted Amedisys on Stock Picks on 6/21/04 when it was trading at $30.74. Thus, the stock really hasn't gotten away from us!
I do not own any shares of AMED or have any options, nor does any member of my family!

According to the
Yahoo "Profile" on Amedisys, AMED "...is a multi-state provider of home healthcare nursing services."
As is so often the case, what drove the stock higher today was a
1st quarter 2005 earnings report which was reported just prior to the market opening today. For the quarter ended March 31, 2005, net service revenue increased by 49% to $70.4 million from $47.3 million last year. Net income came in at $7.1 million or $.45/diluted share, up from $4.2 million or $.34/diluted share last year. The company also increased guidance for 2005. This was a great stock report and the market liked what it saw!
How about longer-term? I strongly believe that it is the persistence of revenue and earnings growth that propels a stock higher....and that an extended period of prior growth is as good an indication as any of future persistence of the same results.
For this longer-term result I like to turn to Morningstar. In particular, I find the
"5-Yr Restated" financials on Morningstar the most helpful. Here we can see that except for a dip in revenue from $97.4 million in 1999, to $88.2 million in 2000, revenue has grown strongly from that level to $204.8 million in the trailing twelve months (TTM).

Earnings, however, have been a bit erratic dropping from $.87 in 2000 to a low of $.08/share in 2002, but since then have been improving strongly to a level of $1.43 in the TTM.
Free cash flow has also been steadily growing from $(2) million in 2001, $12 million in 2002, $20 million in 2003 and $27 million in the trailing twelve months.
The balance sheet is very pretty with $93.2 million in cash, enough to pay both the $40 million in current liabilities and the smallish $6.9 million in long-term liabilities, approximately two times over. In addition, AMED has another $22.0 million in other current assets.
What about some "valuation" statistics and other measurements on AMED? Looking at
Yahoo "Key Statistics" on Amedisys, we can see that this is a 'small' mid-cap stock with a market capitalization of $519.78 million. The trailing p/e is reasonable at 22.40 and the forward p/e (fye 31-Dec-06) is even nicer at 15.74 (based on estimates), and thus the 5-yr estimated PEG is 1.13.
Price/sales is 2.07. Although seemingly reasonable, compared to other stocks in the "Home Health Care" group, this is a bit steep. Matria Healthcare (MATR) has a price/sales ratio of 1.5, Option Care (OPTN) is at 1.1, American Healthcare Group (AHG) is at 1.0, and Hooper Holmes (HH) is at 0.7.
Yahoo shows that AMED has only 15.36 million shares outstanding with 10 million of them that float. Of these, there were 2.01 million shares out short as of 4/8/05, down from 2.06 million the prior month. However, this represents 20.10% of the float or 6.301 trading days of volume. As the stock moves higher, this relatively large short interest may well help propel the stock to even higher levels as the "short" sellers return to cover!
Finally what does the chart look like? Taking a look at the the chart,
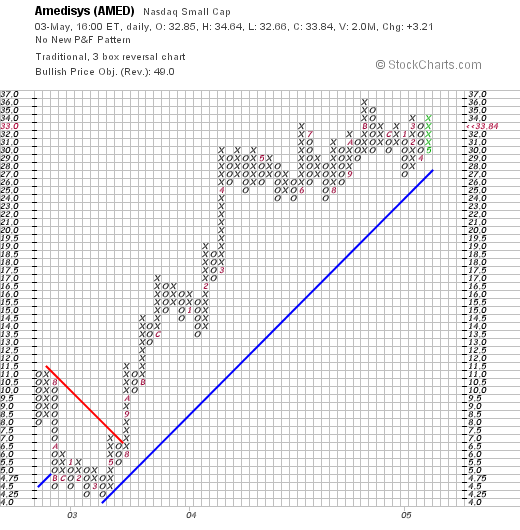
it actually looks quite strong since February, 2003, when the stock price was bottoming at around $4.25. Since then, the price has climbed steadily to the $33.84 level.
So what do I think? Well, in summary, the stock made a nice move higher today on a strong quarterly report. As a plus, the company guided higher yet. The revenue record is solid, the earnings are more erratic, the free cash flow is attractive, and the balance sheet is solid. Valuation-wise, the p/e and PEG are reasonable. Turns out the Price/Sales ratio makes AMED appear a bit pricey. The graph looks great!
Now, if I were in the market to buy some stock I might just be picking up some shares of this one! However, since I am just sitting on my hands, waiting for a partial sale at a gain as a 'signal' to purchase another position, well, I just won't be buying anything anyhow! Thanks again for stopping by! If you have any comments or questions, please feel free to elave them right here on the blog or email me at bobsadviceforstocks@lycos.com.
Bob
Posted by bobsadviceforstocks at 10:38 PM CDT
|
Post Comment |
Permalink
Updated: Tuesday, 3 May 2005 10:55 PM CDT
Monday, 2 May 2005
May 2, 2005 Moldflow (MFLO)
Hello Friends! Thanks so much for stopping by and visiting my blog,
Stock Picks Bob's Advice. As always, please remember that I am an amateur investor, and you need to check with your professional investment advisors prior to acting on any information on this website. I cannot be responsible for your losses any more than I shall be entitled to your gains when you trade. I make these observations for my own education and enjoy sharing them with you!

Looking through the
list of top % gainers on the NASDAQ today, I came across Moldflow (MFLO) that closed at $13.93, up $1.15 or 9.00% on the day. I do not own any shares or options of this stock nor do any members of my family.
According to the
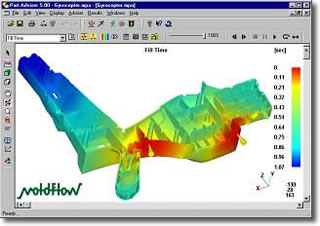
Yahoo "Profile" on MFLO, Moldflow Corporation "...is a provider of software products and hardware solutions for the optimization and automation of plastics-focused manufacturing."
On April 28, 2005, Moldflow
announced 3rd quarter 2005 results. For the quarter ended March 26, 2005, revenue came in at $15.9 million, a 20% increase over the $13.3 million the prior year same quarter. Net income came in at $2.05 million, up 300% from the $509 thousand the prior year. On a per diluted share basis this came in at $.17/diluted share, up over 200% from the $.05/diluted share the prior year.
How about longer-term? Has Moldflow shown persistence of earnings and revenue growth? For this, as always, I turn to Morningstar for the
"5-Yr Restated" financials. Here we can see that revenue was a bit erratic, but grew from $27.4 million in 2000 to $58.8 million in the trailing twelve months.
Earnings have also been erratic, dropping from $.35/share in 2001 to a loss of $(.01)/share in 2003, but then increasing strongly since then in line with the revenue growth to $.43/share in the trailing twelve months (TTM).
How about Free Cash Flow? Also slightly erratic, this dropped from $3 million in 2002 to -0- in 2003, then increased back to $5 million in 2004.
And the balance sheet? Again solid. MFLO has $52.9 million in cash, enough to cover both the $22.5 million in current liabilities and the $1.8 million in long-term liabilities combined more than two times over. In addition, Morningstar.com reports an additional $18.9 million in other current assets!
What about "valuation" and other "key statistics"? For this, I like to refer to
Yahoo "Key Statistics" on MFLO.
Some pertinent facts about this company include the fact that it is virtually a micro cap stock with a market capitalization of $149.82 million. The trailing p/e is reasonable at 24.74, and the forward p/e is listed at 20.49, with a 5-Yr PEG of 1.15. Price/sales is also moderate at 2.24.
Yahoo reports 10.76 million shares outstanding with 10 millio of them that float. There are only 12,000 shares out short representing 0.12% of the float or 0.375 trading days as of 4/8/05. There was no cash nor any stock dividends reported on Yahoo.
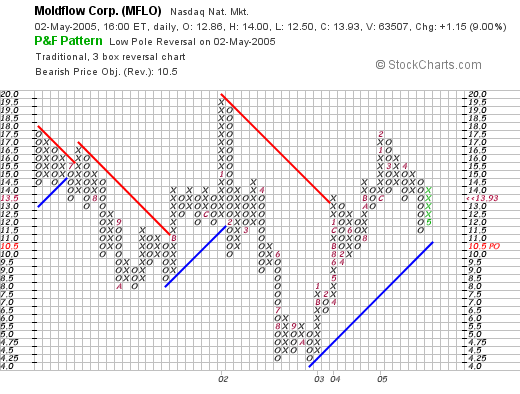
How about a chart? What do the technicals look like? If we look at a
MFLO "point & figure" chart from Stockcharts.com, we see what looks like a very horizontal chart, with the stock going nowhere between July, 2001, and April, 2005. The stock broke down in late 2002 to the $4.25 level, and has, in fact, been trading higher, breaking through a resistance level at $13 in January, 2004, and trading steadily higher since then with the recent close at $13.93. I have certainly seen stronger-looking charts, but certainly, I would not say the stock price is over-extended!
So what do I think? Well the latest quarterly report was outstanding, the last five years has seen significant growth in earnings and revenue, especially the last three years. Free cash flow is positive, the balance sheet is quite clean, and the valuation looks reasonable.
On the downside, the stock is fairly thinly traded with a small capitalization. The chart looks just fair.
In any case, I don't have any money to buy any stocks anyhow, but this stock is an interesting company and I shall be putting it on my "back burner."
Thanks so much for stopping by! If you have any questions or comments, please feel free to leave them right here on the blog or email me at bobsadviceforstocks@lycos.com.
Bob
Posted by bobsadviceforstocks at 5:39 PM CDT
|
Post Comment |
Permalink
Updated: Monday, 2 May 2005 9:46 PM CDT
Saturday, 30 April 2005
"Looking Back One Year" A review of stock picks from the week of March 8, 2004
Hello Friends! Thanks so much for visiting my blog,
Stock Picks Bob's Advice. As always, please remember that I am an amateur investor sharing with you my observations on the market and stocks in particular. Please consult with a professional investment advisor prior to making any decisions based on information on this website. I shall not ask for any credit for your profits earned through stock picks on this site, nor can I accept any blame for your own decisions using similar information!
One thing that I do like to do on weekends, is to review past stock selections. In that way, hopefully, I can tell whether my philosophy even works! And how it does or doesn't succeed in picking stock winners.
These reviews assume a "buy and hold" strategy for assessing returns. In practice, I actually use a far more disciplined system of selling my losing stocks quickly and selling portions of my winning stocks slowly. Also, when I review selections, I have been using a "thumbs-up" and a "thumbs-down" on latest earnings reports. Stocks only get a "thumbs-up" when both earnings and revenue are growing. This should not be construed as a comprehensive buy or sell recommendation on this or any stock, just my take on whether the report would still fit into my own philosophy of picking stocks!

I
posted Total System Services (TSS) on Stock Picks on March 8, 2004, when it was trading at $22.30. TSS closed at $24.58 on 4/29/05, for a gain of $2.28 or 10.2%.
On April 19, 2005, TSS
reported 1st quarter 2005 results. l For the quarter ended March 31, 2005, total revenue came in at $350.0 million, up 22.7% from $285.2 million in the same quarter in 2004. Net income grew 41.7% to $46.1 million from $32.6 million the prior year. On a diluted eps basis this was up 41.7% to $.23/share up from $.17/share in 2004. TSS went on to raise guidance for 2005 with net income growth to be in the range of 22-25%, and revenue growth in the 30-33% range.

On 3/9/04, I
posted ResCare (RSCR) on Stock Picks when it was trading at $11.01. RSCR closed at $14.29 on 4/29/05, for a gain of $3.28 or 29.8%.
On April 27, 2005, RSCR
reported 1st quarter 2005 results. Revenue for the quarter ended March 31, 2005, grew 5% over the prior year to $258.7 million. Net income for the quarter increased 28% to $5.7 million or $.18/diluted share from $4.4 million or $.17/diluted share the prior year. In addition, the company raised guidance, another positive development, for 2005.

Finally, on March 14, 2004, I
posted Somanetics (SMTS) on Stock Picks when it was trading at $11.50. SMTS closed at $13.30 on 4/29/05 for a gain of $1.80 or 15.7%.
On March 15, 2005, SMTS
reported 1st quarter 2005 results. For the quarter ended February 28, 2005, net revenues jumped 51% to $4.0 million. Net income increased 192% to $854,433 from $292,744 in the first quarter 2004. A provision of $290,507 for income taxes, reduced net income down to $563,926, which was still ahead of 2004. On a diluted, per share basis, this worked out, even with the tax allocation to $.05/share, up 66% from $.03/share the prior year. The company also raised net revenue guidance in 2005 to between 47 and 52% over the 2004 results.
So how did we do that week a bit over a year ago? Assuming a buy and hold strategy, we had three picks that week (I didn't buy any of those issues), with an average gain of 18.6%. Really not too bad at all!
Thanks so much for visiting! If you have any comments or questions please feel free to leave them right here on the blog or email me at bobsadviceforstocks@lycos.com.
Bob
Newer | Latest | Older


