Stock Picks Bob's Advice
Saturday, 11 June 2005
A Reader Writes "Could you tell me....?"

Hello Friends! Thanks so much for stopping by and visiting my blog,
Stock Picks Bob's Advice. As always, please remember that I am an amateur investor, so please consult with your professional investment advisors prior to making any investment decisions based on information on this website.
I had a nice email a few days ago that I would like to share with you! (If you have any questions or comments, please feel free to email me at bobsadviceforstocks@lycos.com.
William Z. wrote:
Thank you very much to share your thought. It is great analysis.
If you do not mind, could you tell me the ratio of your pick (winners/losers) and/or rate of return?
Thank you very much!
William Z
First of all, thank you William for your kind words. I like to share with you all my basic understanding of stocks and this helps me to evaluate stocks as well.
Unfortunately, I do not have the ratio of my picks (winners/losers) to share with you. I also do not have the rate of return. All of this information can be calculated because all of my past picks are located on the blog and organized by date along the left side of the page.
I suppose if anyone was ambitious enough, it wouldn't be hard to set up a spread sheet and calculate all of that out. It would also be interesting to calculate what the rate of return would be if we also applied my own personal selling strategy: selling losers quickly, and selling gainers slowly at targeted percentage gains.
But I don't have that information either :(.
What I do have, is the weekend review, where I look at stocks with about a trailing one year period, one week at a time, assume a buy and hold strategy, and calculate return.
Another thing I do is post my trading portfolio, which is accessible in a link along the left side of the blog, and keep readers updated with all of my trades and the current performance of my actual portfolio. I also have a "fantasy" mutual fund with marketocracy, and I use a rough form of portfolio management with my RMF fund. You can view the performance of that fund as well with a link along the left side of the blog.
Please remember that I am an amateur investor. If things continue to grow around here, I am sure that I will be able to get somebody to help me set up that other report. Meanwhile, I hope that my thinking stimulates you to thinking about stocks in an organized fashion. Please let me know if and how the information I write is helpful to you!
Again, remember I am an amateur. Consult with your professional investment advisors, and follow up with all investment suggestions with your own investigation.
Regards!
Bob
Friday, 10 June 2005
Boston Beer (SAM)
Hello Friends! Thanks so much for stopping by and visiting my blog,
Stock Picks Bob's Advice. As always, please remember that I am an amateur investor, so please consult with your professional investment advisors prior to making any investment decisions based on information on this website!

Looking through the
list of top % gainers on the NYSE today I came across The Boston Beer Company (SAM), which closed today at $23.08, up $1.57 or 7.30% on the day. I do not own any shares of SAM nor do I own any options.
According to the
Yahoo "Profile" on SAM, The Boston Beer Company "...engages in brewing and selling malt beverages and hard cider products primarily in the United States. It offers beers under the Samuel Adams name, flavored malt beverage products under the Twisted Tea name, and cider products under the HardCore Cider name with a focus on Samuel Adams Boston Lager, Sam Adams Light, and Samuel Adams Seasonal Beers."
What drove the stock higher today was an
analyst upgrade from Prudential, raising the stock to an "overweight" from "neutral".
Boston Beer
reported 1st quarter 2005 results on May 3, 2005. Net revenues increased 9% to $48.7 million from $44.7 million. Net income jumped 200% to $4 million or $.27/share, up from $1.3 million or $.09/share the prior year same quarter. The company forecast full year earnings of $.94 to $1.00/share for 2005. This was in line with analysts' expectations of $.99/share for the year.
How about longer-term results? Looking at the
Morningstar.com "5-Yr Restated" financials we can see a pattern of revenue growth, albeit somewhat inconsistent, from $190.6 million in 2000 to $221.3 million in the trailing twelve months (TTM).
Earnings have been a bit erratic as well dropping from $.62/share in 2000 to $.47/share in 2001. However, earnings have grown steadily since 2001, reaching $1.04 in the TTM.
Free cash flow has been positive and slowly growing, again a bit inconsistently, from $12 million in 2002 to $15 million in the TTM.

The balance sheet, as presented on Morningstar, looks excellent with $62.4 million in cash. The cash alone is able to cover both the $28.1 million in current liabilities as well as the $2.3 million in long-term liabilities. In addition, Morningstar reports SAM with an additional $30.7 million in other current assets.
How about other valuation statistics? Taking a look at the
"Key Statistics" on SAM from Yahoo, we can see that this is a small cap stock with a market capitalization of only $329.84 million. The trailing p/e is a moderate 22.19, with a forward p/e of 20.42. The PEG is a bit rich at 1.81.
The stock is reasonably priced with a Price/Sales ratio of 1.4. As compared to other companies in the "Beverages-Brewers" Industry group, at the top is Anheuser Busch (BUD) at 2.5, Comp de Bebidas das Americas (ABV) is 2.1, Diageo (DEO) came in at 2, Molson (TAP) at 0.8, and Fomento Economico Mex (FMX) came in at 0.7.
Other additional statistics, include the 14.29 million shares outstanding with a float of only 9.06 million shares. As of 5/10/05, there were 392,550 shares out short representing 2.90% of the float or 8.2 days of average trading volume. This appears a bit significant (using my arbitrary 3 day cut-off), and may be contributing to the current price rise.
No cash nor any stock dividends are reported on Yahoo.
What about a chart? Looking at a
Stockcharts.com "Point & Figure" chart on SAM:
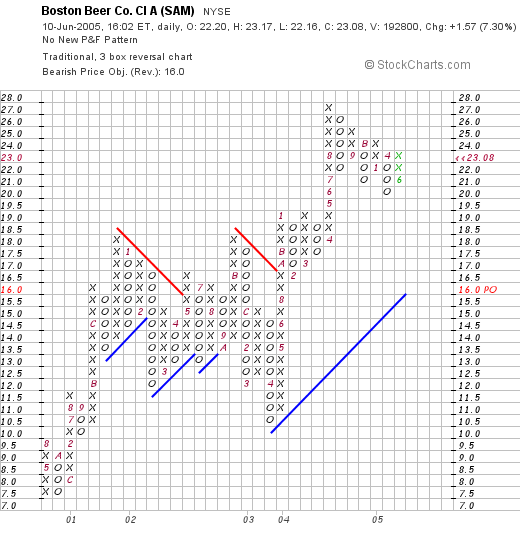
we can see that this stock has been strong since mid-2000, when it was trading to as low as $7.50. The stock moved higher over the next two years, but appeared to break down n price in April 2003, when it hit an intermedicate low at $10.50. The stock has traded higher since and the graph, to me, looks solid.
So what do I think? First of all, a stock upgrade, like today is always helpful. Last quarter's revenue and earnings growth was solid. The past five years, while a bit erratic, show a trend towards higher revenue and earnings growth. The free cash flow is nice and the balance sheet is gorgeous. Valuation appears reasonable, and I suspect the PEG is a bit overstated, especially if the earnings growth like the last quarter can be repreated. Now, if I only had some cash to spend :).
I shall defer to all of you the readers on whether the beer itself is good :).
Thanks so much for stopping by and visiting. If you have any questions or comments, please feel free to post them here on the blog or email me at bobsadviceforstocks@lyco.com.
Have a great weekend everyone!
Bob
Wednesday, 8 June 2005
June 8, 2005 Balchem (BCP)
Hello Friends! Thanks so much for stopping by and visiting my blog,
Stock Picks Bob's Advice. Needless to say, I am an amateur investor, so please consult with your professional investment advisors prior to making any investment decisions based on information on this website.

The market is closed, and scanning the top % gainers on the NYSE and the NASDAQ, I didn't see any new names that I felt were worth posting here this afternoon. However, on the
AMEX list of top % gainers today, I came across Balchem (BCP) which closed at $29.50, up $1.12 on the day or 3.95%. I do not own any shares or options in Balchem.

According to the
Yahoo "Profile" on Balchem, the company "...engages in the development, manufacture, and marketing of specialty performance ingredients and products for the food, feed, and medical sterilization industries in the United States and internationally. It operates in three segments: Specialty Products, Encapsulated/Nutritional Products, and BCP Ingredients."
On April 28, 2005, BCP
announced 1st quarter 2005 results. Net sales grew 23.6% for the quarter ended March 31, 2005, to $19.3 million, from $15.6 million in the prior year. Net earnings for the quarter came in at $2.6 million, a 41.4% increase over $1.8 million reported the prior year. On a diluted net earnings per share basis this came in at $.32/share, up 33% from the $.24/share reported in the prior year. These were solid results imho!
How about longer-term results? Reviewing the
"5-Yr Restated" financials on BCP from Morningstar.com, we can see that revenue has grown steadily from $33.2 million in 2000 to $67.4 million in 2004.

Earnings have been a bit more erratic, growing from $.52/share in 2000 to $1.00/share in 2002, dropping to $.75/share in 2003, but improving from that time.
As reported by Morningstar, free cash flow has improved from $0 in 2002 to $11 million in the trailing twelve months (TTM).
The balance sheet of this small company is solid, with $12.7 million in cash, enough to cover both the $5.7 million in current liabilities and the $4.5 million in long-term liabilities combined. In addition, BCP reports an additional $16.5 million in other current assets.
How about some statistics on this company? Looking at
Yahoo "Key Statistics" on BCP, we can see that this is a small cap stock with a market capitalization of only $227.09 million.
The trailing p/e is 26.32, and the forward p/e (fye 31-Dec-06) is more moderate at 17.77. No PEG is noted, I assume due to the lack of any analysts making predictions about earnings.
The Price/Sales ratio reported on Yahoo is 3.07. BCP is actually the priciest of its group of "Specialty Chemicals" stocks at a 3.1 Price/Sales level. Other companies in this group included Sigma Aldrich (SIAL) at 2.9, Monsanto (MON) at 2.8, Cabot Microelectronics (CCMP) at 2.6, Lubrizol (LZ) at 0.8, and Lyondell Chemical (LYO) at 0.6.
Other statistics from the Yahoo site show that there are only 7.70 million shares outstanding with 7.58 million of them that float. Currently (as of 5/10/05) there are only 24,250 shares out short, representing 0.30% of the float or only 1.9 trading days. This is not significant in my book.
The company does pay a small dividend of $.06/share yielding 0.21%. The last stock split, was in January, 2005, when the stock split 3:2.
How about a graph? Taking a look at the
"Point & Figure" chart on BCP from Stockcharts.com:
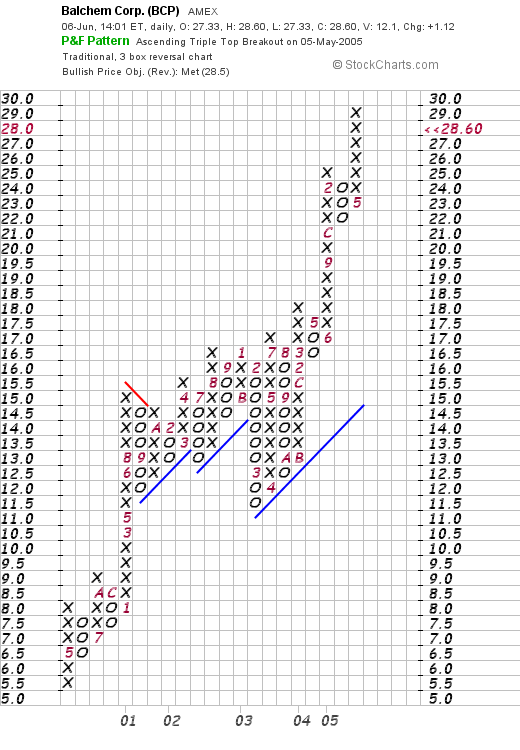
we can see a gorgeous graph going all of the way back to April, 2000, when the stock based at $5.50, and has been climbing ever since to its current level of $29.50. This stock chart has yet to "look back" as it climbs higher!
So what do I think? Well, except for the fact that the stock is such a small company with a relatively small float, and that the Price/Sales ratio is a bit rich, the company is doing terrific both fundamentally and technically. The latest quarter was quite strong, and the company has been growing fairly steadily the past five years. Free cash flow is positive and growing, and the balance sheet looks nice.
In fact, if I had some cash to invest, and my system indicated to me it was time to buy, then this stock would be high on my list.
Thanks so much for stopping by and visiting. If you have any questions or comments, please feel free to email me at bobsadviceforstocks@lycos.com.
Bob
Tuesday, 7 June 2005
June 7, 2005 Harman International (HAR)

Hello Friends! Thanks so much for stopping by and visiting my blog,
Stock Picks Bob's Advice. As always, please remember that I am an amateur investor, and that you should consult with a professional investment advisor prior to taking any action based on information on this website.
I was looking through the
list of top % gainers on the NYSE today and came across Harman International, which was leading the 'pack', trading at $94.77, up $13.77 or 17.0% on the day! I do not own any shares of Harman, nor do I own any options.
According to the
Yahoo "Profile" on Harman (HAR), the company "...engages in the design, manufacture, and marketing of audio products and electronic systems for the consumer and professional markets."
What pushed the stock higher today was a
news story that came out this morning about two new contracts from Chrysler and Audi, worth more than $500 million in annual revenue combined ($200 million from Chrysler, and $350 million from Audi beginning in 2008).
On April 21, 2005, Harman (HAR) announced
3rd quarter 2005 results. For the quarter ended March 31, 2005, net sales increased 8% to $742.6 million from $690.4 million the prior year. Net income for the quarter was $63.5 million, up 45% from $43.7 million the prior year same quarter. On a per share diluted basis this came in at $.90/share, up 43% from last year's $.63/share.
How about longer-term? Reviewing the
"5-Yr Restated" financials from Morningstar.com, we can see the steady revenue growth, accelerating recently, from $1.7 billion in 2000 to $2.9 billion in the trailing twelve months (TTM).
Earnings have been a bit more erratic, dipping to $.48/share in 2001, from $1.03 in 2000. However, since 2001, HAR has been steadily increasing earnings to the $2.78/share in the TTM.
Free cash flow has been solid and growing, increasing from $65 million in 2002 to $313 million in the trailing twelve months (TTM).
The balance sheet is solid if not overwhelming. The company has $299.9 million in cash and $837.1 million in other current assets. This is plenty to cover both the $643.3 million in current liabilities and the $414.5 million in long-term liabilities combined.
What about "valuation" and other statistics? Taking a look at the
Yahoo "Key Statistics" on HAR, we can see that this is a large cap stock with a market capitalization of $6.18 billion.
The trailing p/e is 30.01, with the forward p/e (fye 30-Jun-06) only 23.97. Thus, with a rapid growth in earnings estimated, the "5 yr expected" PEG is only 1.12.
Price/Sales is reported at 1.85. Using my Fidelity.com research, I found that Harman is sitting in the "Electronic Equipment" industry group. Other companies in this group and their Price/Sales ratios reveals that HAR is reasonably priced: Digital Theater Systems (DTSI) is selling at a P/S of 4.3, Avid Technology (AVID) at 3.1, Echostar Communications (DISH) at 1.8, and Pemstar (PMTR) at 0.1.
Other statistics from Yahoo show that there are 67.35 million shares outstanding with 62.97 million of them that float. Of these, as of 5/10/05, there were 2.03 million shares out short representing 3.30% of the float or 2.4 trading days of volume.
The company has paid a $.05/share dividend yielding 0.06%. The last stock split was a 2:1 split in December, 2003.
How about a chart? Taking a look at a
"Point & Figure" chart from Stockcharts.com:
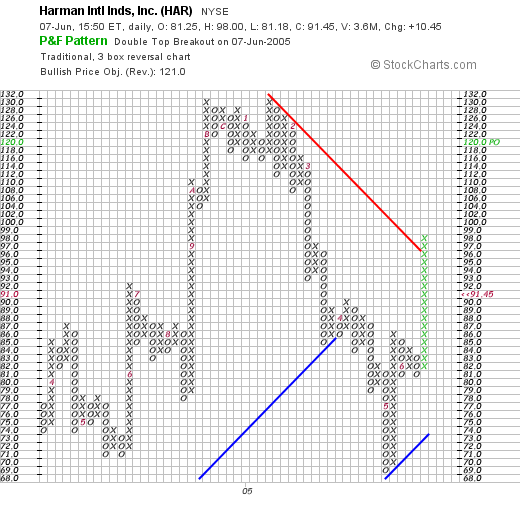
we can see that this stock was trading much stronger throughout 2004, climbing from a low of $71 in May, 2004, to a high of $132 in January, 2005. However, the stock has traded lower since, breaking its support at $86 in April, 2005. Recently, the stock found support as low as $69 in May, 2005, and has been climbing strongly, breaking through resistance at $95. Not exactly an overwhelming show of strength at all, but recently, at least over the short-term, the stock has been trading stronger.
So what do I think? Well, the news today, with possibly $500 million of new business annually by 2008 with Chrysler and Audi is a very bullish announcement. The latest quarter was strong, and the past five years has also shown fairly steady growth. Free cash flow is positive and growing and the balance sheet is reasonably solid.
Valuation-wise, the stock is reasonably priced at this level (imho), with a Price/Sales ratio below average, and a PEG just over 1.0. The chart could look nicer, and is far from impressing me with anything but short-term strength, but except for my own concerns about the automotive business and the chart, the company does look interesting!
Thanks again for visiting. If you have any questions or comments, please feel free to leave them right here on the blog, or email me at bobsadviceforstocks@lycos.com.
Bob
"Trading Transparency" ANF
Hello Friends! Thanks again for stopping by and visiting my blog,
Stock Picks Bob's Advice. As always, please remember that I am truly an amateur investor, so please consult with your professional investment advisors prior to making any investment decisions based on information on this website!
Earlier this morning, my JOSB stock hit the first sale point at a 30% gain from purchase. I sold 60 shares, representing 1/4 of my holdings, and now set out to find a stock on the top % gainers list that might work for me. Abercrombie and Fitch (ANF) is having a nice day again today, trading at $68.12/share, up $2.64 or 4.03% on the day. A few moments ago I purchased 160 shares of ANF at $68.09 in my trading account.
Thanks again for visiting. If you have any comments, questions, or words of encouragement, please feel free to leave them on my blog or email me at bobsadviceforstocks@lycos.com.
Bob
"Trading Transparency' JOSB
Hello Friends! Thanks so much for stopping by and visiting my blog,
Stock Picks Bob's Advice. As always, please remember I am an amateur investor so please consult with your professional investment advisors prior to making any investment decisions based on information on this website.
A few moments ago my Jos A. Banks (JOSB) hit my first sell point, passing my 30% gain target and I sold 1/4 of my position, 60 shares, at $41.76. I acquired these wshares on 4/4/05 at a cost basis of $31.90. Thus, I am now entitled to look for a new position :). That nickel is already burning a hole in my pocket!
Bob
Sunday, 5 June 2005
"Looking Back One Year" A review of stock picks from the week of April 12, 2004

Hello Friends! Thanks so much for stopping by and visiting my blog,
Stock Picks Bob's Advice. As always, please remember that I am an amateur investor, so PLEASE remember to consult with your professional investment advisors before making ANY investment decisions based on information on this website! They are far better qualified than I to know if such investment decisions are appropriate, timely, and likely to be profitable for you!
It is the weekend, and one of jobs I like to accomplish around here is to review picks from the prior year. I work week by week, about a 52 week trailing review, and because I sometimes don't get around to reviewing stocks (can you believe that?), my trailing period is now a bit more than 52 weeks. Currently, I am up to the week of April 12, 2004. That week, I actually only "picked" one stock, Option Care (OPTN) for Stock Picks.

I
posted Option Care (OPTN) on Stock Picks on April 15, 2004, when it was trading at $13.37/share. OPTN had a 3:2 stock split on 4/1/05, thus making my "pick price" actually $8.91/share. OPTN closed at $13.10, for a gain of $4.19 or 47% since the selection price. Thus, my only pick for Stock Picks had a great performance in the subsequent year.

On May 10, 2005, OPTN
announced 1st quarter 2005 results. Results were quite strong with revenue growing 17% to $120.8 million from $103.1 million, slightly ahead of expectations. Earnings increased to $5.3 million or $.16/share, up from $4.3 million, or $.13/share the prior year same quarter.
In addition, the company announced the plan to increase the quarterly dividend by 50% to $.02/share.
This was a strong report for a strong stock pick here on the blog! Thanks again for stopping by and visiting. If you have any questions or comments, please feel free to leave them right here on the blog or email me at bobsadviceforstocks@lycos.com.
Bob
Friday, 3 June 2005
"Trading Transparency" Greif (GEF)
Hello Friends! Thanks so much for stopping by and visiting my blog,
Stock Picks Bob's Advice. As I always like to point out, please remember that I am an amateur investor! So please consult with your professional investment advisors prior to making any investment decisions based on information on this website.
A few moments ago, I sold my 120 shares of Greif (GEF) at $65.49. GEF is currently trading at $64.60, down $(8.90) or (11.95)% on the day! I just purchased GEF on 4/4/05 with a cost basis of $72.34. Thus, I had a loss of $(7.74) or (10.7)%. Since I put my sales in manually, I actually passed my 8% loss limit. Anyhow, out it went. They actually announced earnings which on first glance look solid. But somebody must not have liked what they reported. Regardless, trading rules are trading rules. And my portfolio is ever talking to me now with two sales in two days.
Thanks so much for visiting. If you have any comments or questions, please feel free to post them on the blog or email me at bobsadviceforstocks@lycos.com.
Bob
Thursday, 2 June 2005
"Revisiting a Stock Pick" Abercrombie & Fitch (ANF)
Hello Friends! Thanks so much for stopping by and visiting my blog,
Stock Picks Bob's Advice. Please always remember that I am truly an amateur investor, so please consult with your professional investment advisors to make sure that all investments discussed on this website are appropriate, timely, and likely to be profitable for you!

Looking through the
list of top % gainers on the NYSE today, I saw that Abercrombie & Fitch (ANF) had made the list. As I write, ANF is trading at $65.12/share, up $7.13 or 12.30% on the day. I do not own any shares of this stock nor do I own any options.
I first
posted ANF on Stock Picks on May 28, 2003 when it was trading at $29.07. Thus, we have a gain of $36.05 on that pick which was made just under two years ago, representing a 124% appreciation in stock price!
According to the
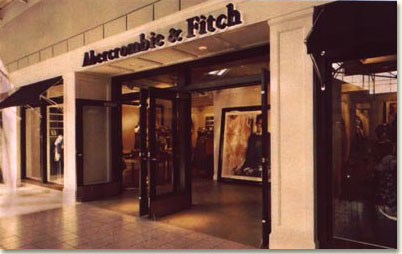
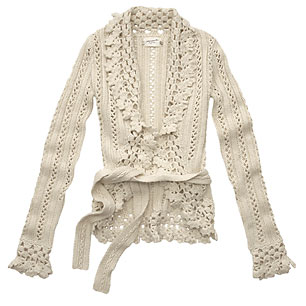
Yahoo "Profile" on ANF, the company "...operates as a specialty retailer of casual apparel in the United States. It operates stores that sell casual apparel for men, women, and kids under the Abercrombie & Fitch, abercrombie, Hollister, and RUEHL brands."
What drove the stock higher today was a
terrific May sales report; the company reported total Company net sales jumped 43%, with total company comparable store sales increasing 29%. Just to get a high single digit same store sales number is great in today's retail climate, but a same store sales number of 29% is incredible!
About two weeks ago, on May 17, 2005, ANF
reported 1st quarter 2005 results. Total company sales for the quarter increased 33% to $546.8 million with a 19% same store sales growth reported for the quarter. Operating income jumped 46% to $68.3 million, and net income per share rose 50% to $.45/diluted share, up from $.30/diluted share in the same quarter in 2004. These were great results!
How about longer-term? Taking a look at the
Morningstar.com "5-Yr Restated" financials, we can see steady revenue growth from $1.2 billion in 2001 to $2.02 billion in the trailing twelve months (TTM).
Earnings have also grown consistently from $1.55 in 2001 to $2.28 in the TTM.
Free cash flow has been positive and growing, albeit not quite as steadily, from $200 million in 2003 to $241 million in the TTM.
The balance sheet is also solid if not overwhelming with $350.4 million in cash and $301.9 million in other current assets; plenty to cover both the $413.9 million in current liabilities and $264.5 million in long-term liabilities.
What about "valuation" and other "key statistics"? Taking a look at
Yahoo "Key Statistics" on ANF, we can see that this is a large cap company with a market capitalization of $5.63 billion.
The trailing p/e isn't bad (imho) at 26.79, with a forward p/e (fye 29-Jan-07) at 17.73. The PEG (5 yr expected) is even nicer at 1.04.
In addition the Price/Sales ratio is 2.32. Withing the "apparel stores" industrial group, ANF is actually the highest Price/Sales stock, with American Eagle (AEOS) at 2.3, Pacific Sunwear (PSUN) at 1.3, Gap (GPS) at 1.1, and Ann Taylor (ANN) at 1.0. So the stock is priced a bit steaper than the competitors....but still look at those same store sales figures!
Taking a look at some other Yahoo statistics, we can see that there are 86.25 million shares outstanding with 85.99 million of them that float. Currently, as of 5/10/05 there are 2.85 million shares out short representing 3.4% of the float or 2.1 trading days of volume. With my arbitrary 3 day cut-off on significance, this doesn't look too bad.
The company does pay a small dividend of $.50/share yielding 0.86%. Yahoo reports the last stock split, a 2:1 split in June, 1999.
What about the chart? Taking a look at the
Stockcharts.com "Point and Figure" chart on ANF:
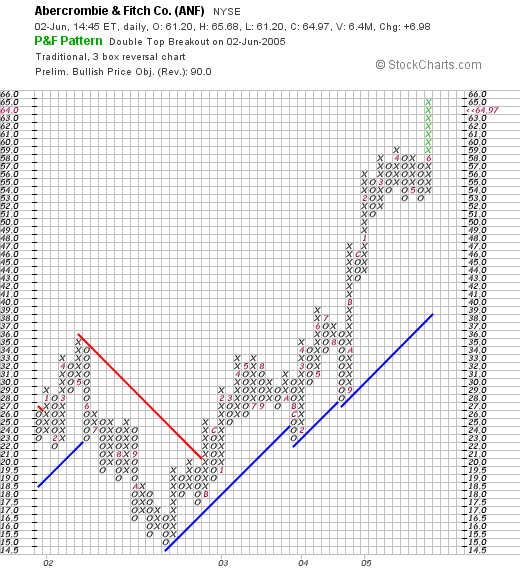
we can see that the stock peaked in May, 2002, around $34/share, then dropped to a low of $15/share in October, 2002. Since that time, the stock has been trading strongly higher and has actually accelerated its ascent since early this year. The graph looks quite strong to me. I can never tell if it is overextended, but the stock is trading above its support line.
So what do I think? Well, I wish I had purchased some of those Abercrombie shares in 2003! I still don't own any :(. The same store sales numbers are incredible! In fact, the 19% same store sales numbers the latest quarter not including this month are also amazing! The last quarter was great, the last five years have been strong, the free cash flow is solid, the balance sheet is great, valuation-wise, the p/e and PEG are where I like them. The Price/Sales is a bit rich next to similar stocks, but I don't think those other stocks are reporting numbers like Abercrombie. And the graph is strong.
There isn't much not to like imho. Now, if I could sell something at a gain, then I could be adding another issue in here :). Oh well. Back to sitting on my hands....waiting.
Thanks again for stopping by. Please feel free to leave any comments or questions right here on the blog or email me at bobsadviceforstocks@lycos.com.
Bob
"Trading Transparency" CMN
Hello Friends! Thanks so much for stopping by and visiting my blog,
Stock Picks Bob's Advice. As always, please remember that I am an amateur investor, so please consult with your professional investment advisor prior to making any investment decisions based on information on this website.
A few moments ago, I unloaded my remaining shares of Cantel Industries (CMN), a great company that apparently disappointed today with their
3rd quarter 2005 earnings results. Cantel came in at $.23/share, which was a penny lighter than the previous quarter and which were $.03/share under estimates.
I did not sell on the news however. I sold on the fact that the stock was down sharply and hit a sale point of mine. These 150 shares had a cost basis of $13.36/share, and I have previously sold four times portions of stocks up to a 120% gain on the shares. They were acquired on 6/4/04, almost exactly a year ago, so they haven't been a bad performer at all in my portfolio.
The 150 shares were sold a few moments ago at $20/share, so I actually had a gain of $6.64/share or 49.7%. This is in addition to the other four partial sales that I have already made on this holding! I sold because my last sale was at the 120% point, and at the current price, CMN is as I write trading at $19.40/share, the stock has dropped below my "trailing 50% of my greatest sale point", that is it dropped below 60% gain level, and my "strategy" requires I unload the stock.
Especially with my margin level, this preserves my gain. However, I shall now be sitting on my hands with the proceeds, waiting for a sale at a gain to add a new position.
Bob
Newer | Latest | Older


