Stock Picks Bob's Advice
Saturday, 2 July 2005
A Reader Writes "Can I get your opinion on the company EZPW?"
Hello Friends! Thanks so much for stopping by and visiting my blog,
Stock Picks Bob's Advice. As always, please remember that I am an amateur investor, so please consult with your professional investment advisors prior to making any investment decisions based on information on this website.

Looking through my mail, I found a question from S.Y.L., who was interested in learning about a company EXPW. SYL wrote:
Hi,
Can I get your opinion on the company: EZPW? I completely understand that you are not a professional, but I'm still interested in getting an opinion from a more seasoned investor than me. I found this one doing some basic screening and it looks quite good. Good earnings growth, low debt, and very very low valuation ratios. Am I missing anything or is this stock as good as it seems to me? Please be as open as possible. I'm interested in hearing about how you would go about researching this company further.
I'm looking forward to your reply.
Regards,
SYL
Thanks so much for writing again SYL! I will tell you how I go about looking at a stock, but this is certainly not the only way!

EZPW stands for Ezcorp, Inc. EZPW closed at $11.03, up $.28 or 2.60% on 7/1/05. According to the
Yahoo "profile" on EZPW, the company "...operates pawnshops and payday loan stores in the United States."
My first step is to check the latest quarterly report. On April 20, 2005, EZCORP (EZPW)
announced 2nd quarter 2005 results. Some of the basic things I look at are: revenue growth and earnings. For the quarter ended March 31, 2005, EZPW reported revenue growth of 8% to $63.1 million compared with $58.3 million the prior year. Net income jumped 32% to $4.0 million ($.29/share) compared with $3.0 million ($.23/share) the prior year same period. These appeared to me to be fairly solid results.
Generally, my next step in the process is to go over to Morningstar.com, in particular the "5-Yr Restated" financials, which for EZPW is located
here. By the way, I do not own any shares or options in EZPW, nor am I "picking" this stock for my blog. I just want to answer a question from a reader!
The financials show some good information and are also deficient for this particular stock. We can see on the Morningstar page that revenue, except for a small drop between 2000 and 2001, has been steadily increasing. $197.4 million was reported in revenue in 2000, dropping to $186.2 million in 2001, but has increased each year to the $235.9 million in the trailing twelve months (TTM).
Earnings have also steadily improved, increasing from a loss of ($2.71) in 2000 to a net positive income of $.90/share in the TTM.
Free cash flow appears to be positive if we can apply a mathematical subtraction of capital spending from operating cash flow, however, I don't extrapolate anything on these financial reports on my blog. In fact, the balance sheet is also absent from Morningstar. You might be able to get this information elsewhere, but relying on Morningstar, I generally avoid stocks completely with incomplete financial reports. There are plenty with complete numbers to choose from!
My next step is to review some basic parameters of this company. For this purpose, I like to use
Yahoo "Key Statistics" on EZPW. Here we can see that this company is virtually a "micro-cap" stock with a market capitalization of only $137.07 million.
As you noted in your question, the P/E is certainly cheap at 12.21, with a forward p/e of 8.48. Thus the company has a PEG ratio of only 0.52. Price/sales is also cheap at 0.56.
EZPW has only 12.43 million shares outstanding with 11.10 million that float. Currently there are only 183,010 shares out short, representing 1.70% of the float or only 1.1 trading days of volume. No cash dividends and no stock dividends are noted on Yahoo.
Finally, I like to take a look at a "Point & Figure" chart from Stockcharts.com. For EZPW, this is located
here.
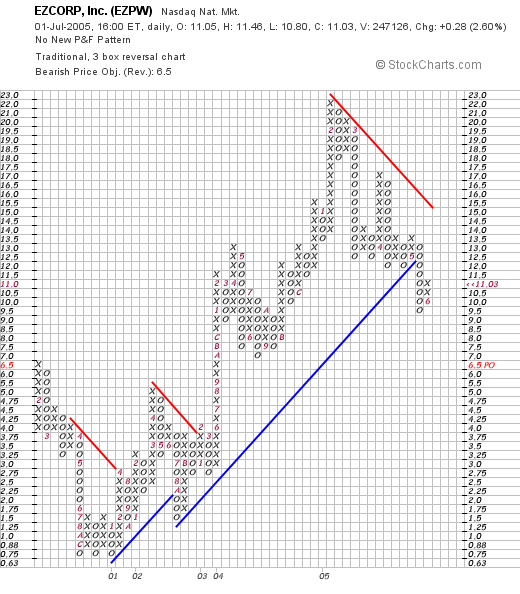
Here we can see that the stock bottomed at around $.75/share in late 2000. The stock has been moving higher recently, with a peak at $22 recorded in February, 2005. The stock has actually been looking weaker recently, with a breakdown, decline below the "support" line at $11.50 in May, 2005. The stock appears to be still trading weakly.
So what do I think of this stock? I like the recent quarterly report, the five year growth in revenue in earnings, and the valuation. Things I am uncomfortable with regarding this stock is the tiny nature of the company, the fact that possibly because of the size, I do not have any reported free cash flow, nor is the balance sheet specified. With the graph looking weak, I would not be inclined to be buying any of these shares. In addition, I suspect that the stock might be looking weak due to concerns over tightening of credit market with the repeated increases in the interest rates by the "Fed". But I frankly don't know!
In conclusion, this stock is an interesting candidate but I just don't have enough information to recommend this stock. I am unable to get all of the information that would help me make an investment.
Thanks again for stopping by and taking the time to write me a question! If you or anyone else have questions regarding a stock or one of my posts, please feel free to email me at bobsadviceforstocks@gmail.com.
Bob
Wednesday, 29 June 2005
A Reader Writes "Why does the percent gain appeal to you?"
Hello Friends! Thanks so much for stopping by and visiting my blog,
Stock Picks Bob's Advice. As always, please remember that I am an amateur investor, so please consult with your professional investment advisors prior to making any investment decisions based on information on this website.
I was checking my mail this evening and I found an interesting question from S.Y.L. who writes:
Bob,
Greetings from Minnesota. I have become a regular reader of your blog
recently, after finding a link to it from the blog at Wealthcast.com. What
interests me most about your stock picking ways is that they closely
resemble my own, except for one thing which I wanted to ask you about. A
good starting point for me is Yahoo! Finance's volume leaders list. It
interested me to learn you take a different approach, and look at Yahoo!
Finance's percent gainers list. Why does the percent gain appeal to you?
I'm very interested in reading your reply.
Good night
Regards,
S.Y.L.
First of all, thanks so much for writing! I have been fortunate to receive a link from Jack Rothstein who is a well-regard professional investment advisor, so this might be a great question for him as well :). However, since this is
my strategy, I probably should try to tackle this question.
A few years back, before the dot.com "bust" I found that I could literally buy stocks on the top percentage gaining lists and sell them the same day a few hours later for a profit. What I realized was that many of these stocks have what we refer to as "price momentum" and after these large gains, would have a high probability to go higher yet.
More recently, I have used this "price momentum" screen, as we could call it, as a starting point. In other words, it is my belief that among these strong stocks, there may be things we can determine that will allow us to more safely predict that stocks like these will continue to advance. At least
that is my working hypothesis.
Thus, after looking at stocks on the top % gainers list, I go on to check some very important fundamental issues, like earnings and revenue growth, free cash flow, and the balance sheet. With these looking positive, I make my educated "guess" that the stock is likely to be moving higher and that today's price action is not a fluke.
Is high volume a good or better indicator? I really don't know. I don't know if what I am doing will be successful long-term. I don't know if there are many better ways to pick stocks. There is so much that I don't know!
However, thus far, I have been pleased with the results I have experienced with this approach and if you go through the many stocks I have examined, I am sure that you will find among them some of the strongest stocks in the market the past couple of years!
I hope this answers your question. I am sure that you can tell by my answer that I am truly an amateur investor! If you have another approach, and think it is maybe "better", please feel free to email me and let me know how you approach stock picking and how your results have been!
Bob
"Revisiting a Stock Pick" Millipore (MIL)
Hello Friends! Thanks so much for stopping by and visiting my blog,
Stock Picks Bob's Advice. As always, please remember that I am an amateur investor, so please consult with your professional investment advisors prior to making any investment decisions based on information on this website.
As the number of stock picks discussed on this blog grows, I find it helpful to revisit prior stock picks when they once again meet the criteria that I use to pick stocks on this website. In fact, one can think of this as a "reconfirmation" of a stock pick, that is, the stock once
again is identified in the screens that I use. In general, I prefer to allow a year to pass by before re-discussing any of the stock selections on the blog.

On January 27, 2004, I
posted Millipore (MIL) on Stock Picks at a price of $50.87. MIL is currently trading at $57.40, up $3.05 or 5.61% on the day. The stock has appreciated $6.53 or 12.8% since posting in 2004.
I identified Milliopore (MIL) on the
list of top % gainers on the NYSE today, and on review, the story is intact. I do not own any shares or options in Millipore.
As I like to do when examining a possible stock for inclusion on this blog, is to check the latest quarterly results. On April 21, 2005, MIL
reported 1st quarter 2005 results. First quarter sales came in at $250 million, up 12% from $222 million in the same quarter last year. Earnings came in at $32.3 million or $.64/diluted share, up 16% from the $27.2 million or $.55/diluted share reported in the same quarter in the 2004 fiscal year.
For a longer-term perspective, let's take a look at the
"5-Yr Restated" financials from Morningstar.com. Here we can see a very nice picture of steady revenue growth from $600 million in sales in 2000, steadily growing to the $911 million reported in the trailing twelve months (TTM).
Earnings have been a little less steady, dropping from $2.53/share in 2000 to $.65/share in 2001, but increasing each year thereafter to the current $2.19 in the TTM.
Free cash flow has also been steadily growing in the last several years from $28 million in 2002 to $116 million in the TTM.
Morningstar.com shows the balance sheet for MIL to be solid with $141.3 million in cash and $393.2 million in other current assets, plenty to cover both the $149.9 million in current liabilities and the $196.4 million in long-term liabilities.
Considering "valuation" issues on this stock,
"Key Statistics" from Yahoo shows that Millipore (MIL) is a large cap stock with a market capitalization of $2.85 billion. The trailing p/e is moderate at 25.93, and the forward p/e (fye 31-Dec-06) is nicer at 20.67. Thus, the "5 yr expected" PEG is 1.57. (with a PEG of 1.0 considered an ideal valuation for a stock with the Price/earnings ratio commensurate with the growth rate).
Yahoo reports the Price/Sales ratio as being 2.98. Referring to my Fidelity brokerage research, we can see that MIL is priced midway, insofar as the Price/Sales ratio is concerned, in the "Scientific/Tech Instruments" Industry. At the top is Garmin (GRMN) with P/S ratio of 5.7, Flir (FLIR) at 4.3, followed by MIL at 3.0, Applied Biosystems (ABI) is lower at 2.2, Beckman Coulter (BEC) at 1.6, and Agilent (A) at 1.6.
Other statistics from Yahoo on MIL reveal that this company has 49.94 million shares outstanding with 49.83 million of them that float. As of 5/10/05, there were 1.45 million shares out short representing 2.90% of the float or 2.1 trading days of volume (the "short ratio"). No cash dividend is paid, and the last stock split was a 2:1 in July, 1995.
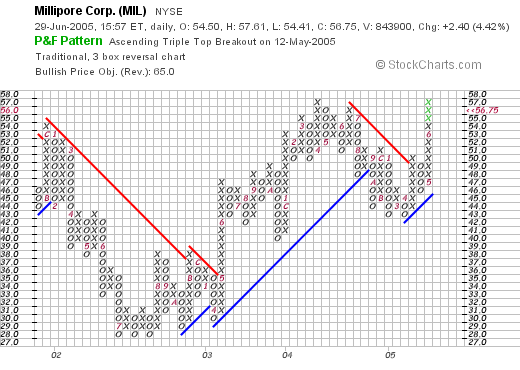
So what does the chart look like? Taking a look at a
"Point & Figure" chart from Stockcharts.com on MIL, we can see that this stock has had broad price swings the last few years, with a downward move from $54 to $28 between January, 2002 and July, 2002, followed by some consolidation and a move higher to $57 in June, 2004, and more recently, a breakdown in price to the $42 level in April, 2005. The stock has now broken through resistance at the $49 level, and has traded higher to the $57 range. The stock looks bullish to me, but does not appear overextended.
So what do I think? Well the stock looks attractive to me if not the strongest growth record I have reviewed here. Let's review: the stock made a nice move higher today, last quarter was a solid report with growth in the mid teens both in terms of revenue expansion and earnings growth. The last five years have been strong years with steady revenue growth, albeit with a bit of weakness in earnings several years ago. The company is spinning off increasing amounts of free cash to be added to an already solid balance sheet. Valuation appears reasonable if not cheap, and the chart looks positive but not over-extended.
Of course, I don't have any money to be buying any stock. But if I did....well enough hypotheticals! Thanks so much for stopping by. If you have any questions or comments, please feel free to leave them right here on the bloc, or feel free to email me at bobsadviceforstocks@lycos.com.
Bob
Monday, 27 June 2005
June 27, 2005 Quanex (NX)
Hello Friends! Thanks so much for stopping by and visiting my blog,
Stock Picks Bob's Advice. As always, please remember that I am an amateur investor, so please consult with your professional investment advisors prior to making any investment decisions based on information on this website.

This evening, browsing through the
list of top % gainers on the NYSE today, I came across Quanex (NX) which closed at $50.75, up $1.85 or 3.78% on the day. I do not own any shares of Quanex nor do I have any options.

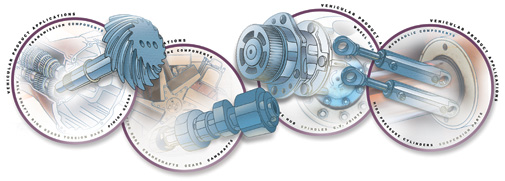
According to the
Yahoo "Profile" on NX, the company "...manufactures engineered materials and components for the vehicular products and building products markets."
On May 26, 2005,
Quanex reported 2nd quarter 2005 results. For the three months ended April 30, 2005, revenue climbed 43% to $533.8 million from $372.9 million. Earnings came in at $51 million, or $1.93/share, up sharply from $11.5 million, or $.46/share in the prior year same quarter. The company beat expectations with this report and also raised guidance for the full year. Both were bullish events for this stock!
Longer term, looking at the
"5-Yr Restated" financials from Morningstar.com, we can see that revenue was slightly lower between 2000 when sales were $806 million, dropping to $777 million in 2001. Revenue has grown steadily since that time, reaching $1.8 billion in the trailing twelve months (TTM).

Earnings have been a bit erratic, climbing from a loss of ($.70)/share in 2000 to $3.52 in 2002, dropping to $1.75 in 2003 then climbing further in 2004 and 2005.
The company does pay a dividend, which has climbed from $.43/share in 2000 to $.51/share in the TTM.
NX has also been increasing its free cash flow steadily the past few years with $50 million reported in 2002, growing to $158 million in the TTM.
Checking
Yahoo "Key Statistics" for NX, we can see that NX is a mid-cap stock with a market capitalization of $1.26 billion. The trailing p/e is downright cheap at 11.17, with a forward p/e (fye 31-Oct 06) of 10.25. The (5 yr expected) PEG comes in at 0.56, one of the lowest PEGS I have seen since I started Stock Picks over two years ago.
While NX's Price/Sales ratio is very cheap at 0.7, looking at the "Steel & Iron" Industry group, we can see that
all of the stocks in this particular group sport very low Price/Sales ratio. Specifically, Precision Casparts (PCP) tops off the list at 1.8, Quanex (NX) and Allegheny Technologies (ATI) are next at 0.7 each, Nucor (NUE) follows at 0.6, Steel Dynamics (STLD) is next at 0.5 tied with Worthington Industries (WOR) also at 0.5. Thus, Quanex is on the low end of the range, but still in the middle of the "pack".
Other statistics from Yahoo include 25.32 million shares outstanding with 24.96 million of them that float. Currently, there are 674,860 shares out short as of 5/10/05, representing 2.7% of the float, or 1.7 trading days of volume.
As indicated above, the company
does pay a small dividend of $.53/share yielding 1.09%. The last stock split was a 3:2 split this year on 1/3/05.
And how does the chart look? Taking a look at a
"Point & Figure Chart" for NX on Stockcharts.com:
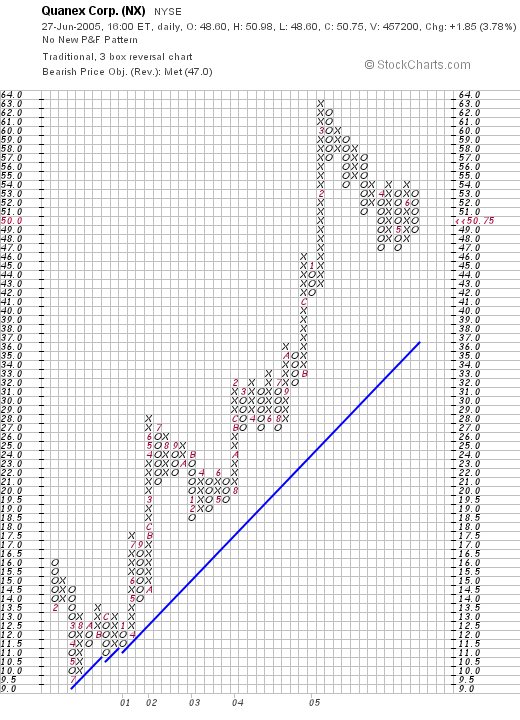
We can see that this has been an exceptionally strong stock since it bottomed at $9.50 in July, 2000, and has climbed steadily since, currently trading at the $50.75 level. The graph looks nice to me!
So what do I think? Well the company did make a nice move higher today in an otherwise sloppy market. The latest quarter was impressive, with the company posting stronger earnings and revenue growth, exceeding expectations for the quarter, and raising guidance for the rest of the year.
The last five years, except for the erratic earnings, which recently have been climbing, were solid results. Free cash flow has been growing, and the balance sheet is solid.
The valuation figures are nice with a very low P/E, a PEG just over 0.5, and a Price/Sales under 1.0. This looks good as well. Finally, the chart is strong.
My biggest concern is that this might yet be a bit cyclical, tied to big-ticket items like trucks for the company to stay on its trajectory. Now, if I just had some cash to invest :).
Thanks so much for stopping by! Please feel free to email me at bobsadviceforstocks@lycos.com if you have any questions or comments. Of course, please feel right at home to post some notes right in the blog itself!
Bob
Saturday, 25 June 2005
"Looking Back One Year" A review of stock picks from the week of May 3, 2004

Hello Friends! Thanks so much for stopping by and visiting my blog,
Stock Picks Bob's Advice. As always, please remember that I am an amateur investor, so please consult with your professional investment advisors prior to making any investment decisions based on information on this website.
We had one heck of a week! Both the NASDAQ and the NYSE corrected as concerns about the health of the economy, the housing "bubble" and the price of oil came together in a rather bearish fashion! And just as my own trading portfolio was getting fully invested at 25 positions. Maybe that should be another negative indicator (?).
Anyhow, it is the weekend now, and we can take a look at some selections from about a year ago. Last weekend I reviewed selections from the week of April 26, 2004. Today, let's take a look at the selections from the following week, the week of May 3, 2004, here on Stock Picks.
Please remember that this discussion assumes a buy and hold approach to investing. In practice, I sell my losing stocks quickly and sell portions of my gaining stocks slowly. Thus performance using the different strategies will be materially different. Nevertheless, let's take a look at the four stocks mentioned here that week and see what happened to them!

On 5/3/04, I
posted Province Healthcare (PRV) on Stock Picks at a price of $16.80/share. On April 15, 2005, LifePoint Hospitals (LPNT) announced the completion of the acquisition of Province for $11.375/share and .2917 shares of LPNT. With LPNT closing at $47.13 on 6/24/05, that currently works out to $11.375 and (.2917)($47.13) which works out to $25.12, for a gain of $8.32 or 49.5%.

On May 5, 2005, I
posted Impax (IPXLE) on Stock Picks at $24.95. IPXLE closed at $15.49 on 6/24/05, for a loss of ($9.46) or (37.9%).

On May 23, 2005, IPXL
received a NASDAQ delisting notice due to failure to post the first quarter results in a timely fashion.

On May 6, 2004, I
posted Diebold (DBD) on Stock Picks at $46.95. DBD closed at $49.22 on 6/24/05, for a gain of $2.27 or 4.8%.
On April 20, 2005, Diebold
reported 1st quarter 2005 results. Revenue came in at $540.2 million, up 8.4% from the prior year, however, net income was $26.7 million, down from $29.2 million the prior year, or $.37, a decline of (7.5)% from $.40/share the prior year. This was due to a restructuring charge, but I still insist on both growth in earnings and revenue to get a "thumbs-up" on this sheet!

Finally, on May 7, 2004, I
posted Provide Commerce (PRVD) on Stock Picks at a price of $20.16. PRVD closed at $22.79 on 6/24/05 for a gain of $2.63 or 13%.
On April 28, 2005, PRVD
announced 3rd quarter 2005 results. For the quarter ended March 31, 2005, net sales increased 40% to $57.2 million from $40.2 million the prior year. GAAP net income for the third quarter came in at $3.5 million or $.25/diluted share, down from $15.9 million or $1.14/diluted share last year. However, the shift in results is due to an income tax expense this year which negatively impacted earnings, and an income tax credit last year, which assisted earnings. Taking out these expenses and credits, "Pro Forma" earnings actually increased 59% to $4.4 million or $.32/diluted share. The "Pro Forma" results are probably more indicative of the actual health of the company, but for my purposes on the blog, not knowing detailed accounting information, I will stay with the GAAP results.
So how did we do with the four stocks? Well, one got acquired, and three are getting "thumbs-down" from me. However, these four stocks actually generated three gains ranging from 4.8% to 49.5%, and one loss at (37.9)%. The average of these four stocks works out to a gain of 7.35%.
Thanks so much for stopping by! If you have any questions, or comments, please feel free to leave them right here on the blog or email me at bobsadviceforstocks@lycos.com.
Bob
Posted by bobsadviceforstocks at 2:12 PM CDT
|
Post Comment |
Permalink
Updated: Saturday, 25 June 2005 2:18 PM CDT
Tuesday, 21 June 2005
What to do with American Healthways?
Hello Friends! Thanks so much for stopping by and visiting my blog,
Stock Picks Bob's Advice. As always, please remember that I am an amateur investor, so please consult with your professional investment advisors prior to making any investment decisions based on information on this website.
My AMHC stock hiccupped today! After a fairly good stock report, but with some conservative revisions for the upcoming quarter, the stock is trading lower. Naturally, the question arises, "what to do?"
American Healthways announced
3rd quarter 2005 results yesterday after the close. On first glance, they weren't too shabby. Revenues climbed 20% to $78.4 million, and net income came in at $8.5 million or $.24/share, up from $7.5 million, or $.22/share the prior year. However, the company was cautious with fiscal 2005 full year results on revenue, and estimated fourth quarter earnings at $.20 to $.22. The street didn't like the content of this advice and has taken AMHC down a notch.
As I write, AMHC is trading at $39.48, down $2.21 or 5.30% on the day.
The Motley Fool
commented nicely on the situation:
I concluded with a warning that because of the stock's high valuation, even the perception of minor bad news could periodically drive the stock lower in the short run. It looks like that's what we're seeing today -- the stock has been taken down about 5% despite a pretty decent quarter.
But what should I do in my trading account?
I currently own 170 shares of AMHC with a cost basis of $23.53. I acquired these shares almost exactly a year ago on 6/18/04. I have already sold twice, once with a 30% gain, and once with a 60% gain.
Since my trading strategy is to unload shares only on serious fundamental problems, this doesn't apply. Furthermore, I shall let the market dictate my action. I still have a 66.70% gain, and I shall be letting AMHC drift back all the way to a 30% gain before unloading shares, or on the upside, I shall be selling another 1/4 position, should the stock reach 90%. Otherwise, I am sitting tight.
I hope that is helpful to you! Having a trading system is useful in giving all of us guidelines to initiate trade, for me providing me the directions that allow me to implement my own discipline and learn to sit on my hands without panic.
Bob
"Revisiting a Stock Pick" Somanetics (SMTS)
Hello Friends! Thanks so much for stopping by and visiting my blog,
Stock Picks Bob's Advice. As I always remind you, please remember that I am truly an amateur investor and prior to making any investment decisions based on information on this website, you should consult with your professional investment advisors.

Looking through the
list of top % gainers on the NASDAQ today, I came across an old name, a stock that I have reviewed previously. Somanetics (SMTS) is having a nice day, trading as I write, at $22.25, up $1.51 or 7.28% on the day. I do not own any shares or options on this company.
I first
posted Somanetics (SMTS) on Stock Picks on March 14, 2004, when it was trading at $11.50 (!). Thus, the stock has appreciated $10.75 or 93.5% since posting a little more than a year ago.

According to the
Yahoo "Profile" on Somanetics, the company "...engages in the development, manufacture, and marketing of medical devices primarily in the United States. Its INVOS Cerebral Oximeter, a noninvasive patient monitoring system, provides continuous information about changes in the blood oxygen level in the brain."
On June 14, 2005,
Somanetics reported 2nd quarter 2005 results. For the three months ended May 31, 2005, revenue climbed 68% to $5.1 million from $3 million. Earnings came in at $890,183 or $.08/share, up 100% from $409,730 or $.04/share the prior year. They beat analysts expectations on both earnings and revenue; they were expected to come in at $.05/share on revenue of $4.4 million.
Looking at the
"5-Yr Restated" financials from Morningstar.com, we can see the steady revenue growth from $5.1 million in 2000 to $12.6 million in the trailing twelve months (TTM).

Earnings during this period have improved consistently from a loss of ($.57)/share to $.79/share in the TTM.
Free cash flow which was negative at ($1) MILLION IN 2002 has also improved to a positive $2 million in the TTM.
The balance sheet, as presented by Morningstar.com, looks solid with $7.5 million in cash, alone able to cover the short-term liabilities of $1 million, and no long-term debt at all. In addition, SMTS has another $3.7 million in other current assets.
Looking at
"Key Statistics" on SMTS from Yahoo, we can see that this is virtually a micro-cap stock with a market capitalization of $222.84 million. The trailing p/e is 27.97. I do not trust the forward p/e number from Yahoo, but they are anticipating a 53.42 p/e (which would go along with a halving of earnings instead of the doubling just reported.) for fye 30-Nov-06. I suspect, unless there is something else I don't know about this company, that this forward p/e has just not caught up with analysts or vice versa because of the very small nature of this company. The same goes with the PEG which is at 2.07.
Yahoo shows a Price/Sales of 15.10, which certainly looks rich to me. Referring to Fidelity Brokerage, SMTS is in the "Medical Appliances/Equipment" industry group. Within this group, this Price/Sales ratio puts it at the top in terms of this ratio. Other stocks in this group, trailing SMTS in the Price/Sales ratio, include Zimmer (ZMH) at 6.5, Medtronics (MDT) at 6.4, St. Jude (STJ) at 6.2, Biomet (BMET) at 5.1, and Edwards Lifesciences (EW) at 2.7.

Going back to the Yahoo information, we can see that there are 10.18 million shares outstanding with 9.63 million that float. Currently there are 314,260 shares out short representing 3.2% of the float or 6 trading days. This is significant (imho), with my own cut-off of 3 trading days that I use to look at stocks. Thus, this adds to the buying pressure.
No cash dividends reported on Yahoo and the last stock split was a "reverse" 1:10 stock split carried out in April, 1997. For those of you who may not understand reverse splits, this is usually done to actually boost a poorly performing stock to increase the stock price. For instance, if you were the owner of 100 shares prior to a 1:10 split, after the split, you would only own 10 shares of the new issue. The stock price goes up proportional to the split. If a stock was trading at $1 before a 1:10 split, it should be trading at $10 after the split.
What about the chart? If we look at a
"Point & Figure" chart from Stockcharts.com, we can see that this stock was trading lower throughout most of 2002, dropping from $4.75 in April, 2002, to a low of $%1.25 in August, 2002. Since that time, the stock has essentiall traded steadily higher to its current levels around $22.

So what do I think about this stock? Well, first of all, I wish I had bought some shares last year when I first posted it :(. However, let's review some of the things I have written: the stock is making a nice move today on the back of a fabulous earnings report that beat analysts expectations with a 68% rise in revenue with a 100% jump in earnings. In addition, the company has steadily been growing both revenue and earnings the past five years. They are spinning off free cash flow and the balance sheet looks terrific.
A couple of negatives. The valuation is steep with a Price/Sales ratio off the chart. However, the rest of the valuation isn't bad with a p/e in the low 20's and the latest quarter showing 100% growth in earnings. I am not sure about the other valuation numbers on Yahoo with a forward p/e so much higher than the current p/e. That needs investigation.
The short interest adds buying pressure and the chart looks great. I still find this stock very attractive. Of course, any small slip-up will hand you a loss on a small cap stock like this. However, the potential seems quite large, and the stock might just be an acquisition target for a larger company looking at expanding its medical equipment line. I certainly do NOT know of anything going on at this time.
Thanks so much for stopping by! If you have any questions or comments, please feel free to leave them right here on the blog or you can email me at bobsadviceforstocks@lycos.com.
Bob
Monday, 20 June 2005
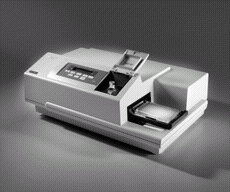
June 20, 2005 Molecular Devices (MDCC)
Hello Friends! Thanks so much for stopping by and visiting my blog,
Stock Picks Bob's Advice. As always, please remember that I am an amateur investor so please remember to check with your professional investment advisors prior to making any decisions based on information on this website.

Overall the market is behaving poorly this morning. The Dow and the NASDAQ are down and oil is flirting with $60/barrel. In my own trading account, my Kyphon (KYPH) is also flirting with an 8% loss, and I shall be letting that one go if it does break down to that level. This is actually the second time in the past few years that I have tried to make Kyphon work for me. Hopefully, things turn around a bit, but the market will dictate my own action.
I was looking through the
list of top % gainers on the NASDAQ this morning and came across Molecular Devices (MDCC). As I write, MDCC is trading at $21.20, up $1.90 or 9.84% on the day. I have looked at this stock in the past, and I believe I used to own some shares of this, but I do not currently own any shares or options in MDCC.
According to the
Yahoo "Profile" on MDCC, this company "...engages in the design, development, manufacture, sale, and servicing of bioanalytical measurement systems for drug discovery and other life sciences research."
One of my first "stops" in reviewing a stock is to check the latest quarterly report. I am looking for growth both in revenue and earnings.
On April 28, 2005, Molecular Devices announced
1st quarter 2005 earnings results. For the quarter ended March 31, 2005, revenues grew 43% to $39.1 million, up from $27.3 million in the prior year same period. Net income increased 50% to $2.2 million from $1.4 million last year. On a per share fully diluted basis, earnings increased 30% to $.13/share up from $.10/share last year. These were solid results imho.
My next step in looking at a stock is to take a longer perspective. It is my view, that like a physics theorem, that things in motion tend to stay in motion :). This really an earnings momentum view. In other words, a stock of a company that has been posting excellent results for the last several years and the latest quarter is more likely to continue to post good results than a company with a more inconsistent record. I don't believe that earnings and revenue growth are random events. They are a product of an outstanding management team in conjunction with an outstanding product or service.

For this longer-term view, I find the analysis on Morningstar.com very helpful. In fact the
"5-Yr Restated" financials on MDCC give us quite a bit of useful information. First of all, revenue growth has not been perfect, yet it is very impressive. Morningstar does show a dip in revenue from 2000 when MDCC reported $96.0 million, to $92.2 million in 2001. However, since 2001, the revenue has steadily increased to $160.3 million in the trailing twelve months (TTM).
Looking at earnings, we can see that the company was losing money in both 2000 and 2001, when they posted $(.32)/share earnings. Since that time, MDCC has impressively been improving its earnings picture each year, posting $1.07/share in the trailing twelve months (TTM).
Free cash flow has been positive and steady (but not really growing) with $13 million posted in 2002 and $14 million in the TTM.
The Morningstar balance sheet results also look solid with $74.1 million in "other current assets" along with $8.3 million in cash, balanced against $30.9 million in current liabilities and $6.7 in long-term liabilities.

There are many ways of investing. I like to be "eclectic" and draw from different strategies. The underlying philosophy that drives my trading remains "momentum" but still, I do not close my eyes to technical, or valuation issues.
For valuation, I like to look at Yahoo "Key Statistics" and I also use my Fidelity online site for questions about comparative valuation. Looking at
Yahoo "Key Statistics" on MDCC, we can see that this is a small cap stock with a market capitalization of only $359.95 million.
The trailing p/e is very nice (imho) at 20.32, with a forward p/e (fye 31-Dec-06) of only 19.34. The (5 yr expected) PEG is 0.93, making it very attractive (under 1.0) on a valuation basis.
MDCC sports a Price/Sales ratio of 2.04. MDCC, according to my Fidelity source, is in the "Scientific/Tech Instruments" industry. This Price/Sales is fairly reasonable compared to the other companies in this group. Garmin (GRMN) tops this group at 6.1 Price/Sales, Flir (FLIR) is just under that at 4.3, Applied Biosystems (ABI) is at 2.4, followed by MDCC at 2, Beckman Coulter (BEC) at 1.7, and Agilent (A) at 1.7. Thus, even with this parameter as well, MDCC looks like a good value!
Other statistics on Yahoo show that MDCC has 16.92 million shares outstanding. 15.91 million of them float. There are currently 893,550 shares out short (5/10/05) representing 5.5 trading days of volume. Over the 3.0 day trading day, (my own level of "significance") this only adds to the bullish activity in this stock.
Yahoo does not report any stock dividends nor any cash dividends.
What about "technicals"? Does the chart look encouraging? For this I like to use Stockcharts.com, and looking at the
"Point & Figure" chart from Stockcharts.com on MDCC:
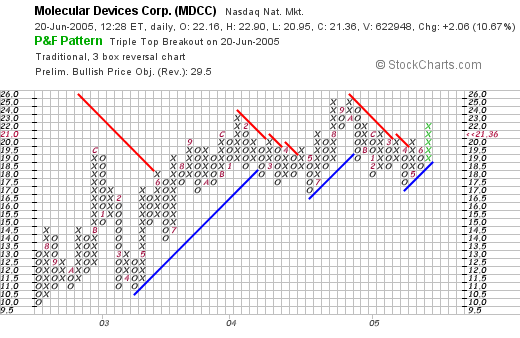
We can see that this stock broke through a resistance level at $18 in June, 2003, after climbing from a low of $10 in July, 2002. However, the stock has basically traded sideways since that time. It currently has broken through resistance at $20, and is trading higher. It is certainly not what I would call overextended, going along with its excellent valuation.
So what do I think about all of this? Let's review. The stock is making a nice move today, last quarter's results were solid with both impressive revenue and earnings growth, the last five years have also been terrific, with except for one down year in revenue four yeasrs ago, the company has been growing revenue steadily, turned profitable from a loss, and has been spinning off steady amounts of free cash. The balance sheet is solid, and valuation looks great with a p/e just over 20, a PEG under 1.0, a Price/Sales in the lower part of its industry group. There is even a significant number of shares out short that need to be covered, adding to buying pressure. The graph doesn't look overwhelming bullish, but the stock has been consolidating and appears to be moving higher. On the chart, I would love to see the stock break past its previous high of around $25, to confirm the move higher.
Now, if I only had money or a reason to be buying a stock. I shall be sitting on my hands until I sell a position at a gain, and have less than 25 positions in my trading portfolio. Meanwhile, I can just keep this one on the back burner for a future date!
Thanks again for stopping by and visiting! If you have any questions, comments, or words of encouragement, please feel free to post them right here on the blog or email me at bobsadviceforstocks@lycos.com.
Bob
Sunday, 19 June 2005
"Looking Back One Year" A review of stock picks from the week of April 26, 2004

Hello Friends! Thanks so much for stopping by and visiting my blog,
Stock Picks Bob's Advice. As always, please remember that I am an amateur investor, so please consult with your professional investment advisors prior to making any investment decisions based on information on this website!
It is the weekend and this is the time that I like to go back a year and see how picks that were mentioned on this website. Last week I reviewed the week of April 19, 2004, and this week, let's take a look at the week of April 26, 2004.
This analysis assumes a buy and hold strategy which is not what this blog and not what I practice in my actual trading portfolio. However, for the sake of finding out what happened to my "picks", it is at least helpful to see what would have happened if all stocks mentioned were indeed purchased and you still owned them today. In practice, I strongly believe in selling my declining stocks quickly, and selling portions of my climbing stocks slowly.

On April 28, 2004, I
posted Trimble Navigation (TRMB) on Stock Picks at a price of $25.98. TRMB closed on 6/17/05 at $38.01 for a gain of $12.03/share or 46.3%.

On April 21, 2005, TRMB
reported 1st quarter 2005 results. Revenue for the quarter ended April 1, 2005, increased 25% from $156.5 million last year to $195.4 million this year. Net income for the quarter grew 36% to $17.4 million or $.31/share, up from $12.8 million or $.24/share the prior year.

On April 29, 2004, I
posted INAMED (IMDC) on Stock Picks at a price of $58.03. IMDC closed at $64.98 on 6/17/05 for a gain of $6.95 or 12.0%.

On May 9, 2005,
IMDC reported 1st quarter 2005 results. For the quarter ended March 31, 2005, revenue grew 16% to $105.2 million, up from $90.8 million. Diluted GAAP earnings came in at $.38/share, down from $.49/share in the same quarter last year. (I don't give a quarterly report a "thumbs-up" unless both revenue and earnings have increased!)

On April 29, 2004, I
posted Fisher Scientific (FSH) on Stock Picks at a price of $58.60. FSH closed at $63.48 on 6/17/05 for a gain of $4.88 or 8.3%.
On May 9, 2005, Fisher Scientific
reported 1st quarter 2005 results. Revenue for the quarter, in large part aided by the acquisition of Apogent Technologies, grew 35% to $1.35 billion from $1 billion in the same quarter the prior year. Earnings rose to $77 million or $.61/share, up from $34.6 million, or $.51/share last year.

My last stock pick, Intuitive Surgical (ISRG) was
selected for Stock Picks on April 30, 2004, at a price of $16.35. ISRG has had a phenomenal run since that time closing at $50.40 on 6/17/05 for a gain of $34.05 or 208.3% since the selection!
On April 21, 2005, ISRG
reported 1st quarter 2005 results. For the quarter ended March 31, 2005, sales grew 54% from $27.1 million last year to $41.6 million this year. Net income was up 900% to $9.1 million or $.25/diluted share from $.9 million or $.02/diluted share last year. This was a phenomenal quarter!
So how did I do on these four picks. I am happy to report that this particular week was TERRIFIC for Stock Picks! And you know that I don't always hit that ball out of the park. There were four selections and all four showed gains, ranging from 8.3% to 208.3%! The average gain for these particular four stocks was 68.7% driven in large part by the outsized gain on ISRG, but also, with a solid performance (46.3% gain) from TRMB.
Thanks again for stopping by! I don't usually do this well on the picks so please remember that past performance is NO guarantee of future performance! But still, THAT was pretty impressive :).
If you have any comments, questions, or words of encouragement, please feel free to email me at bobsadviceforstocks@lycos.com.
Bob
Friday, 17 June 2005
A Reader Writes "Why do you sell at Percentages?"
One of my regular readers dropped me a line today, but it looks like I deleted it before I got around to answering. But let me tell you what he wrote:
Basically, why do I sell stocks at percentage targets? Why don't I buy stocks if they are a good value and decline as they would be a better value at that price?
I believe that was the thrust of the correspondence.
To answer this question, let me just say that for most of my trading existence THAT was exactly what I did. Unfortunately, that brings a lot of emotion into the equation. For me if a stock declines, that doesn't make it a better stock...sort of a better value. It makes it a worse stock.
For me, stocks that appreciate in price are good stocks and stocks that go the other way are bad stocks.
Pretty simple huh?
My other basic philosophy is to sell losers quickly, and winners slowly. In fact, I never sell enough of a winner to get it much below the value of the holding when I first purchased it. That is why I sell 1/4 position with a 30% gain. If you look at it with fractions, 1/4 of 4/3 is 1/3, leaving 3/3. You can see the pattern.
I like to describe this method as sort of like the guy that goes to Vegas with a pile of quarters and puts all of his winning in his left pocket and the quarters he wishes to gamble with in the right. That way, the winnings aren't touched.
It isn't exactly the same, but I think you can get the idea.
I simply am not smart enough to make all of the right decisions all of the time. Thus, if I use the stock price movement itself to dictate my action, I will always know what to do and when.
I hope that is helpful. Meanwhile, I am falling asleep at my keyboard....so niters everyone!
Bob
Newer | Latest | Older


