Stock Picks Bob's Advice
Monday, 8 August 2005
August 8, 2005 Ventiv Health (VTIV)
Hello Friends! Thanks so much for stopping by and visiting my blog,
Stock Picks Bob's Advice. As always, please remember that I am an amateur investor so you should always consult with your professional investment advisors prior to making any investment decisions based on information on this website.

I was looking through the
list of top % gainers on the NASDAQ today, and came across Ventiv Health (VTIV) which closed at $24.19, up $3.31 or 15.85% on the day. When I looked harder at the stock this afternoon, I liked what I saw and purchased 40 shares for my son in one of his accounts. I do not own any shares nor do I have any options on this company myself.
According to the
Yahoo "Profile" on VTIV, the company "...provides oursourced clinical, sales, marketing, and compliance solutions for the pharmaceutical, biotechnology and life sciences industries."
What drove the stock higher today was an outstanding
2nd quarter 2005 earnings report. In addition, the company raised guidance for the remainder of 2005. For the quarter ended June 30, 2005, revenue came in at $131.8 million, a 75% increase over the $75.2 million for the same quarter last year. Earnings from continuing operations jumped 92% to $15.0 million from $7.8 million last year. Diluted earnings per share came in at $.32, up from $.19/share last year.
If we look at the
"5-Yr Restated" financials from Morningstar.com, we can see that revenue actually dropped from $294.8 million in 2001 to $215.4 million in 2002. Revenue has been increasing each year since then.
Morningstar shows that earnings actually dropped from $.72/share in 2000 to a loss of $(2.58) in 2001, and then have slightly erratically been improving to the $1.35 in the trailing twelve months (TTM).
Free cash flow has also been a bit inconsistance but has stayed positive and came in at $29 milllion in 2002, and is $32 million in the TTM.
The balance sheet as presented by Morningstar also looks nice with $44.4 million in cash and $123.1 million in other current assets. This easily covers both the $75.8 million in current liabilities and the $27.2 million in long-term liabilities combined.
Looking at
Yahoo "Key Statistics" on VTIV, we can see that this is a small mid-cap stock with a market capitalization of only $646.55 million. The trailing P/E isn't bad at 17.99, and the forward P/E (fye 31-Dec-06) is a bit higher at 18.47. However, the "5 yr expected" PEG is downright cheap at 0.60.
VTIV is in the "Management Services" Industrial Group, and carries a Price/Sales ratio of 1.4. This is midway between Ceridian (CEN) at 2.3, and Accenture (ACN) at 1.4, Heidrick & Struggle (HSII) at 1.4, and Hewitt Associates (HEW) at 1.2, and Bearing Point (BE) at 0.5. Thus, in this particular parameter, valuation is moderate and midway between the other stocks in the group.
Yaqhoo shows that there are 26.73 million shares of VTIV outstanding with 25.65 million of them that float. Currently there are 1.3 million shares out short (as of 7/12/05) representing 5.30% of the float or 3.3 trading days of volume. This doesn't look like a very heavy short interest on this company!
No stock dividend and no cash dividend are paid to stockholders.
If we look at a
"Point & Figure" Chart from Stockcharts.com:
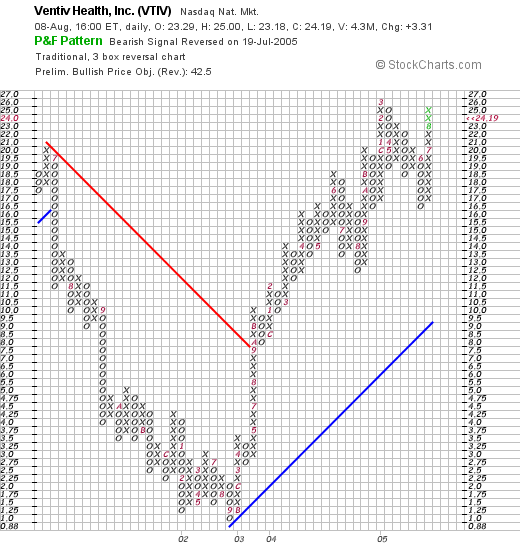
We can see that this stock was actually trading lower between June, 2001, when it peaked at around $20, and September, 2002, when it bottomed at $1.00. The stock subsequently traded higher, breaking through resistance at the $8.00 level in September, 2003, and has continued to trade higher above the support level at around $9.50.
So what do I think? Well, as I pointed out earlier, I purchased 40 shares for my son (who had his Laserscope shares sold on weakness). The earnings report was strong, guidance was raised, earnings have been growing along with revenue for the last several years, earnings have also been strong with positive free cash flow and the balance sheet looks solid. Valuation is also attractive with a PEG under 1.0. The Price/Sales ratio is near the median of the group and doesn't appear to be excessively elevated. The chart also looks nice with a very strong price performance from VENTIV.
However, I am at my 25 position maximum in my trading account, and my ANF fortunately moved a bit higher after threatening to hit the 8% loss level Friday. I thus, am not in the market to be buiying any shares! Thanks so much for stopping by and visiting. If you have any questions or comments, please feel free to email me at bobsadviceforstocks@lycos.com or just go ahead and leave your comments in the blog!
Bob
Saturday, 6 August 2005
"Looking Back One Year" A review of stock picks from the week of June 7, 2004

Hello Friends! Thanks so much for stopping by and visiting my blog,
Stock Picks Bob's Advice. As always, please remember that I am an amateur investor, so please remember to consult with your professional investment advisors prior to making any investment decisions based on information on this website.
I went back through the old entries (as you can also do by clicking on the links of dates to the left of the main entry page), and found that I
hadn't posted any new stock picks during the week of June 7, 2004. Thus, instead of just leaving this section blank, let me share with a
painting of Mark Rothko, a wonderful modern artist, from the Museum of Modern Art Website:

I hope that you all have a wonderful week trading! If you have any questions or comments, please feel free to email me at bobsadviceforstocks@lycos.com or just post your messages right on the website!
Bob
Thursday, 4 August 2005
A Reader Writes, "What do you think of RNWK?"
Hello Friends! Thanks so much for stopping by and visiting my blog,
Stock Picks Bob's Advice. As always, please remember that I am an amateur investor, so please remember to consult with your professional investment advisors prior to making any investment decisions based on information on this website.

I received a comment from one of my Xanga friends, "Rise" who wrote:
Bob, what do you think of RNWK?
Thanks
Gosh, now
that was getting to the point! First of all, I do not own any shares of RNWK, nor do I own any options. And as Rise knows, I cannot even predict which way the stock price is going to move! But let me see what I think about the company based on the screens that I usually do.

First of all the price: RealNetworks (RNWK) closed at $5.36, down $.09 or (1.65%) on the day. (The stock is down another $.06 or (1.12%) in after-hours trading.
According to the
Yahoo "Profile" on RNWK, the company "...and its subsidiaries provide network-delivered digital media content and services worldwide. It also develops and markets software products and services that enable the creation, distribution and consumption of digital media, including audio and video." As noted, two of the biggest products for RNWK are the RealPlayer service, and the Rhapsody music download service.
As I like to do, and as Rise is sure to know, the first place I go to review stocks is the latest quarter results. On August 2, 2005, RealNetworks
reported 2nd quarter 2005 results. Revenue grew nicely, up 26% to $82.7 million from the prior year. Net income came in at $4.7 million or $.03/share, compared to a net loss last year of ($4.6) million, or ($.03)/share. This appears to have been a solid quarter for RNWK.
How about longer-term? Looking at the
"5-Yr Restated" financials on Morningstar.com, we can see that revenue was actually declining between 200 and 2002, when it dropped from $241.5 million to a low of $182.7 million in 2002. However, since then revenue has grown steadily to the $282.9 million reported in the trailing twelve months (TTM).
Earnings show a steady improvement, albeit with losses between 2000 and 2004, improving from ($.72) in 2000 to a smaller loss of ($.08) in the TTM; clearly the turn to profitability as reported above, is a recent phenomenon.
Free cash flow has also been "in the red" with ($7) million reported in 2002, improving to ($3) million in 2004, but a positive $4 million is noted in the TTM.
The balance sheet looks solid with $39.6 million in cash and $352.1 million in other current assets, easily covering the $103.5 million in current liabilities and the $121.2 million in long-term liabilities.
Taking a look at the
"Key Statistics" from Yahoo on RNWK, we can see that this is a mid-cap stock with a market capitalization of $917.29 million. The trailing p/e is N/A (the company has been losing money until recently), and the forward p/e is a high 53.60. Thus, the 5 yr estimated PEG is rich at 6.05.
Other key statistics include the Price/Sales of 3.30. Yahoo reports 171.14 million shares outstanding with 117.06 million that float. Currently there are 5.52 million shares out short, representing 6.7 days of trading or 4.70% of the float.
No cash dividend is reported and the last stock split was a 2:1 in February, 2000.
What about the chart? Looking at a
"Point & Figure" chart on RNWK from Stockcharts.com , we can see that the stock has been sliding lower since January, 2002, when it was trading at $21/share. The stock recently has rallied off a large correction with a low-point of $2.75. The company has recently moved off a low, but is now hitting resistance at the $7 level.
So what do I think? Well, I certainly am
familiar with their Real products! The stock price is under $10 which is a negative in my bood (I have been greatly influenced by William O'Neill who believed strongly in avoiding these "lower quality" stocks...but I do think you can find some good investments among them.
The latest quarter was very good with a strong growth in revenue and
profitability. O.K., so I would rather see a stock with a longer record of making money, but this turn to profitability might indeed be the start of something good. And the last five years; well, the stock was showing reduced revenue until 2002, but it appears to have turned the corner. The same goes with free cash flow which is also now positive, and the balance sheet is solid. The key parameters on this company are a bit pricey with a P/E over 40, a PEG over 6, but the large short interest could possibly help. However, even the chart looks a bit anemic with a real reluctance of traders to bid this stock over $7, failing three times in a row to surpass that price level!
In conclusion, the stock is a bit more speculative that I would like to invest in. I do like the return to profitability, but would rather see a longer history of profitability. So if you choose to buy this one, well "good-luck" my friend! It may turn out to be a fabulous investment, but it is just a bit beyond what I consider to be investable.
If you have any questions or comments, please feel free to leave them on the blog or email me at bobsadviceforstocks@lycos.com.
Bob
Monday, 1 August 2005
"Trading Transparency" Cal Dive International (CDIS)
Hello Friends! Thanks so much for stopping by and visiting my blog,
Stock Picks Bob's Advice. As always, please remember that I am an amateur investor, so please consult with your professional investment advisors prior to making any investment decisions based on information on this website.
A few moments ago I sold 37 shares (1/4 of my remaining position of 150 shares) of Cal Dive (CDIS). This was my second partial sale of CDIS, and thus my targeted gain, which I just hit, was a 60% gain over the initial purchase price.
These 150 shares were purchased 11/3/04 at a cost basis of $38.20/share. (I made my first sale, 50 shares of 200 share position on 2/25/05 at an effective price of $49.87.) The 37 shares were sold at $61.14 today for a gain of $22.94/share or 60.05%. My next sale will thus be at 90% on the upside, or I shall unload my remaining shares at a 30% gain level on the downside!
Since I am still at my 25 position goal, I shall be using the proceeds to continue to pay down my sizeable, but fortunately shrinking, margin level!
Thanks again for stopping by! If you have any questions or comments, please feel free to email me at bobsadviceforstocks@lycos.com or leave your messages right here on the blog!
Bob
Sunday, 31 July 2005
"Looking Back A Year" A review of stock picks from the week of May 31, 2004
Hello Friends! Thanks so much for stopping by and visiting my blog,
Stock Picks Bob's Advice. As always, please remember that I am an amateur investor and you need to consult with your professional investment advisors prior to making any investment decisions based on information on this website.
I missed last weekend with my post, so I have fallen back another week in my trailing 52 week review. I am now up to about 60 weeks out. Anyhow, what I like to do on these weekend posts, is to examine how the stocks listed on this blog have performed since posting. Sort of a quality check you could say.
Again, this review assumes a buy and hold strategy. If you have been following my blog for awhile you will realize that I do
not use a buy and hold approach. I very much like to sell my losing stocks quickly, unloading them if I have an 8% loss, and sell my winning stocks slowly with 1/4 position sales at targeted gains.

On June 1, 2004, I
posted SRA International (SRX) on Stock Picks at a price of $41.80. SRX had a 2:1 split on 5/31/05, and thus my "pick price" was effectively $20.90. SRX closed at $37.20 on 7/29/05, for a gain of $16.30 or 78.0%. SRX is a stock that I do own in my trading portfolio, the only stock that I have a position of the three stocks that I am reviewing this week.

SRX is actually going to report earnings tomorrow, but since I am writing today, unfortunately I am stuck with the latest quarter which was the
3rd quarter 2005 fiscal report which was reported on May 2, 2005. During the quarter which ended March 31, 2005, revenue grew 41% to $226 million from $160 million the same period in 2004. Net income climbed 44% from $10.2 million to $14.7 million, and diluted earnings per share increased 41% from $.37/share to $.52/share in the latest quarter. In addition they raised guidance for fiscal 2005. All-in-all, everything that one would want to read from a company!

On June 2, 2004, I
posted Micronetics (NOIZ) on Stock Picks at a price of $9.33. NOIZ closed on 7/29/05 at $8.39 for a loss of $(.94)/share or (10.1)%.

On July 1, 2005, NOIZ
reported 4th quarter 2005 results. Revenue came in at $3.7 million, down (6.0)% from $3.95 million the prior year. Net income was also down slightly at $476,957 or $.11/share, from $480,275 or $.11/share the prior year.

Finally, on June 3, 2004, I
posted Bebe Stores (BEBE) on Stock Picks at a price of $21.17. BEBE split 3:2 on 12/30/04, and 3:2 again on 6/6/05 giving us an effective stock pick price of $9.41. BEBE 7/29/05 at $28.46 for a gain of $19.05 or 202.4%. This might be a good point to remind everyone that past performance is NEVER a guarantee of future performance. But that still was a pretty phenomenal performance for that stock pick and unfortunately, that was the one that I never bought any shares!
On April 21, 2005, BEBE announced
3rd quarter 2005 results. Net sales for the third quarter 2005 ended April 2, 2005, came in at $116.9 million, up 39.7% from $83.6 million reported in the third quarter of 2004. On top of this, BEBE reported that "same store sales" for the quarter came in at 28.5% which is a phenomenal result! Net earnings for the quarter climbed 103.7% to $11.1 million, compared to $5.5 million last year. Diluted earnings per share were up 100% to $.18, vs $.09/share last year. This was a great report and the stock price has performed in line with this!
So how did I do for the week of May 31, 2005, in "picking" stocks? Well pretty darn good if I may say so myself :). I had three stocks listed and two made great gains and one sold off. With the
huge gain in BEBE, the three stocks ended up with an average performance of a gain of 90.1% since posting last year. AGAIN, let me remind you that past performance is not a guarantee of future performance, but THAT was a pretty good week to review!
Thanks again for stopping by and visiting. If you have any comments or questions, please feel free to leave them right here on the blog or email me at bobsadviceforstocks@lycos.com.
Bob
Posted by bobsadviceforstocks at 12:36 PM CDT
|
Post Comment |
Permalink
Updated: Wednesday, 24 August 2005 1:53 PM CDT
Friday, 29 July 2005
July 29, 2005 Middleby Corp (MIDD)
Hello Friends! Thanks so much for stopping by and visiting my blog,
Stock Picks Bob's Advice. As always, please remember that I am an amateur investor and that prior to making any investment decisions based on information on this website you should consult with professional investment advisors.

I was looking through the list of
top % gainers on the NASDAQ today, and came across Middleby Corporation (MIDD), a mid cap stock with an interesting record! I do not own any shares nor do I own any options on this company.
MIDD closed today at $69.86, up $7.86 or 12.86% on the day. According to the
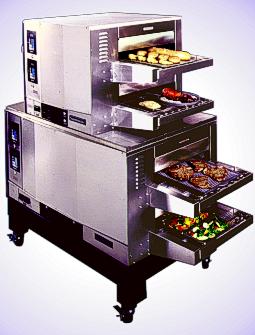
Yahoo "Profile" on MIDD, the company "...through its subsidiaries, engages in the design, manufacture, and sale of commercial and institutional foodservice equipment."
What drove the stock higher today, was an outstanding earnings report released yesterday after the close of trading. Middleby reported
2nd quarter 2005 results for the quarter ended July 2, 2005. Net sales rose 15.1% in the quarter to $83.9 million, from $72.9 million in the same quarter the prior year. Net earnings (on a per share basis) jumped 35% to $9.0 million or $1.11/share, from $8.2 million, or $.82/share. Interestingly, there were actually 20% less fully diluted shares this year than last! (8.05 million shares this year vs. 10.0 million shares last year.)
Looking at the
Morningstar.com "5-Yr Restated" financials, we can see a bit of an erratic growth in revenue, dropping from $129.6 million in 2000 to $103.6 million in 2001. However, since 2001, the revenue has grown nicely to $283.5 million in the trailing twelve months (TTM).
Morningstar also shows a similar drop in earnings between 2000 at $.35/share to $.18/share in 2001. Since that year, earnings have also steadily been rising to the $2.61 in the trailing twelve months.
The company also has paid a dividend, $.10/share in 2000, dropping it in 2001 and 2002, reinstating at
$.25 in 2003, and $.40 in the TTM.
Free cash flow has remained positive, with $18 million reported in 2002, but has dropped to $11 million in the TTM.
The balance sheet shows an excess of current assets over current liabilities at $2.6 million in cash and $86.8 million in other current assets balanced against $68.2 million in current liabilities and $140.4 million in long-term debt.
Reviewing
"Key Statistics" from Yahoo, we find that the market cap is a small mid-cap stock at $541.97 million. The trailing p/e is moderate at 27.10, and the forward p/e (fye 01-Jan-07) is even nicer at 16.79. Thus, due to the fast growth, the PEG (5 yr expected) comes in under 1.0 at 0.92.
Looking at the Price/Sales ratio, relative to its industrial group of "Diversified Machinery", we can see, according to my Fidelity brokerage research, that this company is valued midway between other members of this group. Topping out the group in valuation is Roper Industries (ROP) with a Price/Sales of 2.8, next is Pall (PLL) at 2.1, and Illinois Tool Works (ITW) at 2.0. Middleby (MIDD) comes at 1.7, followed by Ingersoll-Rand (IR) at 1.3 and Eaton (ETN) at 0.9.
Reviewing the rest of the Yahoo "Key Statistics" information, we find that the company has only 7.76 million shares outstanding with 4.06 million of them that float. There are quite a few shares out short, 649,000 as of 7/12/05, representing 14% of the float or 9.9 trading days of volume. The sharp rise today might be due to some "squeezing" of the shorts in the face of good earnings. But that is of course just a guess :).
Yahoo does not show a dividend, while Morningstar shows a $.40/share dividend this past year. No stock splits are reported on Yahoo.
Looking at a
"Point & Figure" chart from Stockcharts.com:
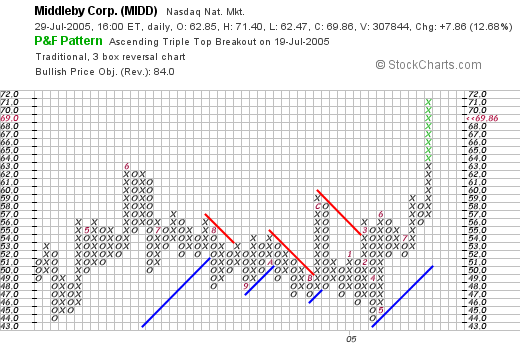
We can see that the stock was pretty much trading sideways and declining slowly from a high of $63 in June, 2004, to the low of $44 in April, 2005. Since April, the stock has been trading quite strongly to the upside.
So what do I think? Well this is certainly a different sort of stock! Not a biotech, not even high tech at all. Just cooking equipment (I really should never say "just"!).
Reviewing, the stock moved strongly higher today on a very strong earnings report. The last 4 years have been solid with just a small glitch in performance between 2000 and 2001. Although not growing, free cash is positive. And the balance sheet is solid if not overwhelming. Valuation looks good with a p/e in the low 20's, a PEG under 1.0, and a Price/Sales that is the middle of its industrial group.
Thanks again for stopping by and visiting my blog! If you have any questions or comments, please feel free to email me at bobsadviceforstocks@lycos.com. (Or leave your comments right here on the blog.)
Bob
Posted by bobsadviceforstocks at 9:34 PM CDT
|
Post Comment |
Permalink
Updated: Friday, 29 July 2005 9:35 PM CDT
Thursday, 28 July 2005
"Revisiting a Stock Pick" Advanced Neuromodulation Systems (ANSI)
Hello Friends! Thanks so much for stopping by and visiting my blog,
Stock Picks Bob's Advice. As always, please remember that I am an amateur investor, so please consult with your professional investment advisors prior to making any investment decisions based on information on this website.

I was looking through the list of
top % gainers on the NASDAQ today and came across an old pick of mine, Advanced Neuromodulation Systems (ANSI) which closed today at $48.40, up $7.00 or 16.91% on the day.
I first
posted ANSI on Stock Picks on 5/19/04 when it was trading at $33.03. Thus, in the little more than a year that I have looked at ANSI, this stock has appreciated by $15.37 or 46.5%.
According to the
Yahoo "Profile" on ANSI, the company "...engages in the design, development, manufacture, and marketing of implantable neuromodulation devices, which are used to manage chronic intractable pain and other disorders of the central nervous system through the delivery of electrical current or drugs directly to targeted nerve fibers." I do not own any shares or options in ANSI.
What drove the stock higher today was the release prior to the opening of trading of the
2nd quarter 2005 earnings results. Revenue for the quarter ended June 30, 2005, grew 26.9% to a record $38.7 million from $30.5 million in the same quarter last year. Net income for the quarter jumped 17.6% to $5.1 million or $.25/diluted share, up from $4.3 million or $.21/diluted share for the same quarter in 2004.
Taking a look at the
"5-Yr Restated" financials on Morningstar.com, we can see the beautiful progression of the purple bars showing the revenue growth from $31.8 million in 2000 to $126.4 million in the trailing twelve months (TTM).
Earnings have also grown steadily from $.06/share to $3.43 in the TTM. (I am not sure of the significance of the last number, earnings were $.86/share in 2004.)
Free cash flow has also been growing steadily from $1 million in 2002 to $18 million in the TTM.
The balance sheet is impeccable with $180.7 million in cash alone, enough to cover both the $40.3 million in current liabilities and the $6.7 million in long-term debt almost four times over! In addition, ANSI is shown by Morningstar to have an additional $54.8 million in other current assets.
Looking at
Yahoo "Key Statistics" on ANSI, we can see that the Market Cap is a mid-cap-sized $959.92 million. The trailing P/E is cheap at 14.06 (this must include some one-time income as the forward P/E is steeper at 40.00).
Insofar as the Price/Sales figure is concerned, ANSI is relatively expensive in its group of "Medical Instruments/Supplies". Topping off the list is Alcon (ACL) at 8.6 P/S, however ANSI is next at 6.5, Guidant (GDT) is next at 5.9, Stryker (SYK) at 4.8, Boston Scientific (BSX) at 3.8, and Baxter (BAX) at 2.5.
Other "Key Statistics" show that ANSI has 19.83 million shares outstanding with 19.59 million of them that float. Currently, there are 3.22 million shares out short representing 16.50% of the float as of 6/10/05, or 9.2 trading days of volume. This is a bit of a significant short interest outstanding, and some of the shares purchased might be due to a "squeeze" of short-sellers.
Yahoo reports no cash dividend and the last stock split was a 3:2 split in July, 2003.
Looking at a
"Point & Figure" chart on ANSI from Stockcharts.com:
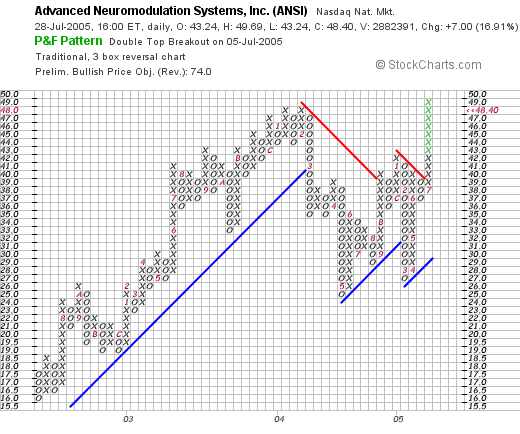
We can see that the stock was trading strongly higher between July, 2002, and February, 2004, when the stock moved from $16 to the $48 level. The stock then sold off and consolidated between the $26 to $48 level, before breaking through resistance this month at $39. The graph looks strong yet not overvalued to me.
So let's review: the stock has traded strongly higher since posting here last year. The stock made a nice move on a strong earnings report. The earnings and revenue have grown nicely the past five years. Free cash flow is positive and the balance sheet is perfect. Even the graph is reassuring.
Of course I have 25 positions already in my portfolio so I am not in the market to buy anything. However, this stock sure is interesting! If you have any questions or comments, please feel free to email me at bobsadviceforstocks@lycos.com.
Bob
Posted by bobsadviceforstocks at 8:23 PM CDT
|
Post Comment |
Permalink
Updated: Friday, 29 July 2005 5:23 AM CDT
"Trading Transparency" American Healthways, Inc. (AMHC)
Hello Friends! Thanks so much for stopping by and visiting my blog,
Stock Picks Bob's Advice. As always, please remember that I am an amateur investor, so please consult with your professional investment advisors prior to making any investment decisions based on information on this website.
I just got finished posting my Mentor (MNT) post, and now my American Healthways (AMHC) has also hit a sale point. A few moments ago I sold 42 shares of my AMHC (out of a 170 share position) at $45.12/share. These shares were initially acquired 6/18/04 at a cost basis of $23.53, so I had a gain of $21.59 or 91.8%. This was my
third sale, so my targeted gain was at 90%!
I continue to work at paying down my margin, and even with these small sales, have just passed 50% equity.
Thanks so much for stopping by! If you have any comments or questions, please feel free to leave them right here on the blog or email me at bobsadviceforstocks@lycos.com.
Bob
"Trading Transparency" Mentor (MNT)
Hello Friends! Thanks so much for stopping by and visiting my blog,
Stock Picks Bob's Advice. As always, please remember that I am an amateur investor, so please consult with your professional investment advisors prior to using any information on this website to make any investment decisions.
As you probably know if you are a regular reader of this blog, I have an actual
"Trading Account" that I make actual investments and real trades based on strategy discussed on this blog and using investments also discussed here. I have my own set of trading rules that on first glance appear rather rigid, and actually on reinspection confirm that first impression! In a nutshell, I try to sell my losing stocks completely quickly, and sell my gaining stocks partially and slowly. My current goals for 1/4 position sales are at 30, 60, 90, 120, 180, 240...% gains.
A few moments ago, I sold 50 shares of my 200 shares of Mentor Corporation (MNT), representing 1/4 of my position, at the first targeted price gain of 30%. The transaction price was a sale at $45.20 this morning. I purchased my 200 shares of Mentor at $34.37 on 2/3/05, and thus, I had a gain of $10.83 or 31.5% on these shares.
Since I am up to 25 positions, I shall be applying the proceeds to my considerable margin balance. If I were not in margin, I would be adding to my "cash" levels. If I
were under 25 positions, my targeted size of my portfolio, I would be using the proceeds to add a new position, something I have done in the past, trying to "listen" to my portfolio telling me when to be moving into additional positions or moving out of equities into cash on sales of stocks on bad news. (or poor price performance).
Anyhow, I hope this discussion continues to be useful. I look forward to continuing to pay down margin while the stocks continue to appreciate in preparation for any eventual correction.
Bob
Wednesday, 27 July 2005
July 27, 2005 Anteon Intl Corp (ANT)
Hello Friends! Thanks so much for stopping by and visiting my blog,
Stock Picks Bob's Advice. As always, please remember that I am an amateur investor, so please consult with your professional investment advisors prior to making any investment decisions based on information on this website.

I have recently received a lot of email inquiries about "how" I pick a stock, and "why" and things like that. Let me try, once again and go over my thinking using a stock that seems to meet the requirements today.
My first stop in the process of finding a stock to discuss is to review the list of top % gainers. In this particular case, I found a stock to discuss on the
list of top % gainers on the NYSE today. Anteon International Corp (ANT) closed today at $47.86, up $2.06 or 4.50%, enough to make the top % gainers list. I do NOT own any shares of ANT nor do I have any options on this company.

What drove the stock higher today was the announcement of
2nd quarter 2005 results before the opening of trading. ANT reported revenues for the second quarter ended June 30, 2005, of $368.6 million, a 21.2% increase from $304.2 million last year same quarter. Net income climbed 36.2% to $20.0 million vs. $14.7 million in the same period last year. Fully diluted earnings per share came in at $.53/share vs. $.39 in the prior year, a gain of 35.9%.
In addition, Anteon's management raised full year 2005 revenue guidance to between $1.465 and $1.49 billion, and raised earnings expectations to $2.01 or higher. A great earnings report
combined with raised guidance is almost always a sure sign of success!

O.K. so what does Anteon do anyway? This company is a military contractor and receives contracts from the Air Force and Navy among other branches of the military. According to the
Yahoo "Profile" on ANT, Anteon "...provides information technology solutions, and systems engineering and integration services to government customers. It designs, integrates, maintains, and upgrades systems for national defense, intelligence, emergency response, and other government missions."
At this point we know that Anteon had a great quarter and made a nice move today. But what about longer-term? It is this historic record of revenue and earnings growth that suggests a possible persistence of this performance which I believe is the basis for stock price appreciation.
Anyhow, for this information I like to turn to Morningstar.com, and the particular information I like to use is on the
"5-Yr Restated" financials page. Here we can see that the revenue stream starts in 2001 at $.7 billion and has been steadily growing each year to the current $1.33 billion in the trailing twelve months (TTM).
The earnings record is not as long but shows growth from $.98 in 2003 to $1.78 in the TTM.
Free cash flow which was a negative $(5) million in 2002, has improved substantially to $65 million in the TTM.
Looking at the balance sheet as presented on Morningstar.com, we can see that the company has $35.1 million in cash and $314.6 million in other current assets, plenty to cover both the $180.7 million in current liabilities
and the $176.1 million in long-term liabilities.

What about "valuation"? Looking at
Yahoo "Key Statistics" on ANT, we can see that this is a mid cap stock with a market capitalization of $1.75 billion. The trailing p/e is moderate at 26.90, with a forward p/e of 21.27 (fye 31-Dec-06). The PEG is reasonable at 1.37.
Insofar as the Price/Sales ratio is concerned, as I have mentioned elsewhere,
Paul Sturm has discussed the Price/Sales ratio on Smart Money, and suggests it is the valuation relative to other members of the particular industrial group that determines whether the stock has a reasonable, cheap, or expensive valuation in regards to this parameter.
Using my Fidelity brokerage account for this data, I found that ANT is in the "Information Technology Services" group. The top Price/Sales value is SRA Int'l (SRX) at 2.4, followed by Affiliated Computer Services (ACS) at 1.5, Anteon (ANT) at 1.3, Computer Sciences Corp (CSFC) at 0.6, and at the bottom of the heap is Electronic Data Services (EDS) with a Price/Sales ratio of only 0.5. Thus, ANT appears to be in the middle of this particular group.
Other statistics from Yahoo show that there are 36.51 million shares outstanding with 32.17 million of them that float. Of these there were 2.17 million shares out short as of 5/10/05, representing 3.6 trading days or 6.10% of the float. This appears to be mildly significant (slightly over my "3-day rule").
No cash and no stock dividends are reported on Yahoo.
Taking a look at a
"Point & Figure" chart on Anteon from Stockcharts.com:
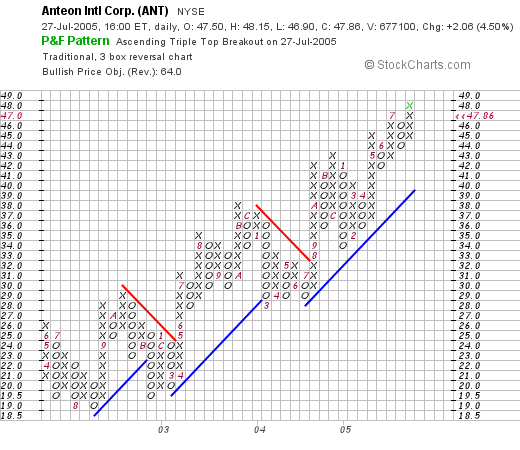
We can see that this stock really has been trading steadily higher from August, 2002, when it was at $19, to its current level of $47.96. This graph looks strong yet not overvalued to me.
So what do I think? Well, I am not trying to politically correct or incorrect here, but Anteon does seem to fit the bill. If one subscribes to this type of security spending as cyclical, we could be late in the cycle. However, if this is going to be a persistent expenditure, this company could continue to grow for many years.
In summary, the stock moved nicely today on a great earnings report and also raised guidance. The past several years have been strong both in regards to revenue and earnings growth. The company is free cash flow "positive" and the balance sheet looks nice. Valuation is reasonable if not cheap and the chart looks solid. These are the things that I like to use on this blog!
Of course, I am at 25 positions now, and am not in any type of position to be adding a new stock. However, if I were....you know how badly that nickel always burns a hole in my pocket! LOL....Please email me at bobsadviceforstocks@lycos.com if you have any questions or comments.
Bob
Newer | Latest | Older


