Stock Picks Bob's Advice
Saturday, 12 November 2005
"Looking Back One Year" A review of stock picks from the week of September 6, 2004

Hello Friends! Thanks so much for stopping by and visiting my blog,
Stock Picks Bob's Advice. As always, please remember that I am an amateur investor, so please remember to consult with your professional investment advisors prior to making any investment decisions based on information on this website.
As I like to do on weekends, this is a review of past stock picks from about a year earlier on this blog. These may include stocks that I own, but generally, these are just selections that have been discussed on this website and are not stocks that I have any ownership in. In order to simplify this review process, I assume a buy and hold strategy in this review. In practice, if you have been following what I write, you will know that I do
not buy and hold, but rather sell my stocks quickly if they decline after a first purchase, or sell portions of them slowly if they appreciate in price. Please keep this in mind when reviewing my discussions!

On September 7, 2004, I
posted Aviall (AVL) on Stock Picks Bob's Advice at $21.30. AVL closed at $31.69 on 11/11/05, for a gain of $10.39 or 48.8% since posting.

On October 20, 2005, AVL
reported 3rd quarter 2005 results. Net sales grew 13% over the prior year to $334 million from $295 million the prior year. Earnings per share climbed to $.41/diluted share in the quarter up 37% from $.30/share in the prior year same period. This was a solid report imho.

On September 8, 2004, I
posted Sierra Wireless (SWIR) on Stock Picks Bob's Advice at $19.15. SWIR closed on 11/11/05 at $12.59, for a loss of $(6.56) or (34.3)%.

On October 27, 2005, SWIR reported
3rd quarter 2005 results. For the 3rd quarter ended September 30, 2005, decreased 53.5% to $27.5 million this year compared with $59.1 million in the same quarter last year. Net loss for the 3rd quarter 2005 was $(3.1) million or $(.12)/share, down from net earnings of $7.1 million or $.27/share in the third quarter 2004.

On September 11, 2004, I
posted Leadis (LDIS) on Stock Picks Bob's Advice at $12.68. LDIS closed at $5.18 on 11/11/05, for a loss of $(7.50) or (59.1)%.
On October 20, 2005, LDIS reported
3rd quarter 2005 results. Revenues came in at $17.6 million, down from $40.9 million the prior year. The company reported a loss of $(2.5) million or $(.09)/diluted share down from net income of $5.0 million or $.16/diluted share the prior year.
So how did we do? Well, not very well :(. I had one gain of the three and two losers with an average of loss of (14.9)% on the three stocks. This, as I wrote, assumes a buy and hold approach and emphasizes, imho, the importance of selling losers quickly to prevent these large losses that can accrue even from stock picks where I have done "my homework".
Thanks again for stopping by and visiting! If you have any comments or questions, please feel free to email me at bobsadviceforstocks@lycos.com or leave your words right here on the blog!
Bob
"Weekend Trading Portfolio Analysis" Jos. A Bank Clothiers (JOSB)

Hello Friends! Thanks so much for stopping by and visiting my blog,
Stock Picks Bob's Advice. As always, please remember that I am an amateur investor, so please remember to consult with your professional investment advisors prior to making any investment decisions based on information on this website.
I am glad to be back blogging after a few days hiatus. Sometimes I get so busy in my daily responsibilities that I have a hard time finding the time to get to my computer and blog! If you missed my posting, well I appreciate your interest. If you didn't notice that I hadn't been writing, well, then I didn't disappoint I guess :).
This blog has two parallel activities going on. First, I generally have been writing about stock market ideas that I find attractive as potential stocks that might be showing appreciation in price in the future. In addition, I try to share with you my own experiences in dealing with the stock market, by posting my actual holdings and transactions within my trading portfolio. These holdings are generally stocks that I have purchased from the greater list of "stock picks" and share the same characteristics of stocks that I discuss on the blog.
Several weeks ago I started reviewing the stocks in my trading portfolio on weekends. Going alphabetically, last week I
discussed Hibbett Sporting Goods. This week, I would like to share with you my experience with Jos. A Bank Clothiers (JOSB).

On April 4, 2005, I purchased 240 shares of Joseph A. Bank Clothiers (JOSB) at a price of $31.90/share. On June 7, 2005 I sold 60 shares of JOSB at $41.62/share for a gain of $9.72/share or 30.5% from my purchase cost. Thus, this represented 1/4 of my holdings at my first sale target, which as you may know is a 30% gain. Currently, I own 180 shares of JOSB which closed 11/11/05 at $46.21. This represents a gain of $14.31 or 44.9% from my purchase in April. My next sale will be at a 1/4 of my holdings sale at a 60% gain or 1.6 x $31.90 = $51.04, or if the stock should decline, I shall be selling
all of my remaining shares at approximately break-even or $31.90.
O.K., let's take a look at the stock and update our review. By the way, I first
posted Jos. A Bank on Stock Picks Bob's Advice on August 7, 2003 when it was trading at $44.16. JOSB had a 3:2 stock split on 2/19/04, and a 5:4 stock split on 8/19/04 giving me an effective "pick price" of $44.16 x 2/3 x 4/5 = $23.55. Thus, the stock has actually appreciated $22.66 or 96.2% since first posting on the blog in August, 2003.

According to the
Yahoo "Profile" on Jos. A Bank, the company "...engages in designing, retailing, and direct marketing men't tailored and casual clothing, and accessories in the United States. It offers formal, business, and business casual apparel, as well as sportswear and golf apparel."
Probably a step that I regularly do but do not always discuss on this blog is to scan the news stories for anything that might be affecting this stock. Looking through the headlines, a very significant recent story was the
announcement, on November 3, 2004, of October, 2005 sales. Since JOSB does a lot of internet sales as well as actual "bricks and mortar" stores, it is helpful to look at total sales as well as same store sales. As I was discussing in the earlier post on a reader question on the Limited, I generally would like to see
at least high single digit same store sales growth reports.
Jos A Bank, in this report, noted that October sales overall grew 28.5% to $37.0 million compared with sales of $28.8 million in October, 2004. This was a GREAT number to report! Better yet, look at the "same store sales" number: an increase of 16.2%! This company is having an outstanding period of growth with solid catalog and internet sales growth of 19.5% and same store sales growth in the mid teens! Looking at retail ventures, this is about as good as it gets!
Having scanned the news on this stock, I like to look at the latest quarterly earnings report. On September 6, 2005, JOSB
reported 2nd quarter 2005 results. During the quarter ended July 30, 2005, total sales increased 20.2% to $98.6 million, compared with $82.0 million in the prior year same period. During the quarter, same store sales increased 4.9%, and combined catalog and internet sales jumped 23.4% during the quarter. Net income increased to $5.3 million for the quarter up from $3.4 million and earnings per share increased 54% to $.37/share up from $.24 in the same period last year. The company actually raised guidance for the
second time this year within the earnings report. As Robert Wildrick, CEO of JOSB stated:
"Based on these strong results and the current business outlook, we are raising our earnings guidance for the second time for the year ending January 28, 2006 (fiscal 2005) to at least $2.15 to $2.19 per share, compared with $1.72 per share in fiscal 2004."
This was a very strong earnings report!
What about longer-term? Taking a look at the
Morningstar.com "5-Yr Restated" financials on JOSB, we can see the steady increase in sales from $206 million in 2001 to $406 million in the trailing twelve months (TTM). Earnings have also steadily improved from $.43/share in 2001 to $1.95/share in the TTM.
The free cash flow has been a bit erratic, dropping from $12 million to $(31) million in 2004 but has improved to $10 million in the TTM.
The balance sheet is solid with $1.1 million in cash and $189.5 million in other current assets, enough to cover both the $97.8 million in current liabilities and the $52.1 million in long-term liabilities.
How about valuation? Reviewing the
Yahoo "Key Statistics" for JOSB, we can see that this is a small mid-cap stock with a market cap of $630.54 million. The company has a very reasonable p/e of 23.73 and a forward p/e (fye 29-Jan-07) of 17.70. The PEG is a reasonable .78. (Anything under 1.0 is a great buy imho if everything else is in order.) Yahoo reports only 13.65 million shares outstanding with 4.04 million shares (10/11/05) our short (!) representing 12.3 trading days of volume. With the reasonable valuation and fabulous earnings report, I have to wonder what these short-sellers were smoking, and whether they are now scrambling to buy some shares back. Looks like a squeeze to me. But then again I am just an amateur.
No cash dividend is reported and Yahoo reports, as I mentioned above, the 5:4 stock split on 8/19/04.
How about a chart? Looking at a
"Point & Figure" chart on JOSB from Stockcharts.com:
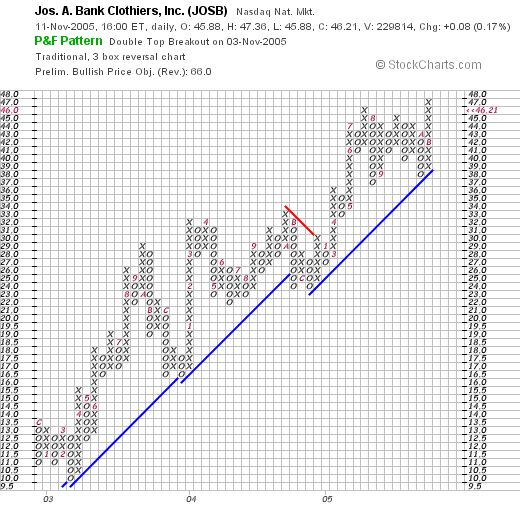
This chart looks quite strong with the stock bouncing off a support line at $10/share in March, 2003, and moving almost perfectly higher to the $47 range recently reported. A very strong chart with strong underlying fundamentals.
So what do I think? Well, I own the shares :). But seriously, the stock looks great with an accelerating earnings report, steady growth, great latest quarter, reasonable valuation, strong chart, and a bunch of short-sellers probably looking to cover their sales with a relatively limited number of shares to find to buy.
Thanks again for stopping by! Excuse my occasional absence from the blog. And do come back and visit, comment, and send me any of your questions or thoughts at bobsadviceforstocks@lycos.com. Also, feel free to comment right on the blog!
Bob
Monday, 7 November 2005
A Reader Writes "Have you ever looked at Limited or Limited Brands?"
Hello Friends! Thanks so much for stopping by and visiting my blog,
Stock Picks Bob's Advice. As always, please remember that I am an amateur investor, so please remember to consult with your professional investment advisors prior to making any investment decisions based on information on this website.
I was checking my email this afternoon and found a very nice letter from John A. D. who wrote:
Bob: this is a really impressive site. I should say a work of
art. Congrats and please keep up the great work. BTW, have you
ever looked at Limited or Limited Brands?
John A. D.
Well first of all John, Thank You! Thanks for the kind words, the encouragment, and your participation here on the blog.
One of the downsides of being truly an amateur is that the organization of this blog is rather amateurish :). I actually had to go and Google myself with Limited to see if I had written this stock up! I don't believe I have but I would be happy to take a brief look. Let's view the latest quarter, the Morningstar report, and a chart and see what it looks like. I don't own any shares or options on this company.

First, the latest quarterly report. On August 18, 2005, Limited Brands (LTD)
reported 2nd quarter 2005 results. As reported: "Comparable store sales for the quarter ended July 30, 2005 were flat and net sales of $2.291 billion increased 4% compared to $2.211 billion last year." This isn't very encouraging :(. Earnings per share, as reported in the same news story, actually
declined to $.27/share in the quarter from $.31/share the prior year. This is also a negative. Operating income was $203.9 million, compared with $226.9 million last year, with net income of $113.1 million this year compared with $148.0 million last year. With flat same store sales, and declining net income, I wouldn't really look any further for a stock pick on this website.

To make matters worse, imho, the news on the same store sales figure lately have been worse. As
reported on November 3, 2005, same store sales for the four weeks just ended on October 29, 2005, declined 4% with net sales declining 1% to $629.0 million for the period down from $633.8 million last year. When looking at retail companies, it is imperative, imho, to choose those companies with same store sales growth consistently in the mid single digits or higher.
What about Morningstar? Looking at the
"5-Yr Restated" financials from Morningstar.com, we can see that revenue has been stagnant the last few years with $10.1 billion in sales in 2001, and $9.5 billion in sales in the trailing twelve months (TTM).

Earnings have been a bit erratic, increasing from $.96/share in 2001, to $1.47 by 2005. However, earnings actually
declined to $1.31/share in the TTM.
Free cash flow has been solidly positive with $434 million reported in the TTM. The balance sheet also looks satisfactory with $719.1 million in cash and $1.5 billion in other current assets. This is to be balanced against $1.26 billion in current liabilities and $2.3 billion in long-term debt.
Looking at some
"Key Statistics" on LTD from Yahoo, we can see that this is a large cap stock with a market capitalization of $8.41 Billion. The trailing p/e is a very reasonable 15.37, the forward p/e is even nicer at 13.97 (fye 29-Jan-07). Thus Yahoo has the PEG at a very reasonable 1.16.
Looking at the
Fidelity.com eresearch snapshot on LTD, we find Limited Brands in the "Apparel Stores" Industrial Group. Within this group, the Limited Brands is the best bargain with a Price/Sales ratio of only 0.9. Topping the list is Abercrombie & Fitch (ANF) with a ratio of 2.3, followed by American Eagle (AEOS) at 1.9, PacSun (PSUN) at 1.6, and Gap (GPS) at 1.0. By this criterion, Limited is a good value investment.
How about a chart? Looking at a
"Point & Figure" chart on LTD from Stockcharts.com:
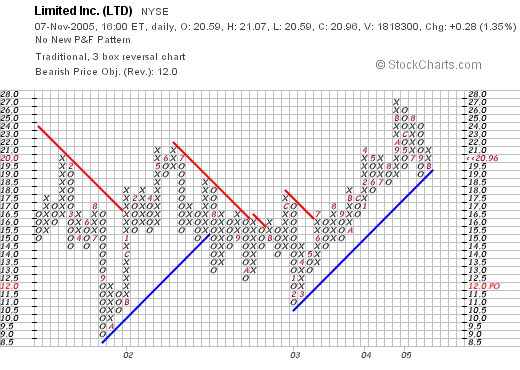
We can see that the stock price has been essentially moving sideways between early 2001 and June, 2003, when it broke through resistance at $16. The stock has been trading higher fairly steadily since then, but is showing some weakness recently, testing support levels around $21. The stock chart looks reasonably bullish imho.
 So what do I think? Well, I am not a big booster of this stock and would not include it as a "pick" on this blog. "Why?" you might be asking. Well, for one thing, the latest quarter didn't qualify with flat revenue and declining earnings. Furthermore the latest same store sales figures were actually negative. And revenue over the past five years has gone absolutely nowhere.
On a positive note, free cash flow is positive, the balance sheet is reasonable and valuation is actually very nice, with a relatively low P/E, a PEG just over 1.0 and a Price/Sales ratio which is the lowest in its industrial group. The chart also looks modestly optimistic.
However, I am not in any way a value investor. I am not interested in getting good value for my investment. Instead, I am looking for growth in earnings and revenue with a solid balance sheet and a good chart as well. Limited Brands (LTD) just doesn't make the grade imho.
Thanks again for stopping by! And thanks for the encouragement and the question. I hope that I can continue to live up to your expectations. If you or anyone else has any questions, please feel free to leave them on the blog or email me at bobsadviceforstocks@lycos.com. I will answer any comments on the blog at the same entry they were posted.
Bob
November 7, 2005 Tennant Co. (TNC)
Hello Friends! Thanks so much for stopping by and visiting my blog,
Stock Picks Bob's Advice. As always, please remember that I am an amateur investor, so please remember to consult with your professional investment advisors prior to making any investment decisions based on information on this website.

As I work through the process of finding new stock market investment ideas, I first like to look through the lists of stocks that are showing strong upward momentum. In practice this means checking the lists of top percentage gainers for the day!
Reviewing the
list of top % gainers on the NYSE today, I came across Tennant (TNC) which appears to fit my idea of a good idea for an investment! As I write, TNC is trading at $47.85, up $2.50 on the day or 5.51%. I do not own any shares or options on this stock.
According to the
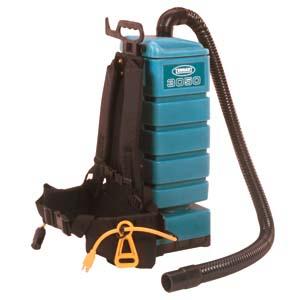
Yahoo "Profile" on TNC, this company "...engages in the design, manufacture, and marketing of products used primarily in the maintenance of nonresidential surfaces. Its products include machine products, including carpet cleaners, floor coatings, brushes, detergents, floor maintenance equipment, outdoor cleaning equipment, coatings, and related products, as well as vacuums, sweepers, and scrubbers are used to clean factories, office buildings, parking lots and streets, airports, hospitals, schools, warehouses, and shopping centers."
One of the first things I like to check when looking at a possible "selection" for the blog, is the latest quarterly results. I insist on growth in both earnings and revenue in the latest period. Tennant
reported 3rd quarter 2005 results on October 27, 2005. Net sales came in at $137.8 million, up from $120.5 million last year for the quarter ended September 30, 2005. Net earnings grew to $6.3 million, or $.69/diluted share, up 123% from the $2.8 million or $.31/diluted share last year. In addition, the company raised guidance for the remainder of 2005.
How about longer-term?

Reviewing the
Morningstar.com "5-Yr Restated" financials on TNC, we can see that revenue has climbed steadily, except for a dip between 2000 and 2001, from $452.2 million to $523.0 million in the trailing twelve months (TTM).
Similarly, earnings, which dropped from $3.04/share in 2000 to $.50/share in 2001, have also steadily increased since then to $1.90/share in the TTM. Free cash flow has been solidly positive, increasing from $6 million in 2002 to $18 million in the TTM.
The balance sheet, as presented by Morningstar, looks nice with $22.3 million in cash and $156.2 million in other current assets. This is plenty to cover both the $72.2 million in current liabilities and the $26.1 million in long-term liabilities more than 1.5 times over.
Looking at
Yahoo "Key Statistics" on TNC, we can see that this is a very small company with a market capitalization of only $429.15 million. The trailing p/e is a reasonable 19.33 with a forward p/e (fye 31-Dec-06) even nicer at 16.53. There is no PEG listed, but with the latest quarter showing dynamic growth, this would likely be under 1.0 (imho).
Using the
Fidelity.com eresearch website, we can find that this company is in "Diversified Machinery" industrial group, and is a relative bargain on the Price/Sales basis. Topping this list is Roper Industries (ROP) with a Price/Sales of 2.7, Idex (IEX) at 2.2, Illinois Tool Works (ITW) at 1.9, and Ingersoll-Rand (IR) at 1.3. At the bottom of the list is boath Eaton (ETN) at 0.8, and Tennant (TNC) at 0.8 as well. Looks like a nice value for this company on this basis.

Finishing up some additional information from Yahoo, we find that there are only 8.95 million shares outstanding with 222,510 shares out short representing 2.50% of the float or 4.5 trading days of volume as of 10/11/05. This is somewhat significant and may be adding to the buying pressure we are observing.
Interestingly, (is that a word?), the company
does pay a small dividend of $.88/share yielding 1.90%. The last stock split reported by Yahoo was a 2:1 split in April, 1995.
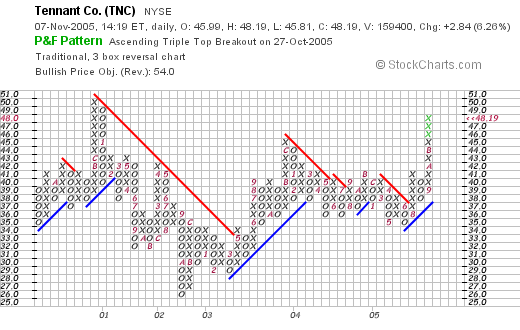
What about the chart? Taking a look at the
"Point & Figure" chart on Tennant (TNC) from Stockcharts.com, we can observe that the stock has moved sideways pretty much since 2000, and only recently, broke through resistance at $38/share in August, 2005, and has moved strongly higher since. At least over the short-term, the chart looks strong to me.
So what do I think? This is a fascinating stock pick imho. If only I had a signal to be buying some stock...well that is another post altogether! I like the latest quarterly report, the past five years results looks nice with the company growing both revenue and earnings (except for a dip between 2000 and 2001), free cash is solidly positive, and the balance sheet is nice. The company even pays a dividend. The P/E is low and the Price/Sales is the lowest in its group. The chart shows upward movement but certainly is not overvalued or overextended imho.
Thanks so much for stopping by and visiting! If you have any comments or questions please feel free to leave them on the blog or email me at bobsadviceforstocks@lycos.com.
Bob
Saturday, 5 November 2005
"Looking Back One Year" A review of stock picks from the week of August 30, 2004
Hello Friends! Thanks so much for stopping by and visiting my blog,
Stock Picks Bob's Advice. As always, please remember that I am an amateur investor, so please remember to consult with your professional investment advisors prior to making any investment decisions based on information on this website.
In the previous post, I discussed a stock from my actual trading portfolio. In this post, I shall be reviewing stocks that I have "picked" for review but do not necessarily own. In fact, I
do own Cooper Companies in my trading account, but do not own any shares or options of Polaris Industries (PII).

On September 1, 2004, I
posted Cooper Companies (COO) on Stock Picks Bob's Advice at $63.33/share. COO closed at $72.74 on 11/4/05, for a gain of $9.41 or 14.9% since posting.
On September 7, 2005, COO
reported 3rd quarter 2005 results. For the quarter ended July 31, 2005, revenue came in at $222.1 million, 72% over the third quarter 2004 results. Income was $37.88 million, up over 50% from the $24.6 million reported the prior year. On a diluted per share basis, earnings came in at $.79/share, up 18% from the $.67/share reported the prior year same period.

On September 2, 2004, I
posted Polaris Industries (PII) on Stock Picks Bob's Advice when it was trading at $51.00/share. PII closed at $46.17/share on 11/4/05, for a loss of $(4.83) or (9.5)% since posting.
On October 13, 2005, Polaris (PII)
announced 3rd quarter 2005 results. Sales from continuing operations for the quarter increased 6% to $543.1 million, compared with $510.6 million the prior year. Net income from continuing operations came in at $1.17/dilued share, up 17% from last year's net income of $1.00/diluted share. However, the company did reduce full year 2005 results and this was enough to "throw some cold water" on the stock chart.
So how did we do? Well, I only "picked" two stocks that week, and Cooper showed a gain of 14.9%, and Polaris showed a loss of (9.5)% since posting. Averaging the two stocks, we get an appreciation of only 2.7% for the two stocks since they were introduced the prior year.
Thanks again for visiting! If you have any questions or comments, please feel free to email me at bobsadviceforstocks@lycos.com or feel free to leave you comments right on the blog!
Bob
"Weekend Trading Portfolio Analysis" Hibbett Sporting Goods (HIBB)
Hello Friends! Thanks so much for stopping by and visiting my blog,
Stock Picks Bob's Advice. As always, please remember that I am an amateur investor, so please remember to consult with your professional investment advisors prior to making any investment decisions based on information on this website.

I occasionally get emails from people who are trying to figure out exactly
what I am doing on my blog! Basically, this website is about two things: stock market investment ideas that I find attractive, and my own experience using those same ideas and the same strategy in developing a trading portfolio. Several weeks ago, I decided to systematically review each of my actual holdings in my portfolio and share with you my experience with those stocks and the current status of those investments.
Last week, I
reviewed Genesco (GCO) on Stock Picks Bob's Advice. Going alphabetically through my current holdings, my next stock to discuss is Hibbett Sporting Goods (HIBB).

I currently own 111 shares of Hibbett (HIBB) in my trading account that was acquired 3/6/03 with a cost basis of $6.50/share. HIBB closed on 11/4/05 at $27.15, giving me a gain of $20.65/share or 317.7% for this stock(!). This investment has been a superstar in my portfolio!
I have sold portions of my original investment eight times (!), representing sales at 30%, 60%, 90%, 120%, 180%, 240% 300%, and 360%. Thus, my current next sale point would be either at a 450% (now going by 90% intervals) or $6.50 x 5.5 = $35.75 or on the downside, at a 180% gain level (half of the highest appreciation point or $6.50 x 2.80 = $18.20.
On August 18, 2005, HIBB
reported 2nd quarter 2005 results. Revenue for the quarter ended July 30, 2005, climbed 15.0% to $94.0 million, compared with $81.8 million for the prior year same period. During the quarter comparable store sales jumped 3.1%. Net income grew strongly by 66.9% to $4.9 million, up from $2.9 million the prior year. On a diluted per share basis, this worked out to a 75.0% increase to $.21/share, up from $.12/diluted share the prior year. In addition, the company raised 2006 guidance and announced a 3:2 stock split!
Taking a look at the
"5-Yr Restated" financials for HIBB from Morningstar.com, we can see that revenue growth has remained perfectly steady increasing from $209.6 million in 2001 to $408.1 million in the trailing twelve months (TTM).
Earnings have increased steadily as well from $.32/share in 2001 to $.85/share in the TTM. Free cash flow has been positive, increasing from $11 million in 2003 to $27 million in the TTM.
The balance sheet is solid with $48.9 million in cash and $125.8 million in other current assets balanced against $57.4 million in current liabilities and $9.7 million in long-term liabilities.
Looking at a
"Point & Figure" chart on HIBB from Stockcharts.com:
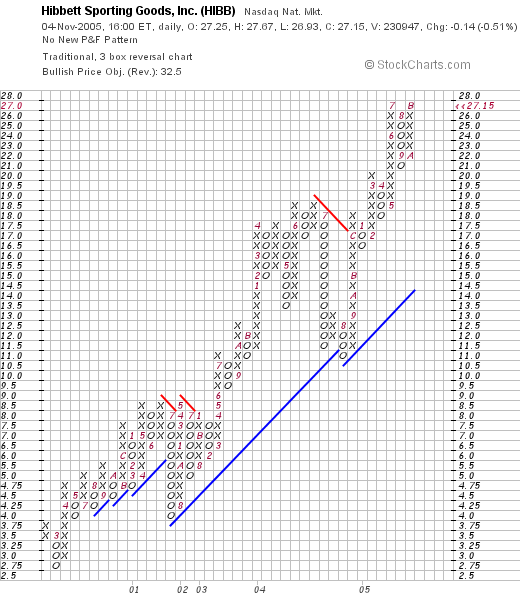
We can see an absolutely gorgeous graph with Hibbett appreciating steadily in price from $2.75 in March, 2000, to $27.50 level currently. The stock really has held to the support levels very nicely if not perfectly.
What do I think? This was a great investment for me! I cannot tell whether the future will continue to hold bright prospects for me or not but I have already hedged my bet so to speak having sold portions of this stock eight times already! Hopefully, the stock continues to advance as Hibbett spreads out opening sporting goods stores in small towns across America!
Thanks so much for stopping by! If you have any comments or questions, please feel free to email me at bobsadviceforstocks@lycos.com, or just go ahead and leave your words on the blog!
Bob
Friday, 4 November 2005
A Reader Writes "I hope you don't mind me picking your brain...."
Hello Friends! Thanks so much for stopping by and visiting my blog,
Stock Picks Bob's Advice. As always, please remember that I am an amateur investor and that you should always consult with your professional investment advisors prior to making any investment decisions based on information on this website.
Reading my mail this afternoon, I saw that a friend of mine, Jeff S. had written a note to me with a question. This is what he had to say:
Hi Bob,
I have been frequently visiting your blog and tying to make sense of the information you share. I especially like it when you explain your strategies of when to sell a stock i.e. 8% loss or 30% gain. If the stock gains the 30% and you sell of 1/4 of your position, then do you follow the same rule again i.e.. if it loses 8% sell all or if your remaining holdings or gains 30% again sell another 1/4? How many different stocks do you think someone could comfortably manage? I am very interested in trying a few stocks but really don't know how to get started. As I filter through your past bog entries, I make notes of your tips and techniques. I hope you don't mind me picking your brain for the answers to my rudimentary questions.
Thanks
Jeff S.
Jeff, first of all, thanks for visiting my blog and for writing! You have written me about my selling strategy, and I think you understand the bulk of my approach. However, just in case, let me summarize my approach to selling a stock.
After a first purchase of an investment, I only allow it to decline 8% prior to selling
all of the shares that I own. I enter these sales manually, but I am sure there are automatic ways to set this up at the time of purchase.
However, I also sell portions of stock on gains. You could say that I believe that by selling losing stocks quickly and completely, and by selling gaining stocks partially and slowly, I am biasing my investments to stocks that are performing well. That is the essential philosophy to my selling behavior.
Back to selling stocks. If stocks move higher in price, I sell them a little at a time. I only sell the entire position of any of my holdings on some sort of bad news or decline in the stock price. Currently, I have set price goals of 30%, 60%, 90%, 120%, and then by 60% intervals: 180%, 240%, 300%, 360%, and then by 90% intervals etc. At each of these particular stock price appreciation levels, I sell 1/4 of my remaining holdings. Basically, I am trying to sell my "winnings". What do I mean by that? Well if a stock appreciates by 30%, you basically have 4/3 of a stock, and then by selling 1/4 of the holding, you are back to approximately 3/3 of the original investment.
How about on the downside? How does this affect my strategy?
I learned much from reading William O'Neill who is the publisher of the Investor's Business Daily. He is the one who influenced me to set 8% stops on my losses. He also makes the astute suggestion that once one has made a gain on a stock, that you shoud avoid "giving it back" and move your stop up to a break-even position. That is exactly what I do. If I have sold once, that is a 1/4 position after a 30% gain, then my sale point on the downside is 'break-even' not an 8% loss.
However, if I have sold a stock more than once, like I did with my Dell stock, which I had sold twice, then one should sell all of the remaining shares if the stock retraces back 50% of the highest gain point sale. That is, as with Dell, since I had sold 1/4 of my position at a 60% gain, when the stock retraced back 50% of the highest gain-sale point, which for Dell was at a 30% gain, then I should and did unload the entire position.
You ask about "how many stocks" one can manage. I find the number relatively easy with my Fidelity account online. The brokerage house shows me the % gain or loss of each of my holdings as well as the history of prior sales, so it is a cinch for me to calculate when I need to sell a stock either on a retracement or on a gain. I have a 25 position maximum. I think that 20 positions would be an excellent size for a portfolio.
One thing that I believe in is, when starting a portfolio, start at 50% equity/50% cash. I would call this a neutral bias. Allow yourself to go down to 1/2 of your original # of holdings....if you shart at 10, allow yourself to only drop to 5, and stick to your previous goal of 20. Only add a new position on a sale of a partial position (1/4) on a gain. Use this as a signal to increase your exposure to equities. On the other hand, assuming you started with 10 different stocks, I would suggest you drop down to a minimum of 5 positions. After that, replace the stocks in the 5 positions if they hit 8% losses. But use sales of portions of the exising holdings as a signal to be adding positions.
I hope this explains my approach a little better to you! It is an idiosyncratic (I hope that's the right word!) strategy that works for me. You are welcome to utilize this approach as well. If you do, let me know how it works out. If you or any other reader has questions, please feel free to leave them on the blog or email me at bobsadviceforstocks@lycos.com.
Bob
Thursday, 3 November 2005
"Revisiting a Stock Pick" Fair Isaac (FIC)
Hello Friends! Thanks so much for stopping by and visiting my blog,
Stock Picks Bob's Advice. As always please remember that I am an amateur investor, so please remember to consult with your professional investment advisors prior to making any investment decisions based on information on this website.

I enjoy looking at stocks on this blog and finding stocks that may eventually appreciate in price. My strategy, as I have explained elsewhere, begins with monitoring the lists of
top % gainers; in this case, for the NYSE today.
Looking through the list, I came across Fair Isaac (FIC) which closed at $44.50, up $2.33 or 5.53% on the day. I do not currently own any shares of FIC nor do I have any options on this stock.
Reviewing the
Yahoo "Profile" on FIC, we can find that the company "...provides analytic, software, and data management products and services that enable businesses to automate decisions primarily in the United States, the United Kingdom, and Canada."

With literally hundreds of stocks discussed on this blog, I try to avoid repeating a stock "idea" for at least a year after its prior discussion. In this case, I
reviewed Fair Isaac on Stock Picks Bob's Advice on July 24, 2003, when it was trading at $55.42. FIC declared a 3:2 stock split making our effective price actually $55.42 x 2/3 = $36.95. Thus, the stock has appreciated only $7.55 or 20.4% since posting in 2003.
What drove the stock higher, and what has been driving so many similar stocks higher, was the announcement of quarterly results, in this case the
announcement of 4th quarter 2005 earnings. For the quarter ended September 30, 2005, revenues came in at $203.3 million, as compared to $190.4 million in the prior year same quarter, an increase in revenue of $12.9 million or 6.8% over the prior year. Net income came in at $35.7 million, or $.53/diluted share, compared to net income of $14.4 million or $.19/diluted share the prior year. This is greater than a 150% increase in net income year over year!

What about longer-term? Reviewing the
Morningstar.com "5-Yr Restated" financials on FIC, we can see the nice progression in revenue from $298.6 million in 2000 to $785.8 million in the trailing twelve months (TTM).
Earnings have grown (except for a dip from $.89/share in 2001 to $.32/share in 2002) from $.56/share in 2000 to $1.64/share in the trailing twelve months.
Dividends have also increased from $.04/share in 2000 to $.08/share in the TTM. Interestingly, the number of shares peaked at 72 million shares in 2003, and has now declined the past two years to 65 million in the TTM.
Free cash flow has been strong with $80 million reported in 2002 and $164 million reported in the TTM.
The balance sheet looks adequate with $254.4 million in cash, and $188.4 million in other current assets, plenty to cover the $133.8 million in current liabilites as well as almost all of the $408.5 million in long-term liabilities per Morningstar.

And how about some statistical measurements on this company? Looking at
Yahoo "Key Statistics" on FIC, we find that Fair Isaac is a large Mid-Cap stock with a market capitalization of $2.91 billion. The trailing p/e is a bit rich at 26.97 and the forward p/e (fye 30-Sep-06) is better at 21.60. The PEG ratio (5 yr expected) is also rich at 1.53.
Looking at the
Fidelity.com eresearch website, we can see that this stock is also fairly richly valued with a price/sales ratio of 4.4 in the "Business Services" industrial group. Topping this list is Global Payments (GPN) at 4.4, followed by Fair Isaac at 3.7, Equifax (EFX) at 3.4, Cintas (CTAS) at 2.3, Certegy (CEY) at 2.2 and IPAYMENT (IPMT) at 1.4.
Reviewing some more key statistics from Yahoo, we find that there are 65.38 million shares outstanding with 2.87 million shares out short as of 10/11/05. This represents 4.50% of the float or 6 trading days of volume (the "Short Ratio"). Thus, using my 3 days of short volume as a cut-off, this looks significant to me and may be driving the stock higher today in the face of good news.
The company, as noted earlier, does pay a dividend of $.08/share yielding 0.20%. The last stock split was a 3:2 split on 5/11/04.
And what does the chart look like? lookint at a
"Point & Figure" chart on Fair Isaac from Stockcharts.com:
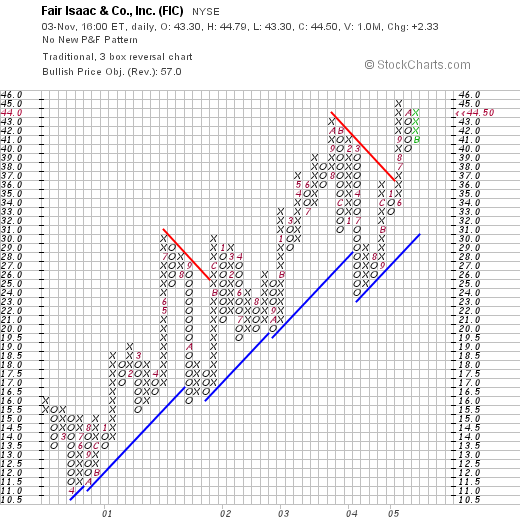
We can see a very strong chart with the company showing some significant short-term trading volatility but a long-term steady increase in price from $11.00/share in April, 2000, to the recent high near $45. The chart looks volatile but positive to me.
So what do I think? Well, I actually like this stock. The latest quarterly report was quite strong and I believe the company exceeded expectations. The past five years have been a bit inconsistent but strong overall, with free cash positive and growing and a solid balance sheet. Valuation in terms of PEG and Price/Sales ratios have been a bit on the expensive side as well.
The chart looks nice and I especially appreciate the company's effort at buying back shares to reduce the number of shares outstanding. All-in-all I like the stock even though it is not a big bargain in terms of P/E, PEG, and Price/Sales ratios.
Thanks so much for stopping by! Please feel free to comments right on the blog or email me at bobsadviceforstocks@lycos.com if you have any comments or questions!
Bob
Wednesday, 2 November 2005
November 2, 2005 Aspect Medical (ASPM)
Hello Friends! Thanks so much for stopping by and visiting my blog,
Stock Picks Bob's Advice. As always, please remember that I am an amateur investor, so please remember to consult with your professional investment advisors prior to making any investment decisions based on information on this website.

Sometime around noon, I was scanning the
list of top % gainers on the NASDAQ today, and found Aspect Medical (ASPM) on this list. The stock looks like a good fit to what we do here. Unfortunately, with all of the other stocks doing well late in the day, the stock was no longer on the list of top gainers! However, it is still worth a look. I do not own any shares nor do I have any options on this stock.

Aspect had a great day today, closing at $35.40, up $2.92 or 8.99% on the day. According to the
Yahoo "Profile" on Aspect Medical, the company "...and its subsidiaries engage in the development, manufacture and marketing of an anesthesia monitoring system called the BIS system. The company's BIS system provides information that enables clinicians to assess and manage a patient's level of consciousness in the operating room and intensive care settings, and administer the amount of anesthesia needed by each patient."
I recently wrote up a similar company,
Somanetics, on Stock Picks Bob's Advice, that is also in the anesthesia monitoring business. This must be an important growth area in the medical field.
Trying to avoid sounding like a broken record, what drove the stock higher today was the
announcement of 3rd quarter 2005 results. Revenue came in at $19.6 million for the quarter ended October 1, 2005, an increase of 44% (!) over the $13.6 million reported in the third quarter of 2004. Net income came in at $2.6 million or $.11/share on 24.2 million diluted shares, up about 400% from $520,000 or $.02/share on 22.4 million diluted shares last year. This was $.04 ahead of analysts estimates of $.07/share and ahead of revenue estimates of $19.3 million for the quarter. In addition, the company guided estimates for earnings higher for the upcoming fourth quarter. The combined strong earnings/revenue results that also exceeded estimates along with the raised guidance was enough to push the stock price higher!

How about 'longer-term'? Looking at the
Morningstar.com "5-Yr Restated" financials on ASPM, we can see that except for a small dip in revenue from $36 million in 2000 to $35.8 million in 2001, the company has grown revenue steadily to $65.2 million in the trailing twelve months (TTM).
Aspect has been improving its earnings picture, from a loss of $(1.01) in 2001, the company turned profitable at $.01/share in 2004, with $.19/share in the TTM.
Free cash flow, which was also negative at $(6) million in 2002, improved to a negative $(2) million in 2004 but a positive $5 million in the trailing twelve months.
The balance sheet, as reported on Morningstar, looks excelent with $40.2 million in cash alone, enough to cover both the $13.9 million in current liabilities
and the $4.7 million in long-term liabilities over two times over. In addition, the company has an additional $15 million in "other" current assets.
Looking at
Yahoo "Key Statistics" on Aspect Medical for some valuation numbers, we can see that this is a mid cap stock with a market capitalization of $765.24 million. The trailing p/e is an astronomic 202.29, with a forward p/e of 66.79 (fye 31-Dec-06). This is not of much concern to me as the company is growing earnings rapidly and just turned profitable.
The company also looks richly priced in terms of Price/Sales with a statistic of 11.9 at the top of the group of "Medical Appliances/Equipment" according to
Fidelity.com eresearch on ASPM. Following Aspect is St. Jude (STJ) with a Price/Sales of 7.1, Medtronic (MDT) at 6.6, Zimmer Holdings (ZMH) at 5, Biomet (BMET) at 4.6, and Edwards Lifesciences (EW) at 2.7. Thus, the stock isn't a "bargain" based on this particular parameter also.
Going back to Yahoo, we can see that they are reporting 21.62 million shares outstanding with 1.45 million shares out short as of 10/11/05. This is 7.00% of the float or 8.7 trading days of volume. The "shorts" might have been "squeezed" today as the stock moved higher on great news. No cash dividend is reported on Yahoo, and no stock dividends are noted as well.
What about a chart? Taking a look at the
Stockcharts.com "Point & Figure" chart on ASPM:
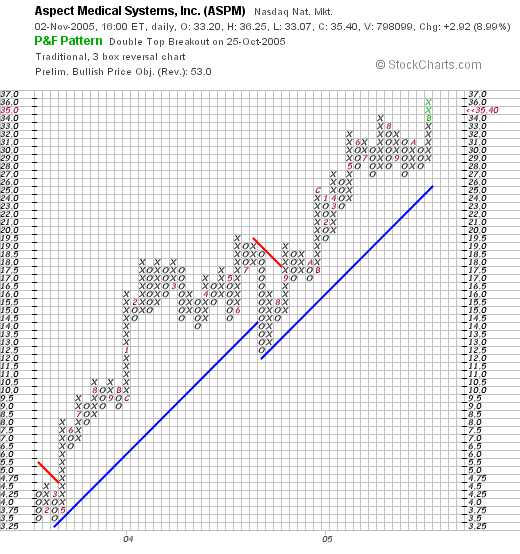
We can see what is an absolutely gorgeous graph! In May, 2003, the stock broke through a resistance level at $4.75 and has been trading strongly higher ever since! You won't see too many stronger graphs, imho, on this blog!
So what do I think? Frankly, I like this stock. It is a small company with a phenomenal quarter a provocative product, a nice Morningstar.com report with steady revenue and improving earnings. The company is just turning profitable as well as turning free cash flow positive. In addition the company has a solid balance sheet. On the downside, with the recent turn to profitability the company has an astronomic p/e but this should be dropping quickly. The Price/Sales ratio is also steep. Finally, the graph is spectacular :).
Too bad I don't have a signal to be buying some stock :(. I know where I would be shopping today!
Thanks so much for stopping by! If you have any questions or comments, and if you don't mind me writing up a response on the blog, please drop me a line at bobsadviceforstocks@lycos.com. Or you could always leave your comments right on the blog itself! Regards to all of my friends!
Bob
Monday, 31 October 2005
"Revisiting a Stock Pick" Hi-Tech Pharmacal (HITK)
Hello Friends! Thanks so much for stopping by and visiting my blog,
Stock Picks Bob's Advice. As always, please rememember that I am an amateur investor, so please remember to consult with your professional investment advisors prior to making any investment decisions based on information on this website.

I looked through the
list of top % gainers on the NASDAQ today, and came across Hi-Tech Pharmacal (HITK) which closed at $37.55, up $3.78 or 11.19% on the day. I do not own any shares nor do I have any options on this company.

I first
posted HITK on Stock Picks Bob's Advice on September 8, 2003, when the stock was trading at $28.75. Thus, we have a gain of $8.80 or 30.6% since posting this stock here a little over two years ago!
According to the
Yahoo "Profile" on Hi-Tech Pharmacal, the company "...engages in the manufacture and marketing of prescription, over-the-counter, and nutritional products in liquid and semi-solid dosage forms in the United States. It manufactures generic and branded products, most of which are prescription items and include oral solutions and suspensions, as well as topical creams and ointments."

On September 8, 2005, HITK
1st quarter 2006 earnings results. For the quarter ended July 31, 2005, net sales came in at $15.4 million, a 27% increase over the $12.1 million for the same quarter ended July 31, 2004. Net income for the quarter was $1.4 million, a 62% increase over the $869,000 reported in the same quarter in 2004. Fully diluted earnings per share climbed 60% to $.16/share from $.10/share in the same quarter last year. These were great results for this relatively small company!
Looking longer-term at the
"5-Yr Restated" financials from Morningstar.com on HITK, we can see the beautiful series of purple bars representing the steady growth in revenue from $29.6 million in 2001 to $71 million in the trailing twelve months (TTM).
Earnings have also steadily grown (except for a flat year between 2003 and 2004), from $.36/share to $1.02/share in the TTM. Free cash flow has been positive and growing from $4 million in 2003 to $8 million in the TTM.
The balance sheet, as presented on Morningstar.com, is absolutely 'gorgeous', with $39.1 million in cash, enough to pay the combined $11.8 million in current liabilities and the $1.2 million in long ter liabilities, more than 3 times over! In addition, the company has another $23.9 million in other current assets.
What about some "valuation statistics"? Looking at
Yahoo "Key Statistics" on HITK, we can see that this is a very small company, with a market capitalization of only $295.71 million. The trailing p/e is a bit rich at 36.67, with a forward p/e of 30.67 (fye 30-Apr-07). No PEG is reported by Yahoo.
Reviewing the data from the
Fidelity.com eresearch website, we can see that HITK has been assigned the "Drugs-Generic" industrial group. Within this group of stocks, HITK is moderately priced with a Price/Sales ratio of 4.2. Ahead of HITK is Bar Pharmaceuticals (BRL) with a ratio of 5.8, Mylan (MYL) at 4.5; stocks with ratios lower than HITK, included Ivax (IVX) at 3.8, Watson Pharmaceuticals (WPI) at 2.5, and Par Pharmaceutical (PRX) at 1.8.
Reviewing some additional figures from Yahoo, we can see how small this company really is, with an outstanding 7.88 million shares! Currently there are 323,940 shares out short (10/11/05), representing 5.50% of the float or 3 trading days of volume (the short ratio). This is at my own personal limit of significance for short sales, and thus doesn't look too elevated to me.
The company does not pay a dividend and the last stock split was a 3:2 split 1/21/03.
What about a chart? Reviewing the
"Point & Figure" chart from Stockcharts.com:
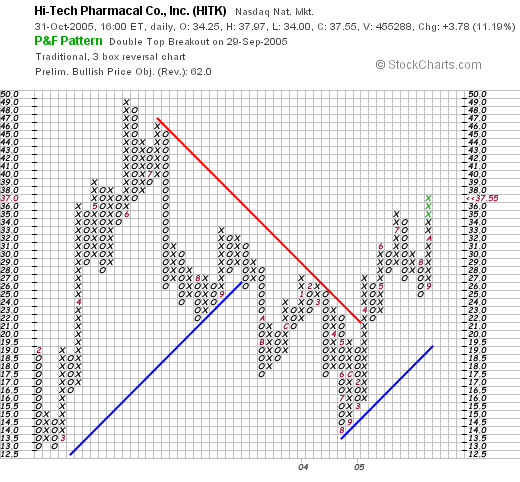
 We can see that the stock was trading higher from February, 2003, through July, 2003, when the price broke down and the stock declined steadily to a low of $14.00 in August, 2004. The stock then moved higher, breaking resistance at $21 in March, 2005, and has been trading higher since. The stock looks strong and not over-valued. At least in the short-term, the stock looks strong.
So what do I think? The last quarter was exceptionally strong, the Morningstar report was excellent with steady five year revenue and earnings growth. The company is spinning off free cash flow that is growing and the balance sheet is fabulous. Valuation-wise, the P/E seems a bit rich, but then again with the huge growth reported in the very latest quarter, this doesn't see very out of line to me. The company is so small, that the required estimates for Yahoo to provide a PEG apparently are not available.
The Price/Sales ratio is relatively reasonable with the generic drug group. Finally, the chart looks strong but certainly not way over-extended. The stock just recently broke through resistance and is now moving higher.
 An added plus is the very small size of this company which barely qualifies as a small cap stock instead of a micro cap stock. The potential really does seem to be "sky's the limit" for this stock!
Thanks so much for stopping by and visiting! If you have any questions or comments, please feel free to email me at bobsadviceforstocks@lycos.com or leave your words right here on the blog! I hope everyone had a Happy Halloween and avoids eating too much of that candy your kids are bringing in!
Bob
Newer | Latest | Older


