Stock Picks Bob's Advice
Sunday, 5 March 2006
"Looking Back One Year" A review of stock picks from the week of December 13, 2004.

Hello Friends! Thanks so much for stopping by and visiting my blog,
Stock Picks Bob's Advice. As always please remember that I am an amateur investor, so please remember to consul with your professional investment advisors prior to making any investment decisions based on information on this website.
As my regular readers realize, there are several different things going on simultaneously on this website! First of all, I like to discuss stocks that fit my criteria for investment. A year or so later, I like to go back and examine these "picks" to see how they turned out. This analysis assumes a buy and hold strategy which is
not what I actually employ in my investments. Instead, I like to sell my losing stocks completely and quickly at an 8% loss, and also sell my appreciating stocks (see the previous entry on Coach) slowly and partially. But for the sake of analysis, I like to assume a 'buy and hold' strategy for my stock picks. I believe it stil l gives us a feel for how the stock selections were doing, even though the actual performance in my hands might be substantially better (or worse).
Also on this blog, I like to discuss my actual holdings in my "trading portfolio". Those stocks are the ones that I actually purchase and have real stock trading losses and gains. Whenever I make a trade in my actual trading account, I try to post a note as soon as possible under the title "Trading Portfolio Transparency".

Anyhow, a little over a year ago, on December 19, 2004, I
'wrote up' C R Bard (BCR) on Stock Picks Bob's Advice when it was trading at $63.90. BCR closed on March 3, 2006, at $69.67 for a gain of $5.77 or 9% since posting.

On January 25, 2006, C R Bard (BCR)
reported 4th quarter 2005 results. Net sales grew 7% to $452 million from $424.1 million the prior year same period. Net in come came in at $80.1 million, with diluted earnings per share reported at $.75/share, both up 15% from the same period the prior year, when Bard reported $69.8 million or $.67/diluted share. While a strong result, analysts were
expecting 4th quarter results of $462.1 million in revenue with earnings of $.76/share. Thus, while growing, the company missed on analysts' expectations, keeping the subsequent stock price performance 'subdued'.
So how did we do that week? Well, the only stock was C R Bard (which I wrote up on a Sunday!), and that stock appreciated 9% since posting.
Thanks so much for stopping by! If you have any questions or comments, please feel free to leave them on the blog or email me at bobsadviceforstocks@lycos.com.
Bob
Saturday, 4 March 2006
Coach (COH) Weekend Trading Portfolio Analysis
Click ***HERE*** for my PODCAST on COACH
Hello Friends! Thanks so much for stopping by and visiting my blog,
Stock Picks Bob's Advice. As always, please remember that I am an amateur investor, so please remember to consult with your professional investment advisors prior to making any investment decisions based on information on this website.

As regular readers of my blog realize, one of the tasks I address on this website is to share with you an actual trading portfolio that I own. These stocks are derived from stocks discussed on this website, and are managed with the same strategy that I advocate elsewhere: selling my losing holdings quickly at an 8% loss limit, and selling my gaining investments slowly and partially as they appreciate. Coach (COH) has been one of the top performing stocks in my portfolio.
I acquired my shares of Coach on 2/25/03 with a cost basis of $8.33/share. I currently own 102 shares which closed 3/3/06 at $36.12/share, giving me a gain of $27.79 or 334% since purchase. I have sold portions of COH seven times since my purchase, at 30, 60, 90, 120, 180, 240, and 300% appreciation levels. My next planned sale would be 1/6th of my remaining shares at a 360% appreciation level or 4.6 x $8.33 = $38.32 or if the stock retraces to 50% of the highet sale point (1/2 of 300% = 150% or 2.50 x $8.33 = $20.83) then I shall be selling all remaining shares to preserve my gains.
Let's take an updated look at this stock which has been a fabulous choice for my portfolio.
First of all, let's review what the company does. According to the
Yahoo "Profile" on Coach, the company
"...engages in the design, production, and marketing of fine accessories worldwide. Its products include handbags; women?s accessories, such as wallets, wristlets, cosmetic cases, key fobs, and belts; and men?s accessories, such as belts, wallets, and other small leather goods; and business cases, such as computer bags and messenger-style bags, as well as men?s and women?s totes; outerwear, gloves, hats, and scarves; and weekend and travel accessories, such as cabin bags, duffels, suitcases, garment bags, and a collection of travel accessories. The company also offers watches, footwear, eyewear and sun glasses, and office furniture under Coach brand name. Its products are sold through direct-to-consumer channels, including company-operated retail and factory stores, online store, and catalogs, as well as through indirect channels, including department store locations in the United States, international department stores, freestanding retail locations, and specialty retailers. As of October 1, 2005, the company operated 199 retail stores and 85 factory stores in North America; and 107 department store shop-in-shops, retail stores, and factory stores in Japan."
And how about the latest quarterly report?
On January 24, 2005, Coach
announced 2nd quarter 2006 results. For the quarter ended December 31, 2005, net sales grew 22% to $650 million up from $532 million the prior year. Including 'option expense', net income grew 37% to $174 million or $.45/diluted share, up from $127 million or $.32/diluted share the prior year. These results exceeded the company's guidance of $.43/share as well as analysts' expectations of $.44/share. In addition, the company raised guidance on the rest of fiscal 2006 with earnings of at least $1.33, ahead of the analysts' consensus of $1.20. Coach was 'hitting on all cylinders', you could say, beating consensus with strong earnings and revenue growth as well as raising guidance for the rest of the year. These are the kind of things in an earnings report that drive a stock higher from my perspective.
And how about the Morningstar results?
Reviewing the
Morningstar.com "5-Yr Resatated" financials on Coach, we can see the steady growth in revenue from $600 million in 2001 to $1.7 billion in 2005 and $1.9 billion in the trailing twelve months (TTM).
Earnings have also been steadily increasing from $.24/share in 2002 to $1.00 in 2005 and $1.21/share in the TTM. The share float has grown slightly from 358 million in 2002 to 377 million in 2005 and 383 million in the TTM.
Free cash flow is solidly positive and growing with $165 million in 2003, increasing to $450 million in 2005 and $506 million in the TTM.
The balance sheet is solid with $746 million in cash, enough to more than enough pay off both the $347.7 million in current liabilities and the $51.5 million in long-term liabilities. With the other current assets of $435 million, we can calculate (comparing total current assets to current liabilities) a current ratio of over 3.
What about some valuation numbers on this stock?
Looking at
Yahoo "Key Statistics" on Coach, we find that this is a large cap stock with a market capitalization of $13.85 billion. The trailing p/e is a bit rich at 30.07, but the forward p/e (fye 02-Jul-07) is a bit nicer at 24.41. Thus, with the solid earnings growth expected, the PEG works out to 1.32. (PEG's 1.5 or less are reasonable imho, and 'cheap' if they come in under 1.0).
We can see how expensive this stock really is if we examine the Price/Sales ratio relative to stocks in the same industrial group: "Textile-Apparel Footwear/Accessories", according to the
Fidelity.com eResearch website.
Coach (COH) tops this list with a Price/Sales ratio of 7.3. This is followed
way back with Nike (NKE) with a ratio of 1.6, then Timberland (TBL) at 1.5, Wolverine World Wide (WWW)at 1.2 and Rocky Shoes and Boots (RCKY) with a Price/Sales ratio of 0.6. So certainly from this particular criterion, this stock is not any kind of bargain!
Going back to Yahoo for a few more valuation numbers, we find that there are 383.36 million shares outstanding with 376.84 million of them that float. Of these, 7.18 million are out short representing 1.90% of the float or a current ratio of 2.6. Since I use 3.0 as a cut off on this particular statistic, I do not find the level of short interest very significant.
No cash dividends are paid and the last stock split was a 2:1 split 4/5/05.
What about the chart? If we look at a
"Point & Figure" chart on Coach from StockCharts.com:
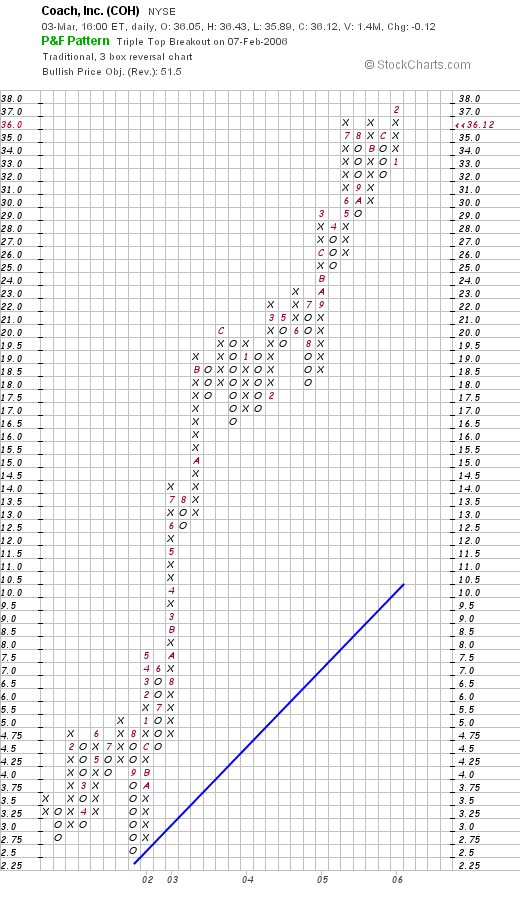
We can see that the chart is an absolutely gorgeous graph, which, except for a dip down to $2.50 in September, 2001, the company has bee charging higher with unbelievable strength for the past 4 1/2 years! The stock, if anything, is over-extended, with the price far ahead of its "blue line" of support.
So in summary, this stock has been very kind to me. It has appreciated steadily and I am actually waiting for a 360% appreciation move to sell another 1/6th of my holding. Beyond this, the latest quarterly report was strong with the company beating expectations, as well as raising guidance. The past five years on Morningstar are without a blemish, with revenue, earnings, free cash flow, and the balance sheet looking fabulous. The p/e and PEG aren't too rich but the Price/Sales ratio is definitely higher than any other stock in its group. Finally, the chart looks quite strong, if a bit over-extended.
Thanks so much for stopping by and visiting! I hope that next week finds you in good health and that all of our investments are moving in the right direction. If you have any comments or questions, please feel free to leave them on the blog or email me at bobsadviceforstocks@lycos.com.
Bob
Posted by bobsadviceforstocks at 3:32 PM CST
|
Post Comment |
Permalink
Updated: Sunday, 5 March 2006 6:13 PM CST
Thursday, 2 March 2006
"Trading Transparency" Angiodynamics (ANGO)
Hello Friends! Thanks so much for stopping by and visiting my blog,
Stock Picks Bob's Advice. As always, please remember that I am an amateur investor, so please remember to consult with your professional investment advisors prior to making any investment decisions based on information on this website.
A few moments ago I sold my 240 shares of Angiodynamics (ANGO) at $23.51. I had purchased these shares 1/6/06 at a cost basis of $26.26. Thus, I had a loss of $(2.75) or (11.7)%. This exceeded my sale point of an 8% loss, and thus I sold my position today.
On any sale at a loss, I refrain from re-investing proceeds and shall be "sitting on my hands" until such time as I sell a portion of a position at one of my targeted gains.
Thanks so much for visiting. If you have any comments or questions, please feel free to email me at bobsadviceforstocks@lycos.com or leave them on the blog.
Bob
Wednesday, 1 March 2006
March 1, 2006 Autodesk (ADSK)
Click
***HERE***for my PODCAST on AUTODESKHello Friends! Thanks so much for stopping by and visiting my blog,
Stock Picks Bob's Advice. As always, please remember that I am an amateur investor, so please remember to consult with your professional investment advisors prior to making any investment decisions based on information on this website.

I was looking through the
list of top % gainers on the NASDAQ this afternoon and came across Autodesk (ADSK) which closed at $41.68, up $4.03 or 10.70% on the day. I do not own any shares of this stock nor do I own any options. This evening, I did happen to listen to the first part of
Jim Cramer's Mad Money, and did hear a listener call in about Audodesk and hear Cramer give it a big plug. This doesn't really determine or affect my choice on the blog, but it is a plus as well.
And what exactly does this company do? According to the
Yahoo "Profile" on Autodesk, the company
"...operates as a software and digital content company worldwide. The company provides business solutions through technology products and services, including integrated and interoperable design software, Internet services, wireless development platforms, and point-of-location applications."
And how about the latest quarterly result?
Yesterday, after the close of trading, Autodesk
reported 4th quarter 2006 results. For the quarter ended January 31, 2006, revenues climbed 17% to $417 million, from $356 million in the same quarter the prior year. Net income for the quarter was $83 million or $.33/diluted share compared to $66 million or $.26/diluted share the prior year. In addition, the company raised guidance (the third part of what I like to figuratively refer to as a 'trifecta') for 2007. As
reported last night" Chief executive and chairwoman Carol Bartz said demand was strong for its products to design in two dimensions while an increasing number of customers were migrating to new three-dimensional products.
"I think we (will) have a big run on both sides for a long time," Bartz said. "Considering the fact that ultimately the majority of our base should move to 3D, and we are only 10 percent there, that is a huge opportunity."
Bartz said Autodesk raised its fiscal 2007 forecast from its November target due to a dollar that has stabilized, an economy that seems stronger and momentum from a strong fourth quarter."
And how about a longer-term look at the company from Morningstar?
Reviewing the
"5-Yr Restated" financials on ADSK from Morningstar.com, we can see that between 2001 and 2003, the company actually had flat to declining revenue from $.9 billion in 2001 to $.8 billion in 2003. However, since 2003, revenues have grown strongly to $1.2 billion in 2005 and $1.5 billion in the trailing twelve months (TTM).
Earnings have followed a fairly similar course, declining from $.40/share in 2001 to a low of $.14/share in 2003, then climbing sharply to $.90/share in 2005 and $1.26/share in the TTM. The company also pays a small dividend of $.06/share, although Morningstar reports only $.03/share in the TTM.
Free cash flow has been positive and growing strongly from $50 million in 2003 to $332 million in 2005 and $418 million in the TTM.
The balance sheet as reported on Morningstar looks solid with $547.9 million in cash alone, enough to cover both the $463.4 million in current liabilities and the $50.1 million in long-term liabilities combined. As far as the 'current ratio' is concerned, Morningstar reports an additional $311.8 million in other current assets, which when combined with the cash of $547.9 million and compared to the current liabilities of gives us a current ratio of just under 2.0 another sign of financial strength.
Taking a look at the
Yahoo "Key Statistics" on ADSK, we can see that this company is certainly a large cap stock with a market capitalization of $9.62 billion. (The cut-off for mid-cap stocks for me is $3 billion). The trailing p/e is 33.26, with a forward p/e (fye 31-Jan-07) of 24.37. The PEG Ratio (5 yr expected) is a reasonable 1.22. (I use anything under 1.5 as fairly valued and frankly any PEG under 1.0 as 'cheap').
According to the
Fidelity.com eResearch website, ADSK is in the "Technical/System Software" industrial group. Within this group of stocks, ADSK is relatively expensive with a Price/Sales ratio of 6.4. This ratio is only exceeded by Infosys (INFY) at 9.8, and is ahead of Mercury Interactive (MERQ) at 3.8, Manhattan Associates (MANH) at 2.6, and Take-Two Interactive (TTWO) which is the cheapest in the group with a Price/Sales ratio of 0.9.
Going back to Yahoo for a few more numbers, we find that there are 230.8 million shares outstanding with 229.55 million that float. Of these, 6.72 million shares were out short as of 1/10/06. This represents 2.90% of the float, slightly higher than the previous month's 6.71 million shares, and yet the short ratio is only 2.8, under the 3.0 figure I use as a cut-off for significance.
As noted above, the company pays a small dividend of $.06/share yielding 0.20%. The last stock split was a 2:1 split 12/21/04.
And what about a chart? Looking at a
"Point & Figure" chart from StockCharts.com on ADSK:
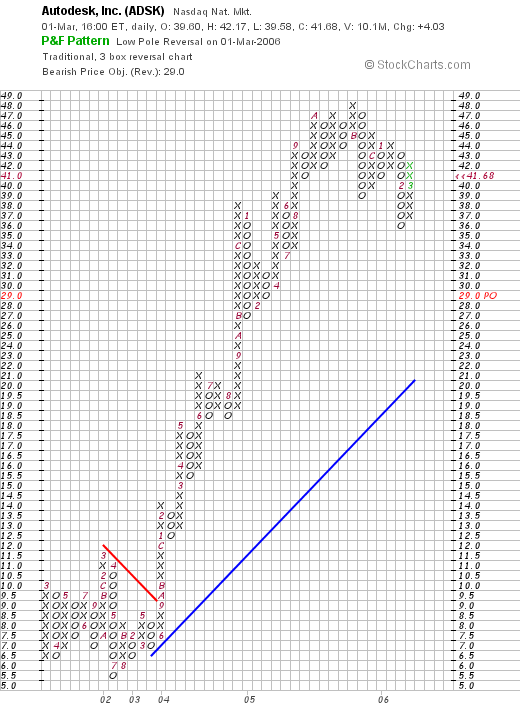
We can see that the stock chart follows the Morningstar.com long-term results report almost perfectly. While revenue and earnings have been flat between 2001 and 2003, so is the chart. Only in September, 2003, the stock broke through resistance at $9.50 and has been climbing strongly since. Recently, the stock has pulled back slightly from the $48 level to the current $42 level. Overall, the chart looks fine to me.
So what do I think? Well, the stock has many of the characteristics I like to see in a stock pick. The latest quarter was solid with strong earnings and revenue growth and raised guidance, the past five-years, while not perfect, have shown steady results the past three years. The company even pays a small dividend. Free cash flow is positive and rapidly growing. The balance sheet is solid with enough cash to pay off both the current and long-term liabilities combined. Value-wise, the P/E is moderate in the low 30's, forward P/E in the 20's with a PEG under 1.5. The Price/Sales ratio is a bit rich, but this stock may well deserve the valuation. Finally, the chart looks nice to me.
Anyhow, thanks so much for once again taking the time to visit my blog. If you have any questions or comments, please feel free to leave them on the blog or email me at bobsadviceforstocks@lycos.com.
Bob
Posted by bobsadviceforstocks at 7:28 PM CST
|
Post Comment |
Permalink
Updated: Wednesday, 1 March 2006 10:43 PM CST
Tuesday, 28 February 2006
February 28, 2006 CAS Medical (CASM)
Hello Friends! Thanks so much for stopping by and visiting my blog,
Stock Picks Bob's Advice. As always, please remember that I am an amateur investor, so please remember to consult with your professional investment advisors prior to making any investment decisions based on information on this website.

I was looking through the
list of top % gainers on the NASDAQ today and came across CAS Medical (CASM) which, as I write, is trading at $12.60, up $1.02 or 8.81% on the day, in an otherwise weak market. I do not own any shares of CASM nor do I have any options.
So what does CAS Medical do anyway?
According to the
Yahoo "Profile" on CASM, the company
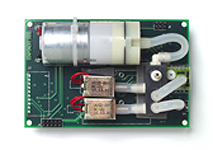
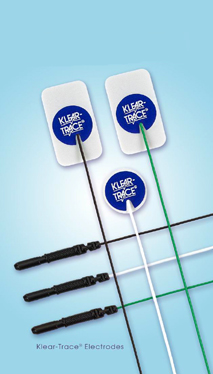
"...engages in the development, manufacture, and distribution of diagnostic equipment and medical products for use in the healthcare and medical industry. The company principally offers blood pressure measurement technology MAXNIBP, vital signs measurement equipment, cardio-respiratory monitoring equipment, and supplies for neonatal intensive care. It also develops, assembles, and sells blood pressure cuffs, liquid infusion devices, and blood transfusion filters."
And how about the latest quarterly result?
This was a little harder to find, but as often is the case is readily available on the
CAS Medical website in the 2005 Archives.
On October 27, 2005, CASM reported their 3rd quarter 2005 results. Revenues for the quarter ended September 30, 2005, came in at $7.48 million, a 48% increase over the $5.04 million reported in the same quarter the previous year. (The company noted that these results included the recent acquisition of Stacorp, Inc.) Net income for the quarter increased to $433,000 or $.04/diluted share, up from $384,000 or $.03/diluted share in the same quarter last year. In the same announcement, the company guided 2005 earnings higher to $.12-$.14/share.
And how about longer-term results?
Reviewing the
Morningstar.com "5-Yr Restated" financials, we can see that revenue has grown steadily from $12.1 million in 2000 to $19.9 million in 2004 and $23.8 million in the trailing twelve months (TTM).
Earnings, however, have been quite erratic (which is a common observation in these tiny companies) dropping from $.06/share in 2000 to a loss of $(.03)/share in 2002, and increasing subsequently to $.05 in 2003, $.11 in 2004 and $.13/share in the TTM.
Free cash flow has been either nil or positive with $0 in 2002 increasing to $2 million in 2004, and back to $0 in the TTM.
The balance sheet, as presented on Morningstar.com, looks solid with $1.1 million in cash and $10.4 million in other current assets balanced against $4.3 million in current liabilities, resulting in a "current ratio" of almost 3. The combined current assets are more than enough to pay off both the $4.3 million in current liabilities and the $5.3 million in long-term liabilities combined.
And what about valuation numbers?
Looking at
Yahoo "Key Statistics" on CAS Medical, we can see that this is a very small company with a market capitalization of only $126.29 million. The trailing p/e is quite rich at 96.92. There is no forward p/e reported on Yahoo (probably due to the lack of analysts making estimates on future earnings.)
CAS Mecical is in the "Medical Instruments/Supplies" industrial group of stocks according to the
Fidelity.com eResearch website. Within this group, CASM is moderately priced with a Price/Sales ratio of 5.7. Leading off this group is Alcon (ACL) with a Price/Sales ratio of 8.3, followed by Guidant (GDT) at 7.2, then CAS Medical (CASM) at 5.7, Stryker (SYK) at 4.1, Boston Scientific (BSX) at 3.2 and Baxter (BAX) at 2.4.
Going back to Yahoo for some more numbers, we find that CASM has only 10.02 million shares outstanding with 6.33 million of them that float. As of 1/10/06 there were only 33,500 shares out short representing 0.4 trading days of volume (the short ratio). This short interest is only 0.50% of the float so all-in-all the short shares are not much of a factor with this stock as far as I can tell.
Yahoo did not report any dividends nor any stock splits.
What about a chart? Looking at a
"Point & Figure" chart from StockCharts.com on CASM:
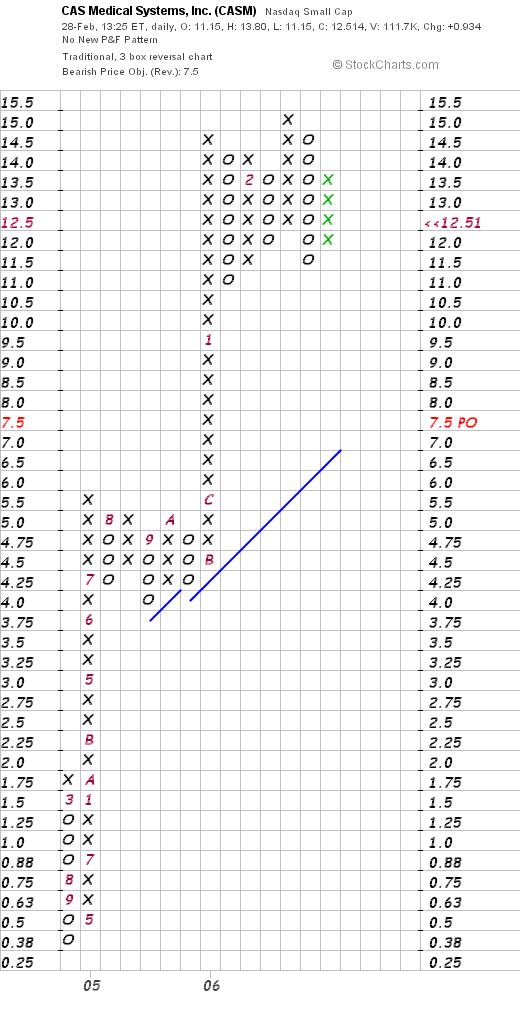
We can see that this chart is extremely strong with a stock climbing sharply from $.38/share in September, 2004, to the current $12.51 level today. This has been a meteoric rise for this stock which if anything, might be a tad over-extended after climbing so far so fast!
So what do I think? Well, I like this stock. The latest quarter was strong, the Morningstar.com evaluation looks good, and I like the raised guidance. Valuation-wise, the p/e is certainly rich, but the company is just starting to have positive earnings and that is a bit hard to tell. The Price/Sales is also a bit rich but not bad relative to other stocks in its group. Finally the chart is very strong. However, whenever I find myself dealing with very small companies, I often find the volatility a bit threatening, so be prepared to buckle your seat belts and hang on :).
Thanks again for stopping by and visiting! Remember to always check with professionals prior to following any of my "advice". That would make me happy :). If you have any comments or questions, please feel free to leave them on the blog or email me at bobsadviceforstocks@lycos.com.
Bob
Sunday, 26 February 2006
"Looking Back One Year" A review of stock picks from the week of December 6, 2004
Hello Friends! Thanks so much for stopping by and visiting my blog,
Stock Picks Bob's Advice. As always, please remember that I am an amateur investor, so please remember to consult with your professional investment advisors prior to making any investment decisions based on information on this website.
As my regular readers know, I like to pick stocks for possible investment on this blog, using my own perspective and analysis that I document on each of my posts. However, to determine if what I am writing about is actually a successful approach for picking stocks requires a retrospective analysis. Each weekend, I try to look at all of the stock selections from a week about a year earlier. Since I have missed a few of these discussions :(, I am now about 60 weeks out on my reviews. These reviews assume a buy and hold approach to investments. In practice, I do not follow this strategy and do not recommend it; in fact I sell my losing stocks quickly and completely, and my gaining stocks slowly and partially. However, for the sake of simplicity, this approach is useful to at least see what has happened to the stocks discussed on this blog!

On December 8, 2004, I
posted Cogent Systems (COGT) on Stock Picks Bob's Advice when it was trading at $35.03. COGT closed at $22.88 on February 24, 2006, for a loss of $(12.15) or (34.7)%.

On October 26, 2005, Cogent
reported 3rd quarter 2005 results. Revenue grew 64% to $38.4 million, from $23.4 million in the same quarter a year ago. GAAP Net income was $20.1 million or $.21/diluted share down from $20.4 million or $.29/diluted share the prior year. The company explained that the higher figures a year ago were related to a net tax benefit of $11.6 million; however, for this blog, I stick with GAAP (generally accepted accounting principles) numbers.

On December 6, 2004, I
discussed DaVita (DVA) on Stock Picks Bob's Advice (and also purchased some shares which were later sold in my Trading Account) at $36.42. Davita closed at $59.12 on February 24, 2006, giving this pick a gain of $22.70 or 62.3%.
On February 15, 2006, Davita (DVA)
announced 4th quarter 2005 results. Revenue was up almost 100% to $1.13 billion from $583.9 million a year earlier in the same quarter. Earnings increased 13% to $64 million or $.61/share, up from $56.6 million or $.56/share last year. In addition, hitting my so-called "trifecta", the company raised guidance for 2006 calling for income of $630 million to $700 million, up from $600 to $670 million previously estimated.
So how did I do with these two stocks from a week a bit more than a year ago? I had one loser, Cogent, with a loss of (34.7)% and one gainer, DaVita, with a gain of 62.3%. Averaging these two stocks gives me an average gain of 13.8%.
Thanks again for stopping by! If you have any comments or questions, please feel free to leave them on the blog or email me at bobsadviceforstocks@lycos.com.
Bob
Cal Dive (CDIS) Weekend Trading Portfolio Review

Hello Friends! Thanks so much for stopping by and visiting my blog,
Stock Picks Bob's Advice. As always, please remember that I am an amateur investor so please consult with your professional investment advisors prior to making any investment decisions based on information on this website.

As I like to point out on many of my entries on this blog, I am trying to do several things simultaneously on this website. First of all, I like to discuss stocks that I am interested in; stocks that meet my criteria for investment. In addition, I write about my actual trades and my actual trading portfolio. I do this for transparency, to let you know what I actually own and what I am doing with my holdings. I share with you my accomplishments and my failures.
Finally, on weekends, when I get around to it :), I like to review my trading portfolio, going alphabetically through my positions so that I may actually review these currently 22 holdings approximately twice a year. Also, on weekends, I try to review my stock picks from the prior year on a trailing 52 week (now up to about 60) basis. This particular post is about one of my actual holdings, Cal Dive (CDIS) which is currently in my trading portfolio.

On November 3, 2004, I came across Cal Dive (CDIS) on the list of top % gainers. Having just sold some shares at a gain, I had a permission slip to buy a new position and went ahead and purchased 200 shares at $38.16 and immediately
posted my trade on Stock Picks Bob's Advice. Later that day I did a more complete
review of Cal Dive on Stock Picks Bob's Advice.
I currently own 142 shares of CDIS with a cost basis of $19.10. The stock had a 2:1 split on 12/9/05. CDIS closed at $36.75 on 2/24/06, giving me a gain of $17.65 or 92.4% on my remaining shares since my purchase a little over a year ago. I have now portions of CDIS four times, selling 50 shares on 2/25/05 at a price of $49.87, for a gain of $11.67 (pre-split) or 30.5%. My second sale was for 37 shares on 8/1/05 at a price of $60.84 for a gain of $22.64 or 59.3%. My third sale was for 28 shares on 11/22/05 at a price of $73.01, for a gain of $34.81 or 91.1%. Finally, I sold 28 shares
after the stock split at a price of $41.82 for a gain of $22.72 or 119% on a post-split basis.
Since I have sold portions of my holdings four times, my next stock split would be at a 180% gain on the upside or 2.80 x $19.10 = $53.48 or on the downside, I would sell all remaining shares if the stock traces back to 50% of its highest sale point (120% x .5 = 60%), or 1.60 x $19.10 = $30.56.
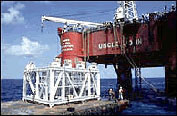
Let's take a closer look at Cal Dive (CDIS). First of all, according to the
Yahoo "Profile" on Cal Dive, the company
"...operates as an energy services company in the Gulf of Mexico, and in the North Sea and the Asia/Pacific regions. It offers a range of marine contracting services, such as marine construction, robotic services, manned diving, and decommissioning services. CDI, with its fleet of 22 vessels and 26 remotely operated vehicles and trencher systems, performs various services that support drilling, well completion, intervention, construction, and decommissioning projects. It also acquires and operates mature and noncore offshore oil and gas properties, as well as related production facilities."
What about the latest quarterly report? Actually, the company is
scheduled to report earnings this Wednesday, March 1, 2006. But let's take a look at the previous quarter for some idea about how the company is doing.
On November 1, 2005, Cal Dive
reported 3rd quarter 2005 results. Revenue was up dramatically to $209 million, from $132 million in the same quarter the previous year. Earnings climbed 78% to $45.7 million from $22.8 million last year or $1.05/diluted share up from $.59/diluted share. This was a very strong quarter for the company. Recently, the stock pulled back in price after the company
the acquisition of Remington Oil and Gas for $1.4 billion. (listed on "investor news" on the company website.

And how about longer-term results? Reviewing the
"5-Yr Restated" financials on CDIS from Morningstar.com, we can first of all see the beautiful progression in revenue growth from $181 million in 2000 to $543.4 million in 2004 and $698.4 million in the trailing twelve months (TTM).
Earnings have grown nicely, if not as consistently, from 4.36/share in 2000, to $1.03 in 2004 and $1.50 in the TTM. The company has expanded its shares slightly from 63 million in 2000 to 76 million in 2004 and 78 million in the TTM.
Free cash flow has been erratic with $(95) million in 2002 improving to $177 million by 2004. With the apparent $343 million acquisition of Remington, this resulted in a drop to $(63) million in free cash flow in the TTM.
The balance sheet is adequate with $150.5 million in cash and $218.2 million in other current assets, enough to cover the $198.0 million in current liabilities more than 1.5x over. (Giving us a 'current ratio' of over 1.5). The company does have a significant long-term liabilities load of $798.4 million. This does not appear to be a problem for this rapidly growing company.
And how about some valuation numbers on this stock?
Reviewing
Yahoo "Key Statistics" on Cal Dive, we can see first that this is still a 'mid-cap' stock with a market capitalization of $2.86 billion (using a $3 billion cut-off for large cap status). The trailing p/e is a reasonable 24.40 and the forward p/e (fye 31-Dec-06) is downright cheap at 12.42. Thus, the (5 yr expected) PEG is only 0.59. Generally stocks with PEG's of 1.5 or less are reasonably priced.
According to the
Fidelity.com "eResearch" website, CDIS is in the "Oil & Gas Equipment/Services" industrial group.
On a relative Price/Sales ratio comparison, Cal Dive is relatively richly valued with a Price/Sales ratio of 4.3. This is topped only by Schlumberger (SLB) at 5.1, and followed by Baker Hughes (BHI) at 3.5, BJ Services (BJS) at 3.2, Pride International (PDE) at 2.9 and Halliburton (HAL) at 1.8.
Going back to Yahoo for a few more numbers, we can see that there are 77.85 million shares outstanding and 72.30 million of them that float. Of those shares that float, 5.41 million of them are out short representing 7.20% of the float or 4.4 trading days of volume (the short ratio). Using my 3 day arbitrary cut-off, this is a bit of a large short interest and may be a bullish influence in the face of good news, especially if the earnings coming out on Wednesday are reasonably upbeat.
There is no cash dividend, and as I noted above, the company last split its stock in the form of a 2:1 split on 12/9/05.
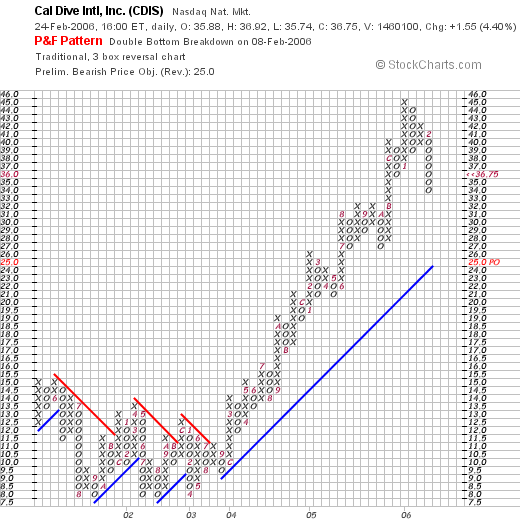
What about a chart? Looking at a
"Point & Figure" chart on CDIS from StockCharts.com, we can see that the stock was trading sideways from May, 2001, when it was at $15, until October, 2004, when it broke through resistance at around $11.50, and has climbed steadily and strongly since. Recently the stock has pulled back from heights around $45 to the current $36.75 level. The stock rise appears intact, with the support level below the current stock price.
So what do I think? Well this stock has been a great performer for me with four partial sales already at the 30, 60, 90 and 120% gain levels. The stock has pulled back to a 90% appreciation point, but I do not think the stock rise is over yet. However, much of the price movement on this stock will be in association with the oil price, making it subject to all sorts of geopolitical events.
Underlying numbers on this stock are solid with steadily appreciating revenue and earnings, free cash flow, which except for the recent acquisition, has been positive and growing. The p/e is reasonable and the PEG is under 1.0. Price/Sales-wise the stock is richly valued, but not the highest or even second-highest within its group. The chart looks nice. Overall, if the company can come in with a reasonable earnings report this Wednesday, I wouldn't be surprised to see this stock moving higher once again. On the other hand, a disappointment, could easily drop this stock to my next sale point on the downside, about $36 and if so, I shall be unloading all of my shares. We will know more later this week!
Thanks so much for stopping by and visiting! If you have any comments or questions, please feel free to leave them on the blog or email me at bobsadviceforstocks@lycos.com.
Bob
Saturday, 25 February 2006
February 25, 2006 NATCO Group (NTG)
Click ***HERE*** for my PODCAST on NTGHello Friends! Thanks so much for stopping by and visiting my blog,
Stock Picks Bob's Advice. As always, please remember that I am an amateur investor, so please remember to consult with your professional investment advisors prior to making any investment decisions based on information on this website.

I was looking through the
list of top % gainers on the NYSE yesterday and came across NATCO Group (NTG). Like so many things in my life, I never got around to writing it up yesterday, and fortunately the list of gainers is still up on Saturday, so I have another opportunity to write a few words about this stock. I do not own any shares of nor do I have any options in this company. NTG had a great day yesterday closing at $24.61, up $2.05 or 9.09% on the day.
Let's take a closer look at this stock and I will explain why I think it deserves a place on this blog!
According to the
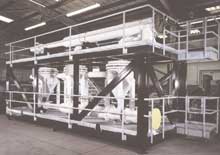
Yahoo "Profile" on NATCO Group, the company
"...provides wellhead equipment, systems, and services used in the production of oil and gas. It offers a range of production equipment, including separators that separates hydrocarbon stream into oil, water, and gas; heaters, which prevent hydrates from forming in gas streams and reduce the viscosity of oil; oil dehydration equipment that removes water from oil; gas conditioning equipment, which removes contaminants from hydrocarbon and gas streams; and gas processing equipment for the extraction of liquid hydrocarbons to meet feed gas and liquid product requirements."
And what about the latest quarterly earnings report?
On February 22, 2006,
NATCO announced 4th quarter 2005 earnings results. For the quarter ended December 31, 2005, revenue came in at $114.8 million, up 25% from the fourth quarter 2004 results of $91.8 million. Net income for the quarter came in at $6 million or $.33/diluted share, up from a loss of $(391,000), or $(.02)/diluted share.
How about longer-term results?
Looking at the
Morningstar.com "5-Yr Restated" financials, we can see that revenue growth, which grew from $224.6 million in 2000, reached $289.5 million in 2002. From 2002 to 2001, revenue dropped slightly to $201.5 million, but since then has steadily grown again reaching $321.5 million in 2004 and $377.5 million in the trailing twelve months (TTM).
Earnings have been erratic, dropping from $.34/share in 2001 to a loss of $(.06)/share in 2004, and then bouncing back strongly to $.38/share in the TTM.
Free cash flow, which dropped from $5 million in 2002 a negative $(1) million in 2004, has also rebounded nicely to $9 million in the TTM.
The balance sheet, per Morningstar, is solid with $7.4 million in cash and $136.7 million in other current assets. Compared to a current liabilities level of $95.1 million, this gives us a current ratio of approximately 1.5. In addition, the current assets are enough to essentially cover the combined current liabilities and the $52.5 million in long-term liabilities.

How about some valuation numbers?
Reviewing
Yahoo "Key Statistics" on NATCO Group, shows that this company is a small cap stock with a market capitalization of $415.66 million. The trailing p/e, while steep at 63.26, is expected to drop quickly to 12.82 (forward p/e estimated as of fye 31-Dec-06). Thus, the PEG ratio (5 yr expected) is quite low at 0.32.
According to the
Fidelity.com eResearch website, NTG belongs in the "Oil & Gas Equipment/Services" industrial group. Within this group, the Price/Sales for this company puts it at the bottom of the list in terms of richness of valuation making this a good value as measured by this parameter.
Topping off this group is Schlumberger (SLB) with a Price/Sales ratio of 5.1, followed by Baker Hughers (BHI) at 3.5, BJ Services (BJS) at 3.2, Pride International (PDE) at 2.9, and Halliburton (HAL) at 1.8. At the very bottom is NATCO (NTG) with a Price/Sales ratio of only 1.1.
Going back to Yahoo for some more numbers on this company, we see that there are 16.89 million shares outstanding and 11.07 million that float. Of these, 60,250 shares are out short, representing 1% of the float or only 0.5 trading days of volume. There aren't a lot of short-sellers 'voting' against this stock!
The company does not pay a dividend per Yahoo, and has not split its stock any time recently.
And what about a chart?
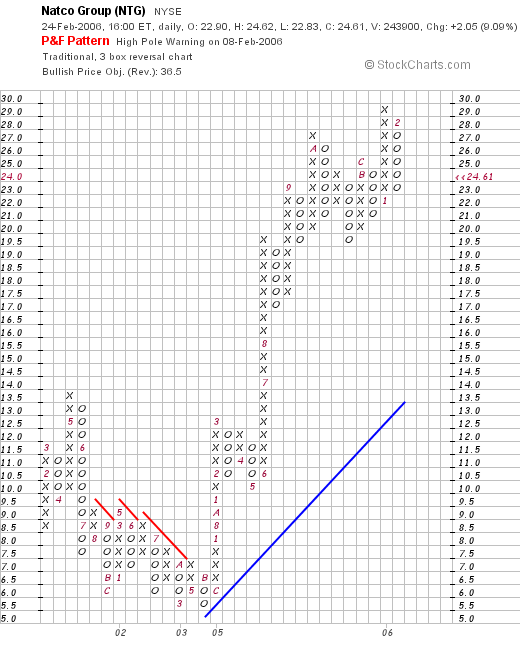
If we take a look at a
"Point & Figure" chart on NATCO Group from StockCharts.com, we can see that this stock was trading lower from $13.50 in May, 2001, to a low of $5.50 in November, 2004. In January, 2005, the stock broke out higher and hasn't 'looked back' since.
So what do I think? Well, this certainly is an interesting stock that came in with a great earnings report last week, continuing its turn-around from losses to gains on strong revenue growth. The company is riding the oil business recovery, and has an excellent record of revenue growth, a recent rebound in earnings and free cash flow. Valuation that is downright cheap with a reasonable Price/Sales ratio, a PEG under 1.0 and a forward P/E less than 15. On top of this, the chart also looks strong.
Now, if only I were able to be buying some shares, but I shall be waiting for a signal to make a purchase....with a stock of my own selling at a gain.
Thanks so much for stopping by! If you have any comments or questions, please feel free to leave them on the blog, or email me at bobsadviceforstocks@lycos.com.
Bob
Posted by bobsadviceforstocks at 10:54 PM CST
|
Post Comment |
Permalink
Updated: Sunday, 26 February 2006 12:31 AM CST
Thursday, 23 February 2006
February 23, 2006 C R Bard (BCR) Revisiting a Stock Pick
Hello Friends! Thanks so much for stopping by and visiting my blog,
Stock Picks Bob's Advice. As always, please remember that I am an amateur investor, so please remember to consult with your professional investment advisors prior to making any investment decisions.

It is a bit late here and I wanted to try to get a post in before crashing for the evening. I went to the local college production of Evita tonight; that was a great musical! If you haven't gotten around to seeing that Andrew Lloyd Weber show, take it in if you get a chance wherever you may happen to be living.
Let me try to get right to the point this evening and share with you an old favorite of mine that showed up on the
list of top % gainers on the NYSE today, C R Bard, Inc. (BCR) which closed at $66.74, up $2.88 or 4.51% on the day. I do not own any shares nor do I have any options on this stock.
I say it is an "old favorite" because I have posted this stock previously on this blog. In fact, I
posted BCR on Stock Picks Bob's Advice on December 19, 2004, when it was trading at $63.90/share. You can see that this stock has really gone almost nowhere since posting a bit over a year ago. Currently the stock is ahead of the post by $2.80 or 4.4% since posting (less than the % gain today alone!).
Well then, why do I still like the stock?
First of all, let's review what they do--according to the
Yahoo "Profile" on C R Bard, the company
"...engages in the design, manufacture, packaging, distribution, and sale of medical, surgical, diagnostic, and patient care devices. It has four product groups: Vascular, Urology, Oncology, and Surgical Specialties."

And how about the latest quarterly report?
On January 25, 2006, Bard
announced 4th quarter 2005 results. Net sales for the quarter came in at $452.0 million, a 7% increase over the prior-year period. Net income for the quarter was $80.1 million with $.75/diluted share in earnings. This was a 15% increase over the prior-year period.
How about longer-term? Reviewing the
Morningstar.com "5-Yr Restated" financials on BCR, we can see the steady pattern of revenue growth from $1.1 billion in 2000 to $1.66 billion in 2004 and $1.74 billion in the trailing twelve months (TTM).
Earnings have also steadily increased from $1.05 in 2000 to $2.82 in 2004 and $3.02 in the TTM. The company also pays a dividend which has been increasing each year, from $.41/share in 2000 to $.47 in 2004 and $.49 in the TTM.
The company has not been rapidly expanding the number of shares with 101 million in 2000 and 104 million in 2004 and 105 million in the TTM.
Free cash flow has remained strongly positive with $221 million reported in 2002, $203 million in 2004 and $273 million in the TTM.
The balance sheet, as presented by Morningstar.com looks solid to me, with $596 million in cash, enough to pay off both the $338.3 million in current liabilities and the long-term liabilities of $233.4 million combined. With the other current assets of $519.1 million, this gives BCR a 'current ratio' of approximately 3.
How about some valuation numbers?
Looking at
Yahoo "Key Statistics" on C R Bard, we can see that this is a large-cap stock with a market capitalization of $7 billion. The trailing p/e is moderate at 21.38 with a forward p/e (fye 31-Dec-07) even nicer, estimated at 17.80. The estimated growth rate is sufficient to result in a PEG of 1.40 (1.5 or less is considered a good value.)
And the Price/Sales ratio? Within the industrial group of "Medical Instruments/Supplies" according to the
Fidelity.com eResearch website, Bard is moderately priced. Alcon (ACL) is most expensive with a Price/Sales ratio of 8.1, followed by Guidant (GDT) at 6.9, Stryker (SYK) at 4.1, then C R Bard (BCR) at 4. Following Bard is Boston Scientific (BSX) with a Price/Sales ratio of 3.1, and last in the group is Baxter (BAX) with a ratio of 2.4.
Going back to Yahoo for a few more statistics, we find that there are 104.87 million shares outstanding with 104.23 million of them that float. Of these, 1.17 million shares are out short as of 1/10/06. This represents 1.10% of the float or 1.7 trading days of volume. This doesn't look very significant to me.
The company does pay an estimated $.52/share yielding 0.8% on the stock price. The last stock split was a 2:1 split in June, 2004.
And what about the chart?
If we review the
"Point & Figure" chart on BCR from StockCharts.com:
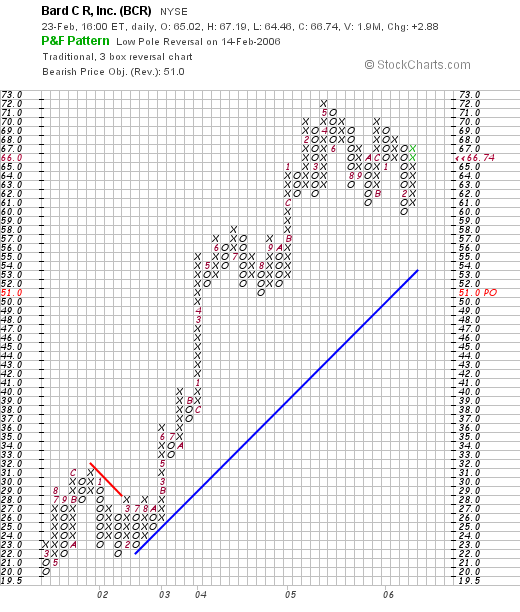
We can see that the stock has moved strongly higher since January, 2002, when it was trading at $22/share. The stock peaked at $72 in May, 2005, and has been moving sideways since. The stock price appears to have consolidated well during much of 2005 and 2006.
So what do I think? I like this stock for its consistent revenue and earnings growth, reasonable valuation, solid free cash flow, a very nice balance sheet, an a chart that looks encouraging.
Anyhow, it is very late and I am fading quickly! So have a great night and a great day tomorrow! Be sure to drop me a line at bobsadviceforstocks@lycos.com if you have any comments or questions and please feel free to leave messages on my blog!
Bob
Wednesday, 22 February 2006
Metrologic (MTLG) "Revisiting a Stock Pick"
Hello Friends! Thanks so much for stopping by and visiting my blog,
Stock Picks Bob's Advice. As always, please remember that I am an amateur investor, so please remember to consult with your professional investment advisors prior to making any investment decisions based on information on this website.

Looking through the
list of top % gainers on the NASDAQ today, I came across Metrologic (MTLG) which had a great day, closing at $23.57, up $3.41 or 16.91% on the day.
Metrologic is an old favorite of mine on this blog, having
written up MTLG on Stock Picks Bob's Advice on July 2, 2003, when it was trading at $35.60. MTLG has split twice since posting, first with a 3:2 split on July 7, 2003, and then a 2:1 split on October 31, 2003. Thus, the effective 'pick price' is actually $35.60 x 2/3 x 1/2 = $11.87/share. Thus, the stock has an actual appreciation of $11.70 or 98.6% since posting!
What drove the stock higher today, was the
announcement of 4th quarter 2005 results after the close of trading yesterday. Sales for the quarter ended December 31, 2005 increased 14.8% to $61.0 million compared with $53.1 million for the same period in the year earlier. Net income for the quarter was $9.0 million, or $.39/fully diluted share, compared with net income of $8.7 million or $.38/diluted share the prior year. Although only a small growth in earnings, the results are still positive with both revenue and earnings growing.
Let's take a closer look at this company. First of all, as to their business, the
Yahoo "Profile" on Metrologic Instruments reports , shows that the company
"...together with its subsidiaries, engages in the design, manufacture, and marketing of bar code scanning and high-speed automated data capture systems using laser, holographic, and vision-based technologies."
And how about longer-term financial results?
Reviewing the
Morningstar.com "5-Yr Restated" financials, we can see that revenue which was $116 million in 2002, has grown each year to $178 million in 2004 and $203 million in the trailing twelve months (TTM).
Earnings, which were erratic early on, with $.16/share in 2000 reported, dropping to a loss of $(.47)/share in 2001, then turned profitable at $.10/share in 2002 and increased steadily to $.99/share in 2004 and $1.08 in the TTM.
Free cash flow has been positive, if inconsistent, with $18 million reported in 2002, dropping to $5 million in 2003, and $23 million in 2004, and $18 million in the TTM.
The balance sheet looks solid with $72.2 million in cash, enough to cover both the $48.5 million in current liabilities and the $7.1 million in long-term debt combined. In addition, the company has another $73.9 million in "other current assets."
How about some valuation numbers on this stock?
Looking at
Yahoo "Key Statistics" on MTLG, we find that this is just barely a mid-cap stock with a market capitalization of $524.39 million. The trailing p/e is reasonable at 21.80, with a forward p/e (fye 31-Dec-06) at 21.23. The PEG is a very nice 1.07.
Fidelity.com puts Metrologic in the "Computer Peripherals" industrial group. Within this group, MTLG has a Price/Sales ratio of 2.2. This is one of the cheapest in this stock group led by Foundry Networks (FDRY) at 5.0, Secure Computing (SCUR) at 4.6, Emulex (ELX) at 3.7, Nice Systems (NICE) at 3.4, Metrologic (MTLG) at 2.2, and Lexmark (LXK) at 1.1.
Looking at other "key statistics", we find that there are 22.25 million shares outstanding, but only 12.12 million that float. 523,700 shares are out short as of 1/10/06, representing 3.80% of the float or 3.6 trading days of volume.
As noted above, the last stock split was a 2:1 split on 10/31/03. No cash dividends are reported by Yahoo.
And how about a chart?
Looking at the
"Point & Figure" chart from StockCharts.com:
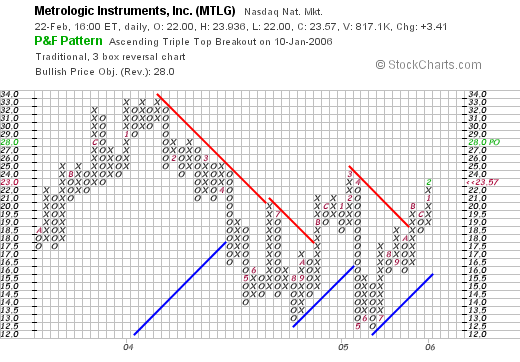
we can see that for the period documented, this stock which was initially doing well climbing to a peak of $33, then proceeded to break down in price bottoming at $12.50/share in June, 2005. The stock has subsequently been acting better, breaking through resistance in October, 2005 at $18.50, and has climbed now to $23.57 range.
So what do I think? Well the stock sure has performed well since my pick back in early 2003. However, the price has been flat for this past year. The latest quarterly report was strong and the Morningstar.com report looks nice for the past few years. Valuation-wise, the p/e is relatively low, the Price/Sales ratio is at a good valuation, and the PEG also looks nice. Revenue has also shown steady growth and the balance sheet is solid. Overall, not much to dislike about this stock, except for the relatively unimpressive chart, which recently has broken through resistance into positive territory.
Thanks so much for visiting! If you have any comments or questions please feel free to email me at bobsadviceforstocks@lycos.com or leave them right on the blog.
Bob
Newer | Latest | Older


