Stock Picks Bob's Advice
Monday, 27 March 2006
Candela Laser (CLZR) Revisiting a Stock Pick
Click ***HERE*** for my PODCAST ON CANDELAHello Friends! Thanks so much for stopping by and visiting my blog,
Stock Picks Bob's Advice. As always, please remember that I am an amateur investor, so please remember to consult with your professional investment advisors prior to making any investment decisions based on information on this website.

I was looking through the
list of top % gainers on the NASDAQ today, and came across Candela Laser (CLZR) which as I write is trading at $20.68, up $1.48 or 7.76% on the day. I do not own any shares nor do I have any options on this stock.
I first
reviewed CLZR on Stock Picks Bob's Advice on January 28, 2004, a bit over two years ago, when it was trading at $26.38. CLZR split 2:1 on 3/17/04, giving my pick an effective price of $13.19. With today's price of $20.68, this represents a gain of $7.49 or 56.8% since posting on the blog.
Let's take a closer look at this company and I will share with you my thinking as to why this stock deserves a second look.
First of all, what they do:
According to the
Yahoo "Profile" on Candela, the company
"...engages in the research, development, manufacture, marketing, sale, and servicing of lasers and light-based products used to perform aesthetic and cosmetic procedures worldwide. Its product line includes GentleLASE family of lasers for the treatment of unwanted hair and for the treatment of vascular lesions, pigmented lesions, and wrinkles; Vbeam for the treatment of vascular lesions, wrinkles, psoriasis, and other conditions; ALEXLAZR for the treatment of pigmented lesions and tattoos; Smoothbeam diode laser for nonablative dermal remodeling of wrinkles, and the treatment of acne and acne scars; C-beam pulsed dye laser for treatment of psoriasis and surgical scars; and Ellipse Intense Pulsed Light system for the improvement of sun-damaged skin by photo rejuvenation through removal of both vascular and dyspigmentation."
And how about the latest quarterly result?
On January 31, 2006, Candela
reported 2nd quarter 2006 results. For the quarter ended December 31, 2005, revenues came in at $37.7 million, a 34% increase over the $28.2 million reported in the year-earlier figure. Income from continuing operations climbed 158% to $4.5 million, from $1.75 million the prior year same period. On a per share basis, earnings grew 171% to $.19/share from $.07/share last year.

What about longer-term results?
Reviewing the
Morningstar.com "5-yr Restated" financials on CLZR, we can see that revenue actually dipped from 2001 when it was $60.9 million to $58.7 million in 2002. However, since 2002, revenue has grown steadily and strongly to $123.9 million in 2005 and $139.1 million in the trailing twelve months (TTM).
Earnings have also been a bit erratic, dropping from $.11/share in 2001 to a loss of $(.11)/share in 2002, then climbing to $.36/share in 2004, dropping to $.32/share in 2005 and to $.40 in the TTM.
Free cash flow has also bounced around a bit, dropping from $10 million in 2003 to $0 in 2004, then has climbed strongly to $18 million in 2005 and $12 million in the TTM.
Reviewing the Morningstar.com balance sheet, we find that CLZR has $52.6 million in cash and $49.5 million in other current assets. When balanced against the $32.3 million in current liabilities, this yields a current ratio of of more than 3.0. (Stocks with a current ratio of 1.5 or higher are generally considered financially health at least in the short run.) In fact, the $52.6 million in cash is enough by itself to pay off the combined $32.3 million in current liabilities and the $5.6 million in long-term liabilities.

What about some 'valuation' numbers?
Looking at the
Yahoo "Key Statistics" on Candela Laser, we can see that this is a small cap stock with a market capitalization of only $484.04 million. The trailing p/e is rich at 51.71, but the forward p/e is better at 23.47 (fye 02-Jul-07). With the rapid growth anticipated (5 yr expected), we have a PEG of only 0.90. (PEG's under 1.0 are downright cheap imho.)
Checking the
Fidelity.com eresearch website, for the Price/Sales ratio assessment, we can see that Fidelity has assigned Candela Laser to the "Medical Appliances/Equipment" industrial group. Within this group, CLZR is moderately priced relative to the Price/Sales ratio. Topping the group is St. Jude Medical (STJ) at a Price/Sales ratio of 5.7. This is followed by Zimmer Holdings (ZMH) at 5.2, Biomet (BMET) at 4.4, then Candela (CLZR) at 3.2, Edwards Lifesciences (EW) at 2.8 and Medtronic, with a Price/Sales ratio of 0 (?) (Yahoo actually assigns Medtronic with a Price/Sales ratio of 5.84...which makes more sense to me!).
What about some other statistics on this stock?
Going back to Yahoo, we find that there are 23.17 million shares outstanding with 22.93 million of them that float. As of 2/10/06, there were 1.14 million shares out short, representing 5% of the float or 1.14 trading days of volume. (the short ratio).
No dividends are reported, and as noted above, the stock last split 3/17/04, when it declared a 2:1 split.
How about a chart?
Reviewing a
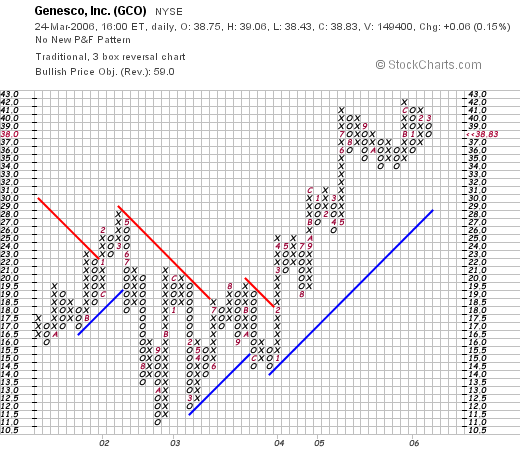
"Point & Figure" chart on Candela from StockCharts.com:
We can see that the stock traded weakly from May, 2001, when it hit $4.25, down to a low of $1.75 in February, 2002. Since then, the stock was trading strongly higher, until it hit a weak period between April, 2004, and November, 2004, when it hit an intermediate low at $7.50. After breaking through resistance in August, 2005, at around $12.50, the stock has been trading higher once again. Over-all the graph looks fine to me.
So what do I think?
Well, this is an interesting stock! I like the latest quarterly results, the Morningstar.com "5-Yr" wasn't bad, free cash flow is positive and the balance sheet is solid. The chart looks nice, and valuation-wise, we have a PEG under 1.0, and the Price/Sales in the midst of its industrial group. This stock is a very small cap company, so that imho means volatility, but also the possibility of sustained growth over the longer-haul.
Thanks so much for stopping by and visiting! If you have any comments or questions, please feel free to leave them on the blog or email me at bobsadviceforstocks@lycos.com.
Bob
Posted by bobsadviceforstocks at 1:32 PM CST
|
Post Comment |
Permalink
Updated: Monday, 27 March 2006 9:41 PM CST
Sunday, 26 March 2006
Genesco (GCO) Weekend Trading Portfolio Analysis
Click ***HERE*** For my Podcast on GENESCO
Hello Friends! Thanks so much for stopping by and visiting my blog,
Stock Picks Bob's Advice. As always, please remember that I am an amateur investor, so please remember to consult with your professional investment advisors prior to making any investment decisions based on information on this website.
This past year, I have started reviewing the actual stocks in my own trading portfolio. I do this out of wishing to provide you with an understanding of what I actually do with stocks in practice. Not just theory. I select stocks from the universe of stocks discussed on this blog, and follow the trading rules that I have advocated here on this website. With 21 stocks in my trading portfolio, of a maximum of 25 positions, it would take me a little over 5 months if I review one stock weekly. Not liking to 'over-plug' my own holdings, I am going to try to do these review every other week, so that it will take me about a year to get back to the same stock assuming I still own it, as I review each of my holdings.
Two weeks ago, I
reviewed Cytyc (CYTC) on Stock Picks Bob's Advice. Going alphabetically through my holdings, I am up to Genesco (GCO).

I currently own 200 shares of Genesco (GCO) which were acquired almost a year ago, on May 26, 2005, with a cost basis of $34.40/share. I have not sold any shares of my original purchase. GCO closed at $38.83 on 3/24/06 for a gain of $4.43 since my purchase or 12.9%. My trading goals include selling portions of holdings at pre-set appreciation targets. My first targeted sale would be for 1/6th of my holding (200/6 = 33 shares) if the stock should appreciate to a 30% gain (1.30 x $34.40 = $44.72). On the downside, not having sold any shares yet, my sale of all of my shares would occur if the stock should drop to an 8% loss from my purchas (.92 x $34.40 = $31.65).
I fist
discussed Genesco (GCO) on Stock Picks Bob's Advice on November 18, 2004, when it was trading at $28.35. I also performed my first
"Weekend Trading Portfolio Analysis" on Genesco on October 30, 2005, when it was trading at $35.85.
Let's take another look at this stock and see if it still fits into my investment strategy.
First, a description of the business. According to the
Yahoo "Profile" on Genesco (GCO), the company:
"...ngages in the design, marketing, and distribution of footwear, headwear, and accessories. The company distributes footwear under its own Johnston & Murphy brand and under the licensed Dockers brand to retail accounts, including various department, discount, and specialty stores. It operates through five segments: Journeys, Underground Station Group, Hat World, Johnston & Murphy, and Dockers Footwear."
And what of the latest quarterly result?
On March 2, 2006, Genesco
reported 4th quarter 2006 results. For the fourth quarter ended January 28, 2006, net sales increased 15% to $406 million from $353 million in the same quarter in fiscal year 2005. Earnings came in at $31.2 million or $1.15/diluted share, up from $25.4 million, or $.97/diluted share the prior year. These results are "before discontinued operations".
And how about a longer-term view?
Reviewing the latest
Morningstar.com "5-Yr Restated" financials, we can see the very steady revenue growth from $700 million in 2001 to $1.1 billion in 2005 and $1.2 billion in the trailing twelve months (TTM).
Earnings have been a little erratic, increasing from $1.21 in 2001 to $1.46 in 2003, then dropping to $1.20 in 2004, but rebounding to $1.91/share in 2005 and $2.21 in the TTM. The shares outstanding has been very stable with 22 million in 2001, 22 million in 2005 and 23 million in the TTM.
Free cash flow has grown nicely from $6 million in 2003 to $60 million in 2005 and $44 million in the TTM.
The balance sheet looks solid with $33.4 million in cash and $341.5 million in other current assets, which, when compared with the $178.7 million in current liabilities, yields a current ratio of just over 2.0. Generally anything over 1.5 is 'healthy' imho.
The combined current assets is almost enough to pay off both the $178.7 million in current liabilities and the $232 million in long-term liabilities combined.
How about some statistics on this stock?
Reviewing
Yahoo "Key Statistics" on GCO, we can see that this is a mid-cap stock with a market capitalization of $888.0 million. The trailing p/e is a very reasonable 16.96, with a forward p/e (fye 28-Jan-08) estimated at 13.16. The (5 yr expected) PEG comes in at a very reasonable level of 1.1.
According to the
Fidelity.com eresearch website, Genesco has a very reasonable Price/Sales ratio of .9. Within its industrial group of "Apparel Stores" topping the group is Chico's (CHS) (that I just reviewed in the previous note) with a Price/Sales ratio of 5.3. This is followed by American Eagle (AEOS) at 2.0 and Abercrombie & Fitch (ANF) at 2.0), Pacific Sunwear (PSUN) at 1.2, Limited (LTD) at 1.0, and Genesco (GCO) at the bottom of the list, implying the best value, with a Price/Sales ratio of 0.9 as noted.
Yahoo reports only 22.87 million shares outstanding with 22.40 million that float. As of 3/10/06, there were 839,060 shares out short representing 3.8% of the float or 3 trading days of average volume (the short ratio).
No dividend is paid.
What about a chart?
Since I have reviewed this stock before, let's take a look at a few of the past charts I have posted.
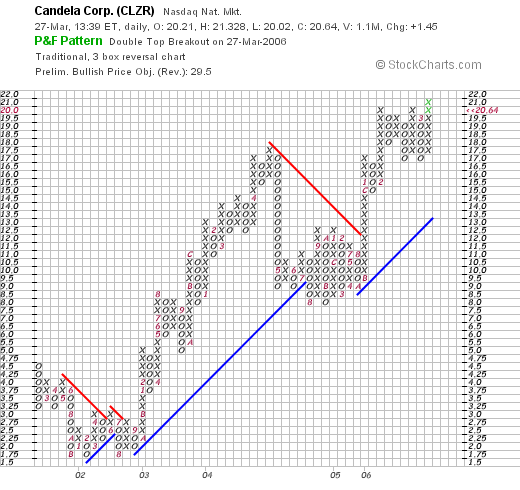
This was the StockCharts.com chart I posted 10/28/05.
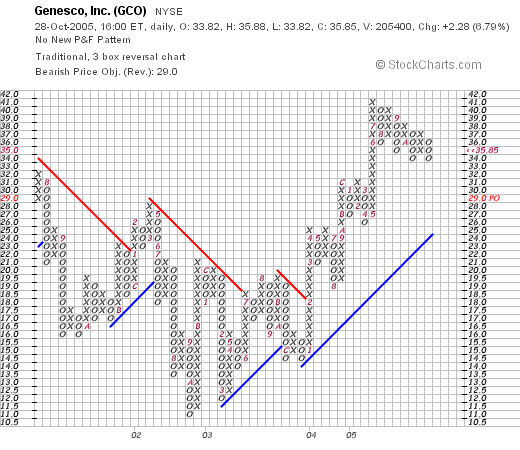
And this is the latest chart from StockCharts.com from 3/24/06.
You can see the chart, which had some weakness between March, 2002, when it was trading at $29, until October, 2002, when the stock dropped as low as $11, has been behaving steadily better since and continues to move higher. The chart looks fine to me.
So what do I think? I am happy to have this stock in my portfolio. It represents a company showing steady growth with reasonable valuationa and a nice chart 'to boot!'.
Thanks so much for visiting my blog! If you have any comments or questions, please feel free to email me at bobsadviceforstocks@lycos.com or leave your comment right on the blog.
Bob
Posted by bobsadviceforstocks at 10:45 AM CST
|
Post Comment |
Permalink
Updated: Sunday, 26 March 2006 11:55 AM CST
"Looking Back One Year" A review of stock picks from the week of January 3, 2005

Hello Friends! Thanks so much for stopping by and visiting my blog,
Stock Picks Bob's Advice. As always, please remember that I am an amateur investor, so please remember to consult with your professional investment advisors prior to making any investment decisions based on information on this website.
On as many weekends as I can, I like to review past stock investment ideas and see how they would have turned out if I had chosen to purchase those shares. Of the many stocks I discuss, only a few are actually added to my own trading portfolio. It should also be noted that my own investment strategy is to sell stocks quickly and completely at small losses and to sell my gaining stocks slowly and partially at targeted appreciation points. For the purposes of this review, I assume a buy and hold strategy to determine the performance of the picks. This strategy would necessarily result in a different performance result than would the practice I employ in reality.

On January 5, 2005, I
posted Build A Bear Workshops (BBW) on Stock Picks Bob's Advice when it was trading at $34.18. BBW closed at $29.37 on 3/24/06 for a loss of $(4.81) or (14.1)%.

On February 16, 2006, BBW
announced 4th quarter 2005 results. For the quarter ended December 31, 2005, revenue climbed 18.7% to $118 million, compared with $99.4 million in the same quarter the prior year. Net income for the quarter grew 68.1% to $10.6 million or $.52/diluted share, vs. $6.3 million or $.32/diluted share in the prior year.

On January 6, 2005, I
"revisited" Chico's FAS (CHS) on Stock Picks Bob's Advice when it was trading at $48.98/share. Chico's split 2:1 on February 23, 2005, shortly after I picked this stock, giving me an effective pick price of $24.49/share. CHS closed at $40.81 on 3/24/06, for a gain of $16.32 or 66.6% since posting.
On March 1, 2006, Chico's
announced 4th quarter results. For the quarter ended January 28, 2006, sales grew 32% to $375.7 million from $285.6 million. Earnings were up at $44.5 million or $.24/share, from $33 million, or $.18/share the prior year. As the report noted:
"Same-store sales, or sales at stores open at least one year, jumped 14.6 percent during the period. The figure is a key measure of a retailer's performance."
However, analysts were looking for $.25/share on sales of $377 million, so on that measure the company did disappoint on expectations.

Finally, on January 8, 2005, I
posted Constellation Brands (STZ) on Stock Picks Bob's Advice when it was trading at $49.13. STZ split 2:1 on May 16, 2005, giving me an effective pick price of $24.57. STZ closed at $25.56 on 3/24/06 for a gain of $.99/share or 4.0% since posting.
On January 5, 2006, Constellation
reported 3rd quarter 2006 results. Sales came in at $1.3 billion, up 17% from the prior year. Net income was up 12% to $109 million and diluted earnings per share climbed 10% to $.46.
So how did I do on these three stock picks? Well, basically two were unimpressive, and one, Chico's did fabulously. Thus, the average performance for the three stock selections was a gain of 18.8% since posting.
Thanks so much for stopping by and visiting! If you have any comments or questions, please feel free to email me at bobsadviceforstocks@lycos.com or just leave your words right on the blog!
Bob
Thursday, 23 March 2006
March 23, 2006 National Research Corp. (NRCI)
***HERE*** for my PODCAST on National Research Corp (NRCI)Hello Friends! Thanks so much for stopping by and visiting my blog,
Stock Picks Bob's Advice. As always, please remember that I am an amateur investor, so please remember to consult with your professional investment advisors prior to making any investment decisions based on information on this website.

I was reviewing the
list of top % gainers on the NASDAQ today and came across National Research Corp. (NRCI). I do not own any shares or options on this company. NRCI is trading at $23.50, up $2.26 or 11.02% on the day as I write.
According to the
Yahoo "Profile" on NRCI, the company
"...provides ongoing survey-based performance measurement, analysis, tracking, and improvement services to the healthcare industry. The company addresses healthcare organizations’ need to track their performance at the enterprise-wide, departmental, and physician/caregiver levels."
Let's take a closer look at this stock and I will try to show you why I believe it fits into the investing strategy I like to follow on this website.
First, the latest quarterly result.
On February 14, 2006, NRCI
announced 4th quarter 2005 results. Revenues for the quarter came in at $8.6 million, compared with $6.4 million in the same quarter the prior year. This is a 34% increase in revenue year over year. Net income for the quarter came in at $1.5 million or $.22/diluted share, up from $921,000 or $.13/diluted share the year earlier. This increase represents a 69% increase on a per share basis of earnings! The company did two more things that I believe are also helpful in improving stock price performance, besides the outstanding revenue and earnings report. They increased the quarterly dividend to $.10/share (I am not sure of the previous dividend amount), and they announced a plan to repurchase up to 750,000 of the Company's common stock. Both increasing a dividend and reducing the number of shares outstanding are in general bullish developments for a stock price.
What about longer-term financial results for this company?
For this, let's review the
"5-Yr Restated" financials on NRCI from Morningstar.com. First, looking at the revenue picture, except for a dip in revenue from $18.3 million in 2000 to $17.7 million in 2001, revenue has been increasing steadily to $29.7 million in 2004 and $30.3 million in the trailing twelve months (TTM).
Earnings show a similar pattern, dropping from $.39/share in 2000 to $.24/share in 2001, but then increasing to $.63/share in 2004 and $.65 in the TTM.
The Morningstar report suggests that the company started paying dividends just in the 2005 fiscal year and apparently was paying $.08/share in the first three quarters. This explains the increase to $.10/share reported in the latest earnings report. (Unless of course the Morningstar report is based on $.07/share x 2 quarters
with the latest $.10/share included in the $.24 (?)). In any case, the trend is encouraging!
And free cash flow? National Research had $3 million in free cash flow in 2002, $6 million in 2004 and $8 million in the TTM. Again a solid trend.
And the balance sheet? Morningstar shows National Research with $15.7 million in cash and $7.4 million in other current assets, which, when balanced against the $8.3 million in current liabilities, yields a current ratio of almost 3. In fact, the cash alone is enough to pay off both the $8.3 million in current liabilities
and the long-term liabilities of $6.8 million combined. This balance sheet looks 'just fine' to me!
What about some valuation numbers on this company?
Looking at the
Yahoo "Key Statistics" on National Research, we can see that this is a
small company with a market capitalization of only $164.88 million. The trailing p/e is moderate at 31.93. I don't have a forward p/e or a PEG as the company probably doesn't have many analysts out there making predictions about their financial results (?).
Examining the Price/Sales ratio, using the
Fidelity.com eresearch website, we find that the company is in the "Research Services" industrial group, and sits midway in this group in regards to its Price/Sales ratio, with a ratio of 4.9. Leading this group is EXELIXIS (EXEL) with a ratio of 11.7, followed by Gen-Probe (GPRO) at 9.3, SYMYX (SMMX) at 8.8, then NRCI at 4.9, Covance (CVD) at 3, and at the bottom of the barrel with the 'best' valuation is PAREXEL (PRXL) with a Price/Sales ratio of 1.
Going back to Yahoo for some more statistics on this company, we find that there are only 7.02 million shares outstanding and 2.14 million of them that float. No shares are reported out short as of 2/10/06. The company has an estimated dividend of $.40/share yielding 2.00%. No stock splits are reported on Yahoo.
How about a chart?
Looking at the
"Point & Figure" chart on NRCI from StockCharts.com:
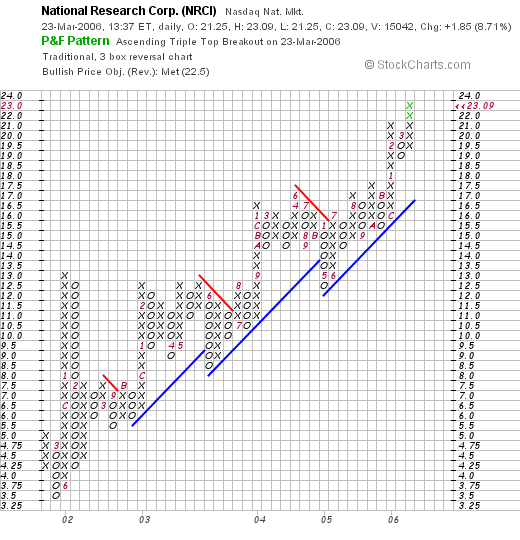
We can actually see that this stock has what I personally would call a gorgeous chart with a very steady increase in stock price from $3.50 in March, 2001, to the current level of $23.09. The chart looks nice to me with the steady increase without appearing over-extended, which from my perspective, means getting too far ahead of the 'blue support line'. That's about as far as my technical expertise extends :).
So what do I think. Well, except for the small size of the company this is an impressive stock with great latest earnings, steady revenue and earnings growth, grossly reasonable valuation, and a wonderful chart. In addition, the company pays a small dividend which the management is increasing and they are buying back shares of their already limited float. What else could a fellow want?
Anyway, thanks again for visiting. If you have any comments or questions, please feel free to leave them on the blog or email me at bobsadviceforstocks@lycos.com.
Bob
Posted by bobsadviceforstocks at 1:30 PM CST
|
Post Comment |
Permalink
Updated: Thursday, 23 March 2006 8:44 PM CST
Wednesday, 22 March 2006
A Reader Writes "...I wanted to know what you think about the stock SIRI...."
Hello Friends! Thanks so much for stopping by and visiting my blog,
Stock Picks Bob's Advice. As always, please remember that I am an amateur investor, so please remember to consult with your professional investment advisors prior to making any investment decisions based on information on this website.

I have to admit, that the question of what to do with SIRI (Sirius Satellite Radio), is a common concern I have addressed on this blog. Before I get into my answer to this question, let me point out that I cannot predict the direction of any stock in the stock market. Sirius may turn out to be a fabulous investment, insofar as the stock price is concerned. Or it may turn out to be a dog. All that I am able to do is to comment on whether the stock fits my own particular approach to selecting stocks. My approach does NOT in any way include all of the stocks, or even most of the stocks, that are eventually going to be appreciating in price. It is just a strategy that seems to work for me. That being said, let me first share with you an email I received earlier today. Danny K. wrote:
"Dear Bob,
I know that you do not like stocks under 10 dollars. But i wanted to
know what you think about the stock SIRI, Sirius Satelight Radio. Many
of my colleagues think that this stock will have steady continuous
growth in the next year or so. I'm not sure if it is just the hype
that they released the information that just reached 4 million
subscribers or not. Please let me know what you think.
Thanks
Danny
PS. Love your Blog. Keep up the good work."
Thank you for writing! Please let me know what you decide to do with Sirius (SIRI) and how it works out for you. I actually love satellite radio, although I have XM in my car, and not SIRI. I really believe that once consumers experience satellite radio, they will never go back to "rabbit ears" again.
If you are interested, I posted a fairly in depth Review of SIRI on Stock Picks Bob's Advice on January 21, 2005. But let's update that review with another look at the company.
First of all, the latest quarterly result.
On February 17, 2006, SIRI reported 4th quarter 2005 results. On a positive note, revenue expanded strongly to $80 million from $25.2 million, a more than tripling of last year's result. The company, however, reported a loss of $(311.4) million, a larger loss than the $(261.9) million reported in the same quarter last year. So not only is the company losing money, it is losing more money this year than last. This is not my kind of stock.
What about the Morningstar.com results?
Reviewing the "5-Yr Restated" financials on Morningstar.com on SIRI, we can see that the company had NO revenue in 2001, $800,000 in revenue in 2002 and has increased revenue rapidly to $67 million in 2004 and $187 million in the trailing twelve months (TTM). So far so good.
Earnings however, have yet to show a profit and have been generally been decreasing on a per share basis, except initially when losses grew from $(4.72)/share in 2000 to $(6.13)/share in 2002. In 2003 losses dropped to $(.38)/share but have subsequently been increasing to $(.57) in 2004 and $(.62)/share in the TTM. In fact, looking at per share results in this company is absurd. It is necessary to look at overall company results. That is, look at the earnings or losses prior to dividing out the number of shares. That is necessary because of the incredible explosion of shares outstanding (more on that later.)
Looking at profits or losses we can see that the company lost $(184) million in 2000, $(278) million in 2001, $(468) million in 2002, $(314) million in 2003, $(712) million in 2004 and $(813) million in the trailing twelve months (TTM). If losses are increasing, then why do you think the per share results look better.
This is where the number of shares outstanding is so critical. In 2000, the company had 39 million shares according to Morningstar. You may recall in other blogs how I point out the importance of finding a company that is not diluting your ownership with new shares. Watch this.
In 2001, shares grew to 52 million, in 2002 there were 76 million. By 2003, Sirius had 827 million shares, which grew to 1.25 BILLION shares in 2004 and 1.331 billion in the TTM. In spite of the growth in the number of shares, with the continued expansion of losses, the loss per share was STILL increasing the past several years!
What about free cash flow?
This figure tells you whether the company is creating cash or burning up available assets. SIRI has been continuing to consume free cash at the tune of $(362) million in 2002, $(305) million in 2003, $(363) million in 2004, and $(381) million in the TTM.
And the balance sheet?
Here we can see that the company does show $934.4 million in cash and $98.5 million in other current assets. This is enough to pay off the $380.4 million in current assets, and have a current ratio of over 2.5 to 1. The company is also saddled with $1.14 billion in long-term debt.
Is the company going to grow fast enough and turn profitable enough soon to turn this around? That is the '64,000 question'. The company itself is optimistic. As nloted in the earnings report:
"The company also said it expected to be profitable next year, and to generate about $3 billion in revenue and $1 billion in free cash flow, after expenditures, in 2010. Sanford C. Bernstein analyst Craig Moffett called the forward projection "very positive" in a note to investors."
This is certainly an encouraging note from the management of this company. Let's hope that they are successful in this endeavor, and that the many holders of the stock do well in their purchase of these shares. It may just turn out this way. I certainly love the product.
As for me, this investment is a bit too speculative. I don't like the over 1 billion in shares already outstanding, the mounting losses, the negative free cash flow, and the latest quarterly report does not change this outlook.
And the chart?
Looking at the
"Point & Figure" chart on SIRI from StockCharts.com:
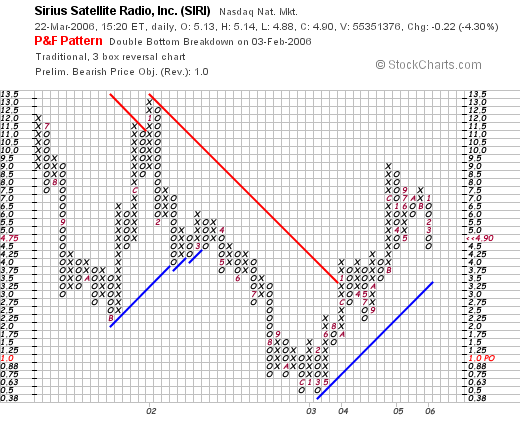
The chart actually looks a bit encouraging. after a decline from $13 in January, 2002, the stock hit a 'double bottom' in December, 2002 at the $.50 level, them broke through resistance in December, 2003, at $3.00, and is actually trading more or less higher since to the current $4.90 level.
So what do I think? SIRI might be a great investment that will yield untold riches to any purchaser of the stock today. Could be. Honestly. But it is not my kind of investment. I am looking for profitable companies with positive free cash flow and solid balance sheets with stable number of shares outstanding. That is just my trading requirements. You might be able to make loads of money doing something else. Good luck with whatever you decide. Please keep me posted!
Thanks again for visiting. If you have any comments or questions, please feel free to leave them on the blog or email me at bobsadviceforstocks@lycos.com.
Bob
Tuesday, 21 March 2006
A New Podcast on Investing Philosophy!
Hello Friends! Thanks for stopping by and visiting my blog,
Stock Picks Bob's Advice. As always, please remember that I am an amateur investor, so please remember to consult with your professional investment advisors prior to making any investment decisions based on information on this website.
I wanted to let you know that I have a new podcast:
"Philosophy of Investing Podcast". Please listen and let me know what you think! You can reach me at bobsadviceforstocks@lycos.com or just leave your comments right here on the blog.
Bob
A Reader Writes "...if you know of a site online listing all stocks in the djia?"
Hello Friends! Thanks so much for stopping by and visiting my blog,
Stock Picks Bob's Advice. As always, please remember that I am an amateur investor, so please remember to consult with your professional investment advisors prior to making any investment decisions based on information on this website.
I had a nice email this past weekend from Mick in Tokyo who wrote:
"Bob,
Nice program.
First, and least importantly, I am in Tokyo and have been haphazardly
trading stocks and avoiding disaster.
I am looking at a slew of investing techniques and ideas - from stocks to
forex currency trading - to see which suits me and your program is
nutritious food for thought.
Second, I have bought a DVD that advocates buying securities that have made
a series of highs, such as for 20 or 30 days. This kind of seemed to overlap
with your idea of finding stocks that have already made enough of a move to
land in the top percentage gainers. I think this raises the idea of whether
there might be a better way of getting at stocks that are moving higher but
fall under your top percentage radar.
I am most interested to know if you know of a site online listing all stocks
on the djia and, better yet, that has a filter for stocks over 5 or 10
dollars, or by market cap.
Thanks for your time.
Yours from Tokyo,
Mick"
First of all, thank you so much for writing Mick. I am not sure if your DVD exactly covers my approach, but probably the idea is the same. We are both looking for stocks that are showing technical strength. Either in terms of setting frequent new highs, or just simply moving higher in an amount greater than the other stocks.
Insofar as those $5-$10 stocks, I generally stay away from them. As you might know, I prefer stocks that are at least $10 if not higher. This prevents me from being whip-sawed so to speak buying and selling a stock that I should otherwise either not be purchasing, or instead ignoring the movements that might lead to me selling a stock prematurely.
But I did go look for your websites. First, the
Dow Jones Indexes has a nice summary of the components of the Dow Jones Industrial Average.
In addition, I found a
Yahoo "Stock Screener" that might be helpful to you or the other readers.
Thanks again for writing! Please drop me a line and let me know how you are progressing in your own investment strategy exploration. If you or any other readers have comments or questions, please feel free to email me at bobsadviceforstocks@lycos.com and I shall try to get back to as many of you as possible...usually on the blog!
Bob
Posted by bobsadviceforstocks at 3:41 PM CST
|
Post Comment |
Permalink
Updated: Tuesday, 21 March 2006 3:41 PM CST
March 21, 2006 Phillips-Van Heusen (PVH)
Hello Friends! Thanks so much for stopping by and visiting my blog,
Stock Picks Bob's Advice. As always, please remember that I am an amateur investor, so please remember to consult with your professional investment advisors prior to making any investment decisions based on information on this website.

This afternoon, while looking through the
list of top % gainers on the NYSE, I came across Phillips-Van Heusen (PVH) which as I write is trading at $38.51, up $3.26 or 9.25% on the day. I do not own any shares nor do I have any options on this stock.

According to the
Yahoo "Profile" on Phillips-Van Heusen, the company
"...operates as an apparel company worldwide. The company designs and markets branded dress shirts, sportswear, footwear, and other related products, as well as licenses its brands for an assortment of products. Its sportswear products include men's knit and woven sport shirts, sweaters, bottoms, swimwear, boxers, and outerwear. The company’s footwear products include casual and dress casual shoes for men, women, and children, and apparel and accessories, such as handbags, belts, and travel gear, for men and women. The company’s licensed brands comprise Geoffrey Beene, Kenneth Cole New York, Reaction Kenneth Cole, BCBG Max Azria, BCBG Attitude, MICHAEL Michael Kors, Chaps, Sean John and, Donald J. Trump Signature Collection."
What drove the stock higher today was the
announcement of 4th quarter 2005 results after the close of trading yesterday. For the quarter ended January 29, 2006, revenues increased 11% to $460.1 million from $413.8 million in the prior year same period. Net income worked out to $22.9 million or $.41/share, which exceeded previous guidance by $.04/share. This was a 32% increase over the prior year's net income of $17.3 million or $.33/share. In addition, the raised guidance for 2006. In my book this is a 4/4 earnings report with: increased earnings, increased revenues, exceeding of guidance, and raising of guidance, all in the same report.

How about longer-term results?
Taking a look at the
Morningstar.com "5-Yr Restated" financials, we can see that the company was fairly stagnant between 2001 and 2003 when revenue slipped from $1.46 billion to $1.41 billion. Earnings also dropped from $1.10/share to $1.08/share in 2003 and $(.18)/share in 2004. However, since 2003, revenue has grown steadily and substantially to $1.86 billion, and earnings have improved from the loss in 2004 to $1.14/share in 2005 and $1.79 in the trailing twelve months (TTM).
Since 2001, the company has also paid a dividend, paying $.15/share each year. The company has been expanding its number of shares, a development that we should pay attention to, increasing from 27 million shares in 2001 to 31 million in 2005 and 42 million in the trailing twelve months.
Another big plus on this report is the free cash flow which although dropping from $76 million in 2003 to $24 million in 2004 has since increased strongly to $96 million in 2005 and $149 million in the TTM.

Looking at the balance sheet on Morningstar.com, we can see that the company is reported to have $170.3 million in cash and $473.5 million in other current assets for a total of approximately $614 million. Compared to the current liabilities of $217 million, this works out to a 'current ratio' of almost 3. The company also has an additional $943.1 million in Long-Term liabilities.
What about some valuation numbers on this stock?
Reviewing the
Yahoo "Key Statistics" on Phillips-Van Heusen, we can see that this is a mid-cap stock with a market capitalization of $1.63 billion. The trailing p/e is a reasonable 23.80 with a forward p/e (fye 30-Jan-07) of 17.78. The PEG works out to 0.95.
Examining the
Fidelity.com eResearch website, we can see that this company is in the "Textile-Apparel Clothing" industrial group. Topping the group relative to the Price/Sales ratio is BEBE Stores (BEBE) with a ratio of 3, followed by Columbia Sportswear (COLM) at 1.8, then Phillips-Van Heusen (PVH) and VF Corp (VFC) at 1.0, and Hot Topic (HOTT) at 0.9, and Quiksilver (ZQK) at 0.9. Thus valuation by this parameter looks pretty reasonable as well.
Finishing up with Yahoo we find that there are 42.33 million shares outstanding with 36.52 million that float. Of these, 1.82 million shares are out short representing 5.2 trading days of average volume (the short ratio). Thus, with an announcement of good news today, and a sharp move higher, one can only speculate about a 'squeeze' of the shorts resulting in additional buying pressures.
As noted above, the company does pay a small dividend of $.15/share yielding 0.40%. The last stock split reported on Yahoo was more than 14 years ago when the stock split 2:1 in October, 1991.
What about a chart?
Looking at a
"Point & Figure" chart on Phillips-Van Heusen (PVH) from StockCharts.com:
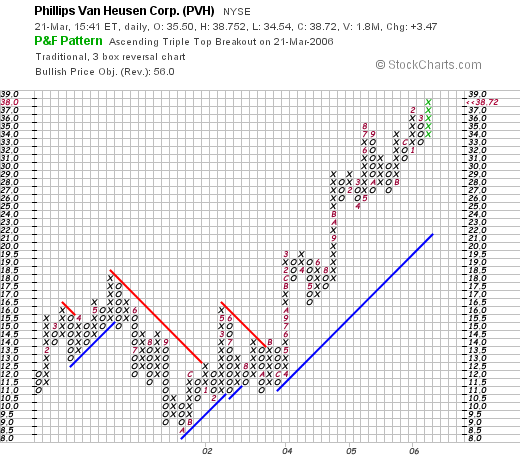
We can see that this stock also floundered in price between January, 2001, when the stock was at $11.00/share, until October, 2001, when the stock bottomed at $8.50. Since then, the stock has been climbing fairly steadily, breaking through resistance in October, 2003, at $13, and steadily moving to the current level at $38.72 today. The chart looks nice to me.
So what do I think? Well, I like this stock. The earnings report was solid, fulfilling the four things I like to see in a report: increase earnings, increased revenues, the exceeding of guidance in the quarter and the raising of guidance going forward.
The Morningstar.com report, while not perfect, shows a very nice improvement in results the past few years. Free cash flow is solid and growing. The company pays a small dividend, and valuation is nice with a PEG under 1.0, and a Price/Sales at 1.0 which was on the lower end of its group. In addition, the chart looks nice.
On a negative note, the company is issuing new shares and has a bit of a significant long-term debt. However, this appears to be related to acquisitions which appear to be managed successfully.
Now, if only I had the permission to be buying a new stock! Thanks so much for stopping by! If you have any comments or questions, please feel free to leave them on the blog or email me at bobsadviceforstocks@lycos.com.
Bob
Monday, 20 March 2006
A Reader Writes "And what are some basic principals you go by when picking stocks?"
Hello Friends! Thanks so much for stopping by and visiting my blog,
Stock Picks Bob's Advice. As always, please remember that I am an amateur investor, so please remember to consult with your professional investment advisors prior to making any investment decisions based on information on this website.
One of my favorite activities on this blog, is to receive and respond to letters regarding investing, stock picks, suggestions, critiques, and words of support. If you have any comments or questions please feel free to email me at bobsadviceforstocks@lycos.com.
Last week I received a letter from Ryan who wrote about my investment philosophy. He wrote:
"Hi Bob,
What stocks do you currently hold. And what are some basic principals you go by when picking stocks. I'm relatively new to the stock market. Thanks.
Ryan"
Let me answer your question in two parts. First of all, in the interest of transparency, I would like to briefly go over my holdings; I try to review one of my holdings each weekend in my "Trading Portfolio Analysis" entries.
As of March 20, 2006, my current trading consists of 21 stocks: Barnes Group (B) 180 shares, Dynamic Materials (BOOM) 200 shares, Coach (COH) 102 shares, Cytyc (CYTC) 225 shares, Genesco (GCO) 200 shares, Helix Energy (HELX) 142 shares, Hibbett Sporting Goods (HIBB) 84 shares, Healthways (HWAY) 128 shares, JLG Industries (JLG) 160 shares, Jos A Bank (JOSB) 187 shares, Kyphon (KYPH) 150 shares, Morningstar (MORN) 167 shares, Packeteer (PKTR) 400 shares, Quality Systems (QSII) 44 shares, Resmed (RMD) 180 shares, Starbucks (SBX) 59 shares, SRA International (SRX) 320 shares, St Jude (STJ) 180 shares, Sybron Dental (SYD) 113 shares, Meridian Bioscience (VIVO) 210 shares, and Ventana Medical Systems (VMSI) 225 shares.
I will continue to try to get in review weekly on each of these positions.
Your second question is about how I go about and pick stocks. I tried to answer this on an earlier podcast but let me once again try to put down my investing philosophy and strategy a little more clearly.
Some of the questions that need to be addressed include how do I pick stocks, when do I actually buy new positions, when I sell stocks, and how do I manage to adjust my portfolio to changing investment environments. In other words, do I have a mechanism of moving into stocks when times are good, and move into relatively more cash when times are bad.
First on picking stocks. Almost every day you can find me at some time looking through the lists of top % gainers in the market. I emphasize NASDAQ stocks, which seem to have the fastest growing companies, next review NYSE issues and last, take a look at the AMEX stocks. I have a couple of idiosyncratic things that I like to do, which includes avoiding financial stocks which need to be evaluated in an entirely different fashion, and generally staying with stocks that are $10 or greater.
From this list of top % gainers, I generally open up my Morningstar.com "5-Yr Restated" financials page. On the Morningstar.com page, I check for some evidence of
persistence of results, you could say financial 'momentum', that is, I look for steady revenue growth. A trend towards earnings improvement (making sure the company is profitable), and positive and hopefully growing free cash flow. Other facts that I examine, but are not necessarily necessary for a pick, is the presence of a dividend that ideally would be increasing as well. Furthermore, it is important to make sure that the number of shares outstanding is stable or even decreasing.
My review of the balance sheet includes evaluating the relative balance between the current assets and the current liabilities. This is called the "current ratio" which at least is 1.5 or greater. I like to look at the relative ability of the combined current assets to pay off both the current liabilities and the long-term liabilities combined. This is an extra "plus" in my review.
Next step is to look at the latest quarterly result. I insist on growth in both earnings and revenue in the latest quarter. Additional positive findings for me include whether the company has exceeded 'expectations' and whether the company raises guidance for future quarters.
In my review, I like to go next to the "Key Statistics" page on Yahoo finance. There I look at the size of the company (the market cap), the P/E, and the PEG ratio. The more reasonable these numbers are (a PEG under 1.5 is preferred) the more attractive I find a stock.
Using Fidelity.com, I try to compare the Price/Sales ratio to other stocks in the same industrial group. Hopefully, this also shows good 'value'.
Going back to Yahoo, I am interested in knowing the number of shares out short relative to the average trading volume of the stock (the short ratio). If there are a lot of shares out short (over 3.0 trading days), this is significant in a positive fashion imho, suggesting a possible short 'squeeze'.
Finally, I look at a point and figure chart to assess whether the stock generally appears to have price momentum. Simply put, does the chart look like the stock is moving higher, lower, or going nowhere.
I would like to briefly comment on my portfolio management. First of all, I would suggest starting a portfolio in "neutral". Which from my perspective means 50% in cash and 50% in equities. I believe an investor should know the maximum number of positions he/she would like to hold in their own portfolio. If one has goal of 20 positions, start at 10, drop down to 5 in a bearish environment, and go to a maximum 20 positions in a bull market.
I believe in allowing my own stocks to determine whether I am moving into cash or equities. Once at a maximum number of positions, all sales on good news go into cash. Otherwise, when I sell on "bad" news, I like to sit on my hands, so to speak, moving my portfolio towards cash. Good news for me is a partial sale on a targeted gain. This is my permission slip to add a new positions moving me closer to a maximum # in my portfolio.
Bad news consists of sales after either announcements of fundamental problems with a company, or declines in a stock price moving to a sale target. After a first purchase, I sell on an 8% loss. Otherwise after one sale on good news, I sell at break-even. After two or more sales on good news, I sell at 50% of the highest sale percentage gain.
Good news sales are at set intervals. I sell 1/6th of my holding at 30%, 60%, 90%, 120%, then by 60% intervals x 4, then by 90% intervals by 4, etc. These sales allow me to add a new position.
When I sell on bad news, I sit on my hands waiting for a sale on good news to replace that position. My only exception would be when I have reached my minimum # of positions.
Now that was a mouthful! I hope that clarifies my strategy. If you have any questions or comments, please feel free to leave them on the blog or email me at bobsadviceforstocks@lycos.com.
Bob
Sunday, 19 March 2006
"Looking Back One Year" A review of stock picks from the week of December 27, 2004

Hello Friends! Thanks so much for stopping by and visiting my blog,
Stock Picks Bob's Advice. As always, please remember that I am an amateur investor, so please remember to consult with your professional investment advisors prior to making any investment decisions based on information on this website.
One of the weekend tasks that I like to accomplish on the blog is to review picks from a year earlier. Last week I reviewed picks from December 20, 2004, this week, I am up to December 27, 2004. This analysis assumes a buy and hold strategy. In reality, I advocate and practice a more disciplined approach of selling losing stocks quickly and completely, and gaining stocks slowly and partially. Implementation of a strategy like this would result in actual results different than this review. However, for the sake of simplicity, this method gives us an overall idea of the stock performance.
Furthermore, this review is limited to a check of the current stock price and the latest quarterly earnings report. I give each stock a thumbs up or a thumbs down based on whether the latest earnings report demonstrates both increased revenue and earnings (thumbs up) otherwise the stock is given a 'thumbs down'.

On December 30, 2004, I
posted Dialysis Corporation of America (DCAI) on Stock Picks Bob's Advice when it was trading at $19.21. DCAI closed at $12.78 on 3/17/06, for a loss of $(6.43) or (33.5)%.

On February 13, 2006, DCAI
reported 4th quarter 2005 results. Operating revenues came in at $12.2 million, up from $11.8 million in the same quarter last year. Net income for the quarter was $594,000 or $.06/diluted share, compared with $762,000 or $.08/diluted share the prior year.

On December 31, 2004, I
posted Laserscope (LSCP) on Stock Picks Bob's Advice when it was trading at $35.99. LSCP closed at $21.01 on 3/17/06, for a loss of $(14.98) or (41.6)% since posting.
On February 23, 2006, Laserscope
reported 4th quarter 2005 results. Revenue for the quarter ended December 31, 2005, came in at $35.0 million, a 19% increase over fourth quarter 2004 revenue of $29.4 million. Net income for the quarter grew to $5.9 million or $.26/diluted share, compared with net income of $5.2 million or $.23/diluted share last year during the same period.
So how did we do during this week a little over a year ago. As is sometimes the case,
both of the stocks declined for an average loss of (37.6)%.
The evaluation shows that there is nothing magical about my stock picks. I do not bat 1.000, and sometimes the stock "picks" decline. Overall, I think that the picks on this blog have done quite well. But the possibility for loss must always be considered. Thus the need for loss limits like the 8% loss limit I utilize myself.
Thanks so much for stopping by! If you have any questions or comments, please feel free to email me at bobsadviceforstocks@lycos.com or simply leave your comments on the blog.
Bob
Newer | Latest | Older


