Stock Picks Bob's Advice
Saturday, 15 April 2006
A Reader Writes: "However related to selling: Can you tell me ???"
CLICK HERE FOR MY PODCAST ON SELLING STRATEGYHello Friends! Thanks for stopping by and visiting my blog
Stock Picks Bob's Advice. As always, please remember that I am an amateur investor so please remember to consult with your professional investment advisors prior to making any investment decisions based on this website.

I was checking my email today and received a nice letter from Conrad K. who wrote:
"Hello Bob :
Discovered your posts on podcast and have had a look at your web site.
Enjoyed your insight to trends of the market related to buying and selling
You have answered so many of my questions >> Thank you !
However related to selling : Can you tell me ???
Your talking about selling 1/6 Th at a 30% increase of the stock
and then after that at a 50% gain - 30% gains after that .
Question: ?
(1) are you talking about selling 1/6Th of the total amount of your shares ?
(1a. ) or 1/6 Th of the cash amount ( cost ) of the shares ?
(2) then after that at 50% gain >
Do you recalibrate the 1/6 Th from the new number to determine the amount to sell ?
Example $ 3,000 worth of stock >> 1/6 = $500 >>>>>>>>>
Now you have $2,500 invested >> ?? so do you now find 1/6Th. of that "NEW AMOUNT " ($2,500) ? and sell that ?
and so on ? do you keep recalibrating the amount of shares to sell
I guess I just don't get it ? do I sell 1/6 Th of the total shares I bought ? or the money amount they cost ? >>
And then do I recalibrate the new number after each sale ? or just use the same "Starting Number "
Somehow I have confused the issue ?
Can you please explain ? as I like the 1/6 Th idea however the finer points of it are not understood as to the amounts to sell ?
Thanks Conrad K."
First of all, thanks so much for writing! If you or any other readers or listeners to my
Stock Picks Bob's Advice Podcast have any other questions, please feel free to leave them on the blog or email me at bobsadviceforstocks@lycos.com.
Let me try to go over this selling question. Please be aware that I am sharing with you my own personal strategy. There may be other and better ways for dealing with gains, but this is indeed my approach.
There are two times that I sell stocks. I divide these events as being either on "good news" or on "bad news". Good news events are sales after the stocks I own appreciate to targeted sale points and I go ahead and sell a portion of my holdings at that point.
First of all my targeted sale points are not exactly what you are writing, so please let me clear that up. On the upside, I sell stocks at the following appreciation points from my original purchase price: 30, 60, 90, and 120%, then at 180, 240, 300, 360% and then at 450, 540, 630, 720, and increasing the interval by 30% after each group of four sales. Most of those sale points are theoretical, although I do have one stock that has hit a 450% appreciation level.
Next the question of how much I sell at those points. As I have pointed out elsewhere, originally I sold 1/4th of my remaining shares. I have subsequently moved to 1/6th of my remaining shares. If I need to round out this lot, then I round down to sell less instead of more.
I don't do this in dollar amounts. I simply look at the remaining number of shares of that position and sell 1/6th of that number each time. NOT 1/6th of my original purchase (which I would thus run out of shares after 6 sales), but rather 1/6th of the REMAINING shares. I hope that is clear now.
It is easier to calculate the sale points using the original purchase PRICE of the stock because the VALUE of your holdings keeps changing making the calculations based on $ amounts confusing. I can see why you are having some problems.
Let's go back to your example. Instead of just saying $3,000 of stock, let's assume this purchase was for 300 shares of a stock at $10 originally. The first sale point will be when the stock appreciates 30%. Thus, the sale point will be at $10 x 1.30 = $13. You will sell 1/6th of your shares in this hypothetical case or 50 shares of stock. This will be worth $13 x 50 = $650. Leaving you 250 shares @ $13 = $3,250.
Your next sale will be, under my strategy, when the stock price hits a 60% gain, again selling 1/6th of the remaining shares. Let's work this out: the stock appreciates to a 60% gain, or $10 x 1.60 = $16. You now have 250 shares. You plan on selling 1/6th of your shares. 250/6 = 41.66. I round it to 41 shares @ 16= $656 worth of stock. How much do you have left? 250 - 41 =209 @ $16 = $3,344.
The same disciplined selling strategy should continue at all of the appreciation targets with the next target at a 90% appreciation level, etc.
You can see how the stock value
is slowly growing. I haven't worked everything out, but selling 1/6th of the remaining shares at appreciation points specified is working for me.
Let me review also my selling on what I call "bad news". First of all after an initial purchase, I sell ALL of my remaining shares if the stock drops 8% in price from my purchase price. After I have sold one time after "good news", that is because the stock had reached the 30% appreciation level and I sold 1/6th of my holding, I then move the sale point up to the purchase price, to the break-even point. After having sold the stock more than one time, perhaps for example three sales with the last being at a 90% appreciation level, then I allow the stock to retrace to 50% of the highest sale point...that is in this example would be back to the 45% appreciation level, and then I sell ALL of my remaining shares.
I hope this explains for you my selling strategy. If you or anyone else has any questions, please feel free to leave your comments on the blog or email me at bobsadviceforstocks@lycos.com.
Bob
Posted by bobsadviceforstocks at 5:33 PM CDT
|
Post Comment |
Permalink
Updated: Saturday, 15 April 2006 11:38 PM CDT
Friday, 14 April 2006
"Looking Back One Year" A review of stock picks from the week of January 24, 2005

Hello Friends! Thanks so much for stopping by and visiting my blog,
Stock Picks Bob's Advice. As always, please remember that I am an amateur investor, so please remember to consult with your professional investment advisors prior to making any investment decisions based on information on this website.
I hope you all are having a nice weekend and that those of you that celebrate Easter, have a wonderful holiday with your family! One thing that I like to do on weekends is to review past stock picks right from this blog. I am a bit behind of my year out review, and in fact, am reviewing stocks from a trailing 60 week period.
This review assumes a buy and hold strategy. In fact, I practice a different strategy involving selling stocks quickly and completely if they decline 8% and selling stocks partially and slowly as they appreciate to targeted gains. For the purpose of review, assuming the buy and hold is easiest for me to do; however, please be aware that different investment strategies will certainly affect investment returns.

On January 26, 2005, I
posted SS&C Technologies (SSNC) on Stock Picks Bob's Advice when the stock was at $21.65. SSNC was acquired by Sunshine Acquisition Corporation which is affiliated with The Carlyle Group. As
reported on the SS&C website:
"...On July 28, 2005, SS&C entered into a merger agreement with Sunshine Acquisition Corporation and its wholly owned subsidiary, Sunshine Merger Corporation. Under the terms of the merger agreement, SS&C's stockholders are entitled to receive $37.25 per share in cash, without interest."
Thus, based on the acquisition price of $37.25, I had an appreciation of $15.60 or 72.1% since posting.

The other stock discussed on Stock Picks that week was Affymetrix (AFFX) which was
posted on Stock Picks Bob's Advice on January 27, 2005, when the stock was trading at $40.62. AFFX closed at $32.96 on April 13, 2006, for a loss of $(7.66) or (18.9)%.

On January 26, 2006, Affymetrix
reported 4th quarter 2005 results. Revenue for the quarter ended December 31, 2005, came in at $111.5 million, a 3.5% increase over the $107.7 million reported in the same quarter in 2004. Net income, however, came in at $24.8 million, down from $27.1 million the prior year. On a per share basis, this worked out to $.35/diluted share in the 4th quarter of 2005, compared with $.41/share in the same period in 2004.
So how did we do with these two stocks? Assuming an equal dollar amount of each stock, we can average the percentages to get an average performance. This works out to an average of a gain of 26.6% for the two stock picks.
Thanks again for stopping by! If you have any questions or comments, please feel free to leave them on the blog or email me at bobsadviceforstocks@lycos.com. Please also be sure to visit my
Stock Picks Bob's Advice Podcast Site.
Happy Easter!
Bob
A Reader Writes "...what your thoughts are for GME at these prices."
Hello Friends! Thanks so much for stopping by and visiting my blog,
Stock Picks Bob's Advice. As always, please remember that I am an amateur investor, so please remember to consult with your professional investment advisors prior to making any investment decisions based on information on this website.
I had a nice email from Dave last week who inquired about my thoughts about some of his holdings. Dave wrote:
"hi,
i was curious what your thoughts are for GME at these prices. i tend to buy into stocks that i am willing to hold 3 yrs if neccessary. i currently hold mo, lm, mrh and gme.
tks,
dave"
Well first of all, thank you for writing! I haven't looked at GameStop (GME)recently, so this is a nice time to take a look at this company that I have reviewed previously on Stock Picks Bob's Advice. In fact, I
posted GameStop on Stock Picks on November 14, 2004, when it was trading at $23.50. With GameStop closing Friday, April 13, 2006, at $46.85, this represents a gain of $23.36 or 99.4% since posting. I do not have any shares nor do I own any options on this stock.

But that wasn't you question was it? You didn't ask me if my stock pick has done well, but how is GME doing
now? Well, let's take a fresh look at this company!
First of all, what do they do? According to the
Yahoo "Profile" on GameStop, the company
"...operates as a retailer of video game and entertainment software worldwide. It has approximately 4,200 retail stores throughout the United States, Australia, Canada, Denmark, Finland, Germany, Italy, Ireland, New Zealand, Norway, Puerto Rico, Spain, Sweden, Switzerland, and the United Kingdom. GameStop sells new and used software, hardware, and game accessories for the PC and next generation video game systems from Sony, Nintendo, and Microsoft."
My first step at looking at a company remains looking at the latest quarterly results. On March 21, 2006, GameStop
reported 4th quarter 2005 results. For the quarter ended January 28, 2006, sales grew 135.2% to $1.7 billion in the quarter compared to $708.7 million in sales in the prior year same quarter. This FABULOUS result needs to be taken with a 'grain of salt' because most of the gain was related to the addition of Electronic Boutique store sales, a chain that was acquired in October, 2005. More revealing, perhaps, is the same store sales figure which showed a
decrease of 0.3% during the quarter. Earnings came in at $85.0 million, up from $34.5 million the prior year same period. Diluted earnings per share came in at $1.10/share in the quarter, up strongly from the $.64/diluted share in the same period last year. This exceeded prior guidance from the company.
So the company managed an apparently very successful acquisition with increased sales AND earnings although same-store sales actually declined. IMHO, it will be important to observe the same store sales numbers. The company cannot continue to report great sales and earnings growth long-term, unless the same store sales figures improves.
To assess longer-term results, let's take a look at the
Morningstar.com "5-Yr Restated" Financials on GameStop.
First of all revenues have grown nicely from $1.35 billion in 2003 to $1.84 billion in 2005 and $2.02 billion in the trailing twelve months (TTM). Earnings have been a bit less impressive, at least as reported on Morningstar.com (which apparently does not take into consideration the latest quarter), with $1.06 reported in 2004, dropping to $1.05 in 2005 and back up to $1.14 in the TTM. These numbers should look nicer as soon as the site is updated (?) including the latest quarter (?). The number of shares is actually decreasing slightly with 56 million in 2004, 55 million in 2005, and 52 million in the TTM.
Free cash flow which came in at $53 million in 2003, dropped to $7 million in 2004, rebounded to $48 million in 2005 and now is at a negative $(3) million in the TTM.
The balance sheet is satisfactory with $99 million in cash and $309.1 million in other current assets. Balanced against the $281.9 million in current liabilities, gives us a 'current ratio' of 1.45. This is close to the arbitrary cut-off of 1.5 for determining a 'healthy' balance sheet, insofar as current assets and liabilities is concerned. The company also has a modest $59.7 million in long-term liabilities as reported on Morningstar.com.

And how about some valuation numbers on this stock?
Reviewing the
"Key Statistics" on GameStop from Yahoo, we can see that the market capitalization is a large cap $3.41 billion. The trailing p/e isn't bad at 29.05, and the forward p/e (fye 28-Jan-08) looks nicer at 18.67. The earnings are growing fast enough (5 yr expected) to give us a PEG of 1.10.
Taking a look at the
Fidelity.com eresearch website on GME, we find that GameStop is in the "Electronics Stores" industrial group. Within this group, GME is actually near the top in valuation, with Best Buy (BBY) leading the way with a ratio of only 2.0. This is followed by GameStop (GME) with a ratio of 0.9, Radio Shack (RSH) with a ratio of 0.5, Circuit City (CC) with a ratio of 0.4, and Tweeter Home Entertainment (TWTR) at the bottom of the group with a Price/Sales ratio of only 0.2.
Reviewing some more data from the Yahoo "Key Statistics" page, we find that there are 72.80 million shares outstanding with 64.96 million that float. Currently there are 10.91 million shares out short representing 16.5 trading days of volume (the short ratio). This is as of 3/10/06, and is up from the prior month's 10.2 million share short interest. This is significant to me as I use a 3 day short ratio to determine significance. In the event of positive news, there could be a short squeeze on this stock. On the other hand, if negative news is released, as so many of these short-sellers must suspect, the stock may drop but these short-sellers will likely be buyers to support the price. In general, a large short-interest is bullish, but that is in the face of a large percentage gain when I am reviewing stocks.
And what about the latest chart? Does it look encouraging?
Reviewing the
"Point & Figure" chart on GameStop from StockCharts.com:
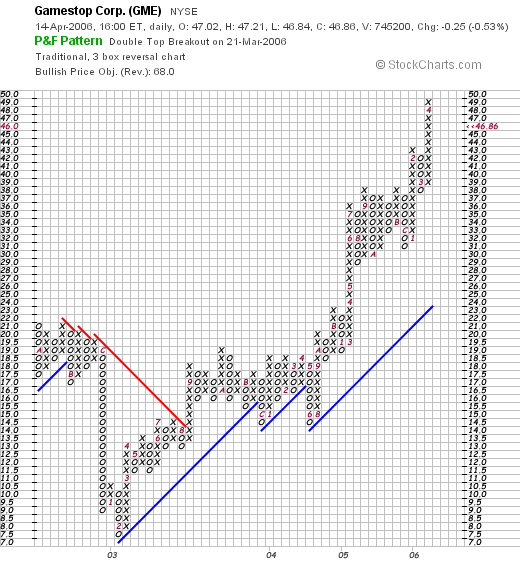
We can see that the price of GameStop stock actually broke down between September, 2002, when it was trading at $21/share, until February, 2003, when it bottomed at $7.50/share. The stock subsequently has been moving strongly higher to its current level of $46.86. The chart looks strong if a bit 'over-extended' (trading above its 'blue' support line) to me.
So what do I think?
Do I think the stock is a good buy at this price? Perhaps. The latest quarterly result was fabulous with what appears to be an excellent synergy between GameStop and the Electronics Boutique acquisition. The only disturbing thing on that report was the negative same store sales numbers, suggesting a declining retail report. This is overshadowed by the gigantic increase in overall sales and earnings, but is still of concern to me.
The Morningstar.com report looks nice, except for the negative free cash flow on the latest reporting period available on that page. I would monitor that number closely also.
The balance sheet is o.k., but is a bit heavy on current liabilities. Not much, but a little.
Valuation-wise, the company has a nice PEG, and the Price/Sales figure, while low absolutely, is still a bit high compared to other companies in the same industrial group. Finally, the chart looks very strong.
So would I buy at this figure. Probably not. I am stuck on that same-store-sales figure in the latest quarterly report and the negative free cash flow figure on the Morningstar page. When these two numbers turn around, which they may very well do, then I would be a strong advocate of this stock if it were found on the list of top % gainers.
I hope that helps :). Please remember that I am truly an amateur investor, so I use my basic analysis approach in trying to sort out good stocks for investment from others. I have written up GME in the past, it has performed well for me since on the blog, and I wish you the best of luck with your investments as well. Please let me know how they all work out for you.
If you have any comments or questions, please feel free to leave them on the blog or email me at bobsadviceforstocks@lycos.com. Please also remember to come visit my Stock Picks Bob's Advice Podcast Site, where you can hear me talk about many of the same stocks I blog about here!
Hope you all have a very Happy Easter!
Bob
Posted by bobsadviceforstocks at 11:05 AM CDT
|
Post Comment |
Permalink
Updated: Friday, 14 April 2006 12:05 PM CDT
Thursday, 13 April 2006
SanDisk (SNDK) "Reviewing a Recent Purchase for my Trading Account"
CLICK HERE FOR MY SANDISK PODCASTHello Friends! Thanks so much for stopping by and visiting my blog,
Stock Picks Bob's Advice. As always, please remember that I am an amateur investor, so please remember to consult with your professional investment advisors prior to making any investment decisions based on information on this website.

Earlier this morning I purchased 120 shares of SanDisk (SNDK) at $61.95/share. As I am writing, SNDK is trading at $61.952, up $2.482 or 4.17% on the day. This morning, that was enough to get the stock on the
list of top % gainers on the NASDAQ, but this afternoon, with the NASDAQ improving, SanDisk no longer makes the list of top % gainers. With this post, I wanted to briefly review the current information on this company that led me to pick this stock for my trading portfolio.
First of all let me review again why I was in the market to be purchasing a new position. Generally, my trading system dictates that I can only purchase a new position on "good news", which for me means selling a portion of one of my existing positions at a gain. Instead of selling a portion of a holding, I unloaded by entire position in Sybron Dental (SYD) after an acquisition of the company by Danaher was announced. So instead of adding a new position, I was actually in the market today to replace that position with a different one.
SanDisk (SNDK) is actually an old favorite of mine here. In fact, I first
posted SanDisk (SNDK) on Stock Picks Bob's Advice on July 15, 2004, when the stock was trading at $24.96. On October 21, 2005, I
"revisited" SanDisk on Stock Picks Bob's Advice when it was trading at $56.45. And today, I finally managed to purchase some shares with the stock trading at $61.95.
Since it has been less than a year since I last did an in depth review, I shall try to make this discussion a bit briefer.
1) What does the company do? According to the
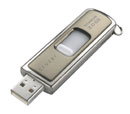
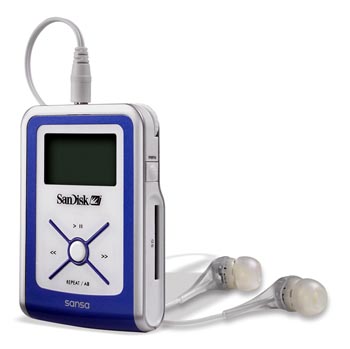
Yahoo "Profile" on SanDisk, the company
"...engages in the design, development, and market of flash storage card products used in various consumer electronics worldwide. Its products include flash cards, Universal Serial Bus, flash drives, and digital audio players. The company?s flash storage allows data to be stored in a compact format that retains the data for an extended period of time after the power has been turned off. Its products are used in digital cameras, feature phones, and other digital consumer devices."
 2) And how did they do the latest quarter?
On January 26, 2006, SanDisk
reported 4th quarter 2005 results. Revenues grew 37% to $751 million from $549 million in the same period last year. Net income came in at $134 million, up strongly from $78 million in the same quarter a year ago. Earnings per share grew 62% year-over-year to $.68 from $.42/share the prior year same period.
3) What does their Morningstar.com page look like?Reviewing the
"5-Yr Restated" financials on SNDK from Morningstar.com, we can see that revenue, which dipped from $.6 billion in 2000 to $.4 billion in 2001, then went on to 'skyrocket' to $1.8 billion in 2004 and $2.1 billion in the trailing twelve months (TTM).
Earnings also dipped the same time as revenue from $2.06 in 2000 to a loss of $(2.19)/share in 2001. Since 2001, earnings have turned profitable and have grown strongly to $1.44/share in 2004 and $1.74/share in the TTM.
The company has apparently been issuing a moderate number of shares to finance activities, with 133 million shares outstanding in 2000, increasing to 164 million in 2004 and 184 million shares in the trailing twelve months.
Free cash flow, while not perfectly significant, has been positive the past several years with $90 million reported in 2002, increasing to $102 million in 2004 and $316 million in the TTM.
The balance sheet is solid with $1.66 billion in cash and $.6 billion in other current assets. This gives us a current ratio of about 4 when compared with the $.5 billion in current liabilities. In fact, the cash alone can pay off both the current and the long term liabilities combined more than 3x over.
4) What about some valuation numbers on this stock?Looking at
Yahoo "Key Statistics" on SanDisk, we find that the market cap is a large cap $12.01 billion. The trailing p/e is moderate at 30.92 with a forward (fye 01-Jan-08) p/e of only 21.87. Thus, the PEG is a reasonable 1.25. The Price/Sales is 5.0. Out of the 189.7 million shares that float, 7.6% are out short representing a short ratio of 1.4. This doesn't look very significant. The stock last split 2:1 on 2/19/04.
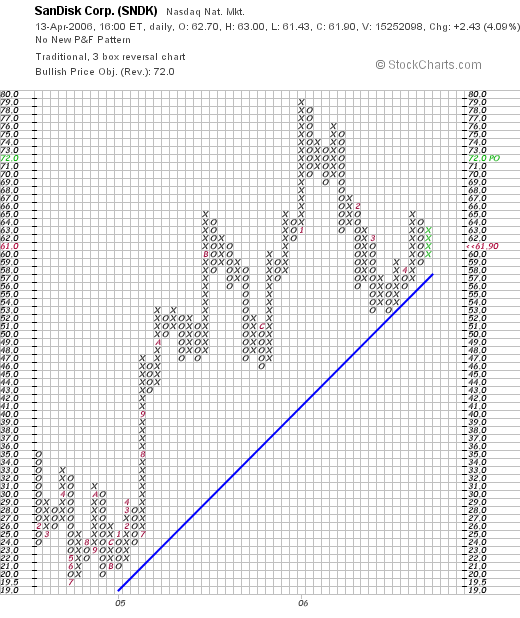
5) What about a chart?Looking at a
"Point & Figure" chart on SanDisk from StockCharts.com, we can see that the stock price actually declined from $35 in January, 2004, to a low of $20 in September, 2004, until moving higher to peak at $79 in January, 2006. More recently, the stock has pulled back to the $53 level, where it bounced twice off of this level, to move higher to the $65 range. The stock is staying above its support line, and now appears reasonably valued to me.
So what do I think? After reviewing SanDisk twice before on this blog, I was certainly well-acquainted with the company. Thus, after selling my shares of Sybron (SYD), when I saw this stock on the list of top gainers, I was prepared to purchase some shares.
Thanks so much for visiting! If you have any comments or questions, please feel free to leave them on the blog or email me at bobsadviceforstocks@lycos.com. And please be sure to visit my Podcast Site for Stock Picks Bob's Advice.
Bob
Posted by bobsadviceforstocks at 1:44 PM CDT
|
Post Comment |
Permalink
Updated: Thursday, 13 April 2006 11:41 PM CDT
"Trading Transparency" SanDisk (SNDK)
Hello Friends! Thanks so much for stopping by and visiting my blog,
Stock Picks Bob's Advice. As always, please remember that I am an amateur investor, so please remember to consult with your professional investment advisors prior to making any investment decisions based on information on this website.
As I posted yesterday, I unloaded my Sybron Dental (SYD) shares after an acquisition of the company was announced. As I noted, I would definitely describe this as a sale on "good news" so this 'entitled' me to replace this position. I wouldn't go so far as saying it entitled me to add an additional position, but this wasn't a sale at a loss.
A few moments ago, looking through the lists of top % gainers, I came across SanDisk (SNDK) a stock that I have reviewed elsewhere on this blog, and reviewing the current numbers, appeared to be a good fit for my trading strategy. I purchased 120 shares of SNDK at $61.95 in my trading account.
I shall try to give you an update on this stock later today or tomorrow. Thanks again for visiting. If you have any comments or questions, please feel free to email me at bobsadviceforstocks@lycos.com, or just leave them on the blog. Be sure to visit my
Stock Picks Bob's Advice Podcast Page where you can listen to me discuss many of the same stocks I write about on my blog.
Bob
Wednesday, 12 April 2006
"Trading Transparency" Sybron Dental (SYD)
Hello Friends! Thanks so much for stopping by and visiting my blog,
Stock Picks Bob's Advice. As always, please remember that I am an amateur investor, so please consult with your professional investment advisors prior to making any investment decisions based on information on this website.
A few moments ago, I sold my remaining 113 shares of Sybron Dental (SYD) at $46.92. These shares were acquired 11/18/03 at a cost basis of $25.84/share. Thus I had a gain on Sybron of $21.08 or 83.0% on these remaining shares. This was my third sale of Sybron, having sold portions twice previously. Instead of waiting for a 90% gain, and instead of only selling a portion of my shares, I decided to sell all of my remaining shares after I read of the
acquisition of SYD by Danaher (DHR) at $47.00/share.
Some might suggest I wait to see if a better price comes in, but with the impending purchase, it seemed prudent to sell the remaining shares in case the deal fell through.
Since this sale was on 'good news' I shall be replacing this position; but I shall not adding an additional position to my portfolio at this time.
Thanks so much for visiting! If you have any comments or questions, please feel free to email me at bobsadviceforstocks@lhycos.com or just leave your comments on the blog.
Bob
Sunday, 9 April 2006
A Reader Writes "...post all of the stocks you have picked or holding them in one place....?"
Hello Friends! Thanks so much for stopping by and visiting my blog,
Stock Picks Bob's Advice. As always, please remember that I am an amateur investor, so please remember to consult with your professional investment advisors prior to making any investment decisions based on information on this website.
It is always nice to get a comment on a post of mine or an email with a question. On my Hibbett post, that I wrote today, Alice raised a good point. She stated:
" Bob
Thanks for analysis of your stocks one after another. I am glad you have had great returns on most of them. Can I request you to post all the stocks you have picked or holding them in one place and make available to your blog readers. Can you also suggest the stocks you have recently picked.
Regards
Alice"
First of all, thank you for writing! I am glad you appreciate my analysis. I confess, that my blog reflects my amateur status, it looks much like my desk at home :).
I am way behind keeping up with an index that I was manually compiling. In fact, when I want to know if I have written up a stock, I simply Google "Stock Picks xxxx" where XXXX represents the stock symbol. Generally that points me to the entry right away.
Insofar as my own trading portfolio, I spent a little time and just upgraded my previous summary. I put this in my Jubak's Refugee Site at MSN where I have been commenting on my own strategy.
Here is what I wrote this evening regarding my trading portfolio:
Sent: 4/9/2006 12:07 AM
Hello Jubak Refugees,
It has been a couple of months since my last update and I promised you that I would be letting you all know how my approach has been working. I continue to add $250 to my account monthly, still have margin interest to pay, and am withdrawing $550/month to purchase my personal car. In addition, I just sent in a request to pull off $5000 to fund this year's IRA contribution. So that will all affect the value of the account but not the unrealized and realized gains.
The account information is as of the close of trading Friday, April 7, 2006.
There are currently 20 positions in my account. My maximum number of holdings is still planned at 25.
The account net worth is $80,291.84. I have a 62.74% margin equity percentage; my margin securities market value is at $127,967.33, and my margin debit balance stands at $47,675.49.
Current positions (# shares, date of purchase, closing price, cost basis):
Barnes Group (B) (180 shares,2/16/06, $41.600, $39.15)
Dynamic Materials (BOOM) (200 shares, 12/5/06, $38.39, $28.32)
Coach (COH) (102 shares, 2/25/03, $35.35, $8.33)
Cytyc (CYTC) (225 shares, 1/29/04, $27.83, $14.86)
Genesco (GCO) (200 shares, 5/26/05, $41.33, $34.40)
Helix Energy Solutions (HELX) (142 shares, 11/3/04, $37.91, $19.10)
Hibbett Sporting Goods (HIBB) (84 shares, 3/6/03, $30.68, $6.50)
Healthways (HWAY) (128 shares, 6/18/04, $50.02, $23.53)
JLG Industries (JLG) (320 shares, 1/12/06, $30.56, $25.81)
Jos A Bank (JOSB) (187 shares, 4/4/05, $43.63, $25.59)
Kyphon (KYPH) (150 shares, 5/20/05, $38.70, $29.21)
Morningstar (MORN) (167 shares, 11/22/05, $43.03, $32.57)
Packeteer (PKTR) (400 shares, 1/27/06, $12.24, $11.94)
Quality Systems (QSII) (88 shares, 7/28/03, $30.73, $7.75)
ResMed (RMD) (180 shares, 2/24/05, $42.96, $29.87)
Starbucks (SBUX) (59 shares, 1/24/03, $37.86, $11.40)
SRA International (SRX) (320 shares, 2/1/05, $37.12, $29.82)
Sybron Dental (SYD) (113 shares, 11/18/03, $42.41, $25.84)
Meridian Bioscience (VIVO) (210 shares, 4/21/05, $26.97, $11.13)
Ventana Medical Systems (VMSI) (225 shares, 4/16/04, $42.11, $23.47)
Since 2/6/06, the following transactions have occurred:
On 2/7/06, I sold my 160 shares of FMC Technology (FTI), I sold 33 shares of Morningstar (MORN) on 2/16/06, and I received 37 shares of JOSB as part of a stock distribution on 2/16/06. On 3/2/06, I sold my 240 shares of AngioDynamics (ANGO) at $23.506. On 3/27/06 I received 44 shares of QSII as part of a stock split, and on 3/28/06, I received 160 shares of JLG also as part of a split of the stock. On 4/5/06, I sold my 180 shares of St. Jude Medical (STJ) at $36.23.
As of 4/7/06, the account has realized gains totalling $1,761.43, consisting of a net short-term loss of $(183.53) and a net long-term gain of $1,944.96.
The account has an unrealized gain totalling $43,461.95.
I hope this update is once again helpful, and if you are interested in reading more about the stocks I own and my investment philosophy, please feel free to come and visit my blog, Stock Picks Bob's Advice at https://bobsadviceforstocks.tripod.com/bobsadviceforstocks/
Bob
Anyway, I don't think I quite answered your request. Please recognize that I am an amateur and already spend way too many hours on this blog. If this becomes more successful, and I can get some advertising on the blog or other source of income, it might pay to address your concerns. Meanwhile, come back and visit often :), and browse through the blog using the "back" button.
Bob
Saturday, 8 April 2006
Hibbett Sporting Goods (HIBB) Weekend Trading Portfolio Analysis
CLICK HERE FOR THE PODCAST ON HIBBETT
Hello Friends! Thanks so much for stopping by and visiting my blog,
Stock Picks Bob's Advice. As always, please remember that I am an amateur investor, so please remember to consult with your professional investment advisors prior to making any investment decisions based on information on this website.
I try to do several things simultaneously on this website. First of all, I am looking to find stocks that fit my criteria for investment. Those stocks with good momentum, fundamentals, valuation, and a reasonable chart. To determine how these selections are doing I try to review past stock selections each weekend as I did earlier today.
On top of this, I am also trying to build a real trading portfolio based on these same criteria and portfolio management strategy. In my attempt to be as straight-forward and transparent as possible, I post my actual trades as soon as I can after I do them, and also have started reviewing my individual stocks with you so that you can get a better feel for my own actual portfolio. I started this about a year ago, and was reviewing my holdings weekly. However, with only 20 positions now, that would mean reviewing each stock more than once/year. Thus, even with a maximum of 25 positions, I am going to continue to try to review these stocks; however, I am going to try to do this every
other week! Two weeks ago I reviewed my Genesco holding. Going alphabetically, I am up to Hibbett (HIBB), one of the strongest stocks in my portfolio.

I currently own 84 shares of Hibbett Sporting Goods (HIBB) which closed at $30.68 on April 6, 2006. These shares were acquired on March 6, 2003, with a cost basis of $6.50/share giving me a gain of $24.18/share or 372% since purchase.
As is my strategy, I have been selling portions of my holdings as the stock price appreciates. Unfortunately, when I initially set up my trading strategy, I was selling 1/4 positions of the remaining shares, and my positions have been dwindling in size initially even as I took my profits. Realizing that 1/4 was too large a position to be selling, I have kept my same sale points, but now sell 1/6th of my remaining positions at the same intervals.
In case you are new to my blog, or don't recall my selling strategy, let me remind you that first of all, after an initial purchase, I will sell all of my shares quickly at an 8% loss on the downside. Otherwise, I sell my shares slowly, selling 1/6th of my holding at the following grouped targets (I group by four targets): 30, 60, 90, 120% gains, then 180, 240, 300, and 360%, then 450, 540, 630, 720%, etc.
After having sold a stock once at a 30% targeted gain, I sell all of my shares at break-even. Otherwise, I sell all of my shares if the stocks retrace 50% of the highest sale-at-a-gain point. That is, if I have sold portions three times, with the last sale being at 90% appreciation, then I would sell all of my remaining shares if the stock retraces to a 45% appreciation level.
But let's get back to Hibbett.

After puchasing 100 shares in January, 2003, and another 100 shares in February, 2003, at approximately $21/share at that time, I started selling portions of my shares as the stock appreciated. I sold 50 shares 5/30/03, 50 shares 9/4/03, 40 shares 10/15/03, 20 shares 4/5/04, 42 shares 2/4/05, 32 shares 5/20/5, 24 shares 6/16/05, and finally 27 shares 11/21/05. From my original approximately $4,500 investment in HIBB, I have sold shares 8 times with proceeds totalling $8,510.41, with a total of realized gains of $4645.15. I still have $2,577.12 worth of Hibbett Stock in my Trading Portfolio.
Since my last sale was my 8th sale, this would have been at the 450% appreciation point. The stock is trading under this level now. If I were to be selling 1/6th of my position, I shall be waiting for the 540% appreciation level (!), or 6.4 x $6.50 = $41.60. On the downside, I shall be unloading all of my Hibbett shares if the stock declines to 50% of my highest sale point or at a 225% gain, 3.25 x $6.50 = $21.13/share.

But let's stop talking about
me and let's talk about Hibbett. Let's see if the stock still looks like it belongs in this blog.
First of all, their business. According to the
Yahoo "Profile" on Hibbett, the company
"...operates sporting goods stores in small to mid-sized markets in the southeast, mid-atlantic, and midwest United States. The company, through its stores, offers athletic equipment, footwear, and apparel. As of February 2, 2006, it operated 549 Hibbett Sports stores, including smaller-format Sports Additions athletic shoe stores and larger format Sports & Co. superstores."
Let's check and see if there is any news of significance on the company.
The latest news appears to be the
4th quarter 2006 earnings report. Reported on March 9, 2006, the company reported:
"Net sales for the 13-week period ended January 28, 2006, increased 12.8% to $120.8 million compared with $107.1 million for the 13-week period ended January 29, 2005. Comparable store sales increased 2.5% in the fourth quarter of fiscal 2006. Net income for the fourth fiscal quarter increased 21.7% to $9.9 million compared with $8.1 million in the fourth fiscal quarter of last year. Earnings per diluted share increased 26.1% to $0.29 compared with $0.23 per diluted share in the prior year."
So from my perspective this was a satisfactory report. Revenue was up nicely, earnings were solid, but the same store sales gain of 2.5% is a bit anemic and I suspect that is why the stock price is currently consolidating instead of continuing to charge higher.
How about longer-term?
Looking at the
Morningstar.com "5-Yr Restated" financials on HIBB is simply drop-dead gorgeous. This is a textbook example of what I am looking for in a stock. I mean talking about having all of your ducks in a row!
Revenue has steadily grown from $210 million in 2001 to $378 million in 2005 and $427 million in the trailing twelve months (TTM). Earnings have also been steadily growing from $.32/share in 2001 to $.71/share in 2005 and $.92/share in the TTM. Shares outstanding has also been fairly steady with 33 million in 2001, increasing to 35 million by 2005 and 36 million in the TTM.
Free cash flow? Also perfect imho. With $11 million in 2003, increasing to $33 million in 2005 and $35 million in the TTM.
What about the Morningstar.com reported balance sheet? Calculating the "current ratio", comparing the total current assets to the current liabilities, gives us a total of $155.2 million in current asets, balanced against $56.7 million in current liabilities--almost a current ratio of 3. The current assets can easily pay off the total combined liabilities of $70 million, more than two times over.

What about some valuation numbers on this stock?
Reviewing the
Yahoo "Key Statistics" on Hibbett, we find that HIBB is a mid-cap stock with a market capitalization of $1.1 billion. The trailing p/e is a moderate 31.37, with a forward p/e (fye 28-Jan-08) of only 23.42. Calculating the PEG based on the 5 Yr Expected growth, gives us a PEG of only 1.19. Thus, valuation by this measure isn't bad at all.
According to the
Fidelity.com eResearch website, Hibb is the 'priciest' of the stocks in the "Sporting Goods Stores" industrial group, with a Price/Sales ratio of 2.5. This is followed by Golf Galaxy (GGA) at 1.5, Dick's Sporting Goods (DKS) at 0.8, Big 5 Sporting Goods (BGFV) at 0.5, and Sports Authority (TSA) at 0.4. No bargain by this parameter!
Finishing up with Yahoo, we find that there are 35.71 million shares outstanding with 35.47 million of them that float. Currently there are 1.62 million shares out short (3/10/06) representing 4.60% of the float, or 7.2 trading days of volume. This number, if I use my arbitrary 3 day cut-off, looks significant to me and on any good news, the short-sellers could be subject to a bit of a squeeze as they scramble to cover. However, on the other hand, a heavy dose of short-sellers suggest investors who believe the stock should be trading lower.
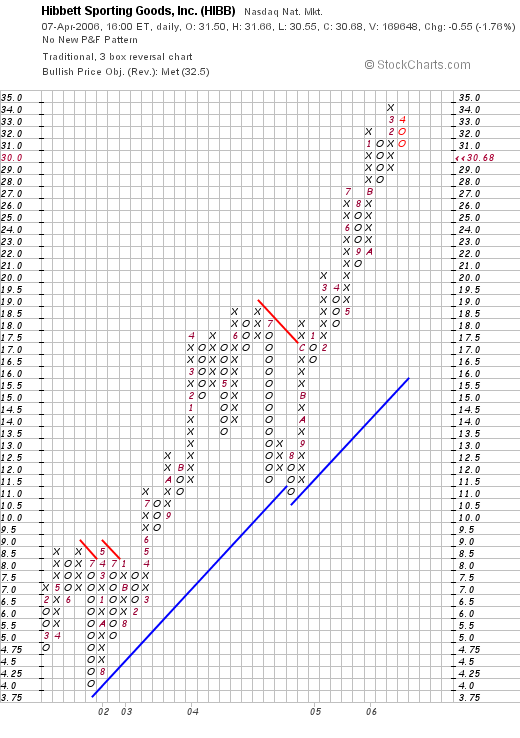
What about a chart? Looking at a
"Point & Figure" chart on Hibbett from StockCharts.com, we can see an absolutely GORGEOUS graph of the stock which after some consolidation in July, 2001, climbed almost perfectly from $4.00 level to the current $30.68 mark. The stock really hasn't consolidated as much as I thought! There isn't much weakness on this graph at all.
So what do I think? Well I sure am glad I own this stock! Unfortunately, my sales have been a bit too large and my position has dwindled a bit since my original purchase. Hopefully, with 1/6th sales in the future, the positions will be able to increase in size as they spin off their profits.
How about the stock? Well, everything looks nice except for two points I should review: the Price/Sales ratio is indeed a bit steep for its group and the same store sales number at 2.55% is a tad anemic but then again the entire retail market appears a bit weak. I like their position in small towns across the south-east as they shadow the Wal-Mart stores. There appears to be a lot of room for them to continue to expand this concept.
Thanks so much for stopping by and visiting! I hope I wasn't too verbose today, but then again, I enjoy discussing things with you and sometimes it takes a few words to get a point across :).
If you have any comments or questions, please feel free to leave them on the blog or email me at bobsadviceforstocks@lycos.com. Please be sure to visit my Bob's Advice Podcast Website! Have a great weekend!
Bob
"Looking Back One Year" A review of stock picks from the week of January 17, 2005
Hello Friends! Thanks so much for stopping by and visiting my blog,
Stock Picks Bob's Advice. As always, please remember that I am an amateur investor, so please consult with your professional investment advisors prior to making any investment decisions based on information on this website.
On weekends, I try to get around to reviewing past stock picks from this blog. I started out reviewing a year out, but after missing a few weeks over the course of the last couple of years, I am now down to reviewing stocks that were posted approximately 60 weeks earlier. This review assumes a "buy and hold" strategy; in fact, I sell my losing stocks quickly and completely, and my gaining stocks slowly and partially. This actual trading strategy definitely changes the results obtained from a buy and hold approach.

During the week of January 17, 2005, I made only one stock "pick" CheckFree (CKFR), a stock that I also recently
revisited in depth. I first
posted CheckFree on Stock Picks Bob's Advice on January 21, 2005, when it was trading at $38.82. CKFR closed at $52.53 on April 7, 2006, for a gain of $13.71, or 35.3% since posting.

On January 24, 2006, CheckFree
announced 2nd quarter 2006 results. Total revenue came in at $215.9 million up $30.1 million or 16.2% from the $185.8 million reported in same quarter the prior year. Net income came in at $33.8 million, up $20.7 million, from the $13.04 million reported the prior year same period. This was a 159% increase in net income. On a diluted per share basis, this worked out to $.36/diluted share, up $.22 or 157% over the $.14/share reported in the same period the prior year. On top of this, the company raised full-year guidance. A solid report!
So how did I do that week? Well I only discussed a single stock but it sure was a great pick! The single stock showed a 35.3% gain since posting. Too bad I don't own any shares :(.
Anyhow, that's the week that was. (Sounds like an old comedy show?) Thank you again for visiting. If you have any comments or questions, please feel free to leave your comments right on the blog, or email me at bobsadviceforstocks@lycos.com.
Bob
Friday, 7 April 2006
April 7, 2006 Aladdin Knowledge Sys (ALDN) Revisiting a Stock Pick
Click ***HERE*** for my PODCAST ON ALADDINHello Friends! Thanks so much for stopping by and visiting my blog,
Stock Picks Bob's Advice. As always, please remember that I am an amateur investor, so please remember to consult with your professional investment advisors prior to making any investment decisions based on information on this website.

I was looking through the
list of top % gainers on the NASDAQ today and came across Aladdin Knowledge Systems (ALDN) which, as I write, is trading at $22.96, up $1.61 or 7.54% on the day. This company is an old favorite of mine, having
posted ALDN on Stock Picks Bob's Advice on March 25, 2005, when it was trading at $23.26. The stock is thus virtually unchanged (just down $.30/share) since the stock pick. Then
why should I again post this stock on the blog?
Let's take another look at the company and I think you will be able to share my thinking about this particular stock.
First of all, why did the stock move higher today? A few hours ago, as was
reported, an analyst from Bean Murray Carret & Co., upgraded the stock to "Strong Buy" from "Accumulate" and raised his price target to $26. As reported in the same story, he stated:
"We believe the company's DRM business, about 70 percent of revenue, is likely to return to solid growth in the first quarter of 2006, after posting disappointing 4 percent year-over-year growth in the fourth quarter of 2005," Glukhov wrote in a note."
But let's run the stock through a few of the screens that I like to use to examine a possible investment.
First of all, what does the company do?
According to the
Yahoo "Profile" on Aladdin, the company
"...and its subsidiaries provide solutions for software digital rights management and Internet security. The company offers its products in two divisions: Software Digital Rights Management (SDRM) and Enterprise Security."
And how about the latest quarter?
On January 23, 2006, Aladdin
reported 4th quarter 2005 results. For the quarter ended December 31, 2005, revenues climbed 16% to $21.8 million from $18.8 million in the same period of 2004. GAAP net income for the fourth quarter of 2005 was $3.9 million or $.27/diluted share, up 48% from the same quarter the prior year when net income was $2.6 million or $.20/diluted share.
How about longer-term?
Checking the
Morningstar.com "5-Yr Restated" financials, we can see the steady growth in revenue from $44.3 million in 2000 to $69.1 million in 2004.
Earnings have been erratic, dropping from $.12/share in 2000 to a loss of $(1.32)/share in 2001. Since 2001, earnings have gradually improved to $.68/share in 2004. The company has not expanded the stock supply significantly, with 11 million shares in 2000, increasing to 12 million in 2004.
Free cash flow has been positive and growing, with $3 million in 2002, $5 million in 2003 and $8 million in 2004.
The balance sheet, as reported on Morningstar.com looks nice with $25.9 million in cash and $22.7 million in current liabilities. Combined, this yields a current ratio of almost 3.5. In fact, the cash alone is enough to pay off the current liabilites and the long-term liabilities of $3.1 million combined.
What about some valuation numbers on this stock?
Reviewing
, we can see that this is a small cap stock with a market capitalization of only $331.57 million. The trailing p/e is moderate at 27.12, but the forward p/e is even nicer (fye 31-Dec-07) at 17.81. Thus, with the growth anticipated, the company trades at a PEG of only .95.
According to the
Fidelity.com eresearch website, ALDN sports a fairly reasonable Price/Sales ratio within the "Security Software & Services" industrial group. Topping this group is Check Point Software (CHKP) with a Price/sales ratio of 8.1. Next is McAfee (MFE) with a ratio of 4.3, RSA Security (RSAS) at 4.2, Aladdin at 3.9 and Safenet (SFNT) at 2.5.
Yahoo shows 14.4 million shares outstanding with 9.68 million that float. As of 3/10/06, there were 1.14 million shares out short representing 8.8 days of average trading volume (the short ratio). With this well over my cut-off of 3, this looks significant, and there may be some scrambling among short-sellers, in the face of the analyst upgrade, to buy shares to cover their 'shorts'.
Yahoo shows no cash dividend and the last stock split was a 3:2 on 9/18/95.
What about a chart?
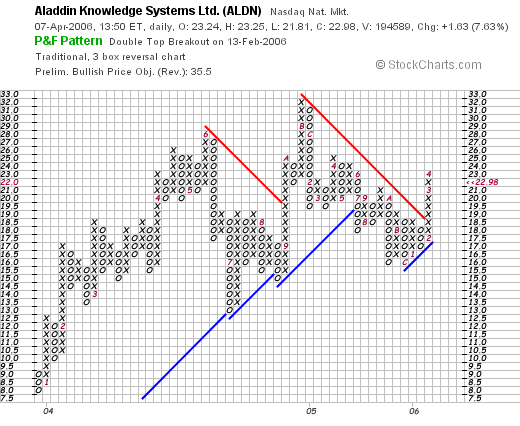
Reviewing the
"Point & Figure" chart on Aladdin from StockCharts.com, we can see that the stock actually moved strongly higher from $8 in December, 2003, to a high at $28 in June, 2004, until falling back to $13.50 in July, 2004. The stock climbed once again to $32 in August, 2004, and corrected again to $16 in late 2005. However, the stock is once again on the move higher, having broken through resistand at $18 in February, 2006. The chart is not overly impressive in terms of price momentum to the upside, but appears to overall be moving higher at this time. It certainly does not appear over-extended!
So what do I think? Well, the latest quarterly report was strong, and with all of the shares out short, there may well be a bit of a squeeze we are witnessing subsequent to the analyst upgrade today. The Morningstar results look nice with a steady picture of revenue growth, and overall earnings improvement. Valuation is reasonable with a PEG under 1.0, and a Price/Sales near the bottom in its group. Free cash flow is positive and growing and the balance sheet looks nice.
Finally, the chart which overall appears to be moving higher, does not overwhelm this observer in its bullish bias. The chart is a bit weak, but with all of the great numbers, I think it more likely that the stock rise will once again renew.
Thanks again for stopping by! If you have any comments or questions please feel free to leave them on the blog or email me at bobsadviceforstocks@lycos.com.
Bob
Posted by bobsadviceforstocks at 1:31 PM CDT
|
Post Comment |
Permalink
Updated: Friday, 7 April 2006 11:08 PM CDT
Newer | Latest | Older


