Stock Picks Bob's Advice
Saturday, 6 May 2006
CNS, Inc. (CNXS) Revisiting a Stock Pick
Hello Friends! Thanks so much for stopping by and visiting my blog,
Stock Picks Bob's Advice. As always, please remember that I am an amateur investor, so please remember to consult with your professional investment advisors prior to making any investment decisions based on information on this website.

Yesterday I had a "permission slip" generated when I sold a portion of my ResMed (RMD) at a gain. Thus, being under my 25 position portfolio maximum, I looked through the
list of top % gainers on the NASDAQ and came across CNS (CNXS) which was having a great day, and actually closed at $24.14, up $2.65 or 12.33% on the day. Earlier in the day I purchased 240 shares for $24.395. I moved my portfolio up to 23 positions, two under the maximum.

CNS is what I call an "old favorite" of mine, meaning I have previously written up this stock on the blog. On April 29, 2005, almost exactly one year ago, I
wrote up CNS on Stock Picks Bob's Advice when it was trading at $18.09. With yesterday's close at $24.14, this stock has appreciated $6.05 or 33.4% since posting.
Let's take an updated look at this company so I can explain why I picked this stock to purchase in my trading portfolio!
1. What does this company do?According to the
Yahoo "Profile" on CNS Inc., the company
"...engages in developing and marketing consumer health care products, including Breathe Right branded products focused on better breathing and FiberChoice branded products focused on digestive health."
(Does anyone else see the irony of selling shares in a company treating sleep apnea machines, and buying shares in a company that makes nasal strips and sprays to treat snoring?)
 2. How about their latest quarterly result?
In fact, it was the
announcement of 4th quarter 2006 results Thursday, after the close of trading, that pushed the stock higher on Friday! As reported:
"Net sales for the fourth quarter of fiscal 2006 were $32.1 million, up 13% compared to $28.4 million in the same period last year. Net income for the fourth quarter grew 14% to $4.7 million, or $0.32 per diluted share, compared to $4.1 million, or $0.28 per diluted share, for the fourth quarter of fiscal 2005."
As an added plus, the company boosted the quarterly dividend 17% from $.06/share to $.07/ share for shareholders of record as of May 26, 2006.
3. What about longer-term results?Regular readers of this blog will know that this is my critical part of an assessment of a stock. Consistent good results = quality. At least that is my perspective!
Reviewing the
"5-Yr Restated" financials from Morningstar.com, there is a gap for the 2002 results (? changing fiscal years?), but the company had revenue of $84 million in 2001, dropping to $79 million in 2003, but then increasing steadily to $94 million in 2005 and $109 million in the trailing twelve months (TTM).

Likewise, earnings which were $.01/share in 2001, climbed to $.46/share in 2003, $.59/share in 2004, $.93/share in 2005 and $1.11/share in the TTM.
The company initiated dividends in 2004 at $.12/share and has raised dividends each year since. The number of shares outstanding has remained stable at 14 million.
Free cash flow, while a bit erratic, has been positive with $19 million in free cash flow in 2003, $15 million in 2005, and $13 million in the TTM.
The balance sheet is quite solid imho, with $59.7 million in cash alone, enough to cover the $18.3 million in current liabilities more than 3x over. Added to the $29.1 million in other current assets, the current ratio works out to 4.9. (over 1.5 is generally considered 'healthy'). Morningstar shows NO long-term liabilities at all!
4. What about some valuation numbers on this company?Looking at
Yahoo "Key Statistics" on CNS, we see that this is a small cap stock with a market capitalization of $341.92 million. The trailing p/e is a very moderate 21.81, with a forward p/e (fye 31-Mar-07) estimated at 18.86. Thus, the PEG (5 yr expected) is quite nice at 1.16.

According to the
Fidelity.com "eresearch" website, CNXS is in the "Medical Appliances/Equipment" industrial group, and its Price/Sales ratio of 3.3 places it on the low side with St. Jude (STJ) topping the list at 5.1, Zimmer (ZMH) at 4.6, Biomet (BMET) at 4.5, followed by CNXS at 3.3, Edwards Lifesciences (EW) at 2.8.
Yahoo reports 14.16 million shares outstanding with 12.98 million that float. Interestingly, as of 4/10/06 there were 1.77 million shares out short representing 11.60% of the float or 12 trading days of volume (the short ratio). With the sharp rise yesterday on good earnings results, we may have been observing a bit of a squeeze on the short-sellers scrambling to cover their bet against the company.
As already noted, the company pays a dividend of $.28/share with a forward estimated yield of 1.3%. According to Yahoo, the last stock split was a 2:1 split on June 23, 1995.
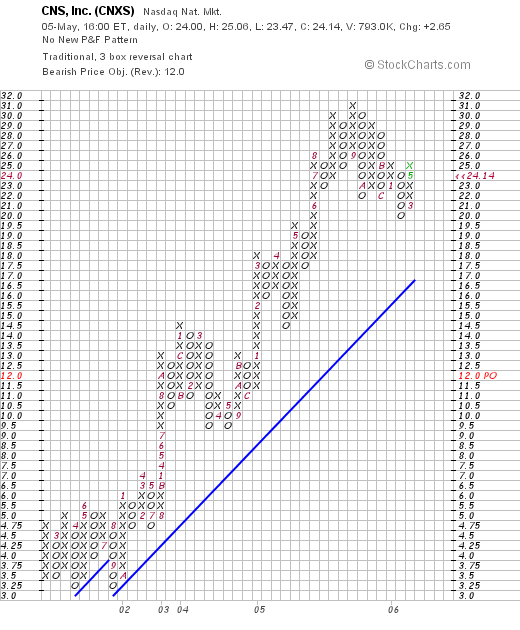
5. What does the chart look like?Looking at the
"Point & Figure" chart on CNXS from StockCharts.com, we can see the stock consolidating between $4.75 and $3.00 between February, 2001, and September, 2001. In December, 2001, the stock broke through resistance at $4.75 and has been moving higher since. Recently the stock has pulled back from the $31 level, dropping to the $20 level. However, the stock appears well above support levels and does not appear to have broken down in terms of price momentum.
6. Summary: What do I think?
Let's try to put this all together. First of all, I do own some shares (as of yesterday) of this stock. But I first wrote this one up a year ago and it subsequently appreciated 30% in price. The stock made a good move yesterday on a solid earnings report. Nothing spectacular but just the usual steady earnings growth, steady revenue growth, and an added plus of a raised dividend. The past several years have also seen steady growth.
The valuation is quite reasonable with a p/e at 21 with a PEG just over 1.1. The Price/Sales ratio isn't too rich on what appears to be a rather arbitrary group assignment. The company is generating free cash and has a beautiful balance sheet with lots of cash and NO long-term debt. The company even pays a dividend and is raising it as well. The chart looks pretty strong. And there are lots of short-sellers that need to cover if the stock continues to move higher.
On the downside this may be a "two-hit wonder" with just two main products, the nasal strips and the fiber tablets. However, the products are well-regarded and the management appears able to continue to manage these assets in a productive fashion.
I like the stock enough to buy it :).
Thanks so much for stopping by and visiting! If you have any questions or comments, please feel free to leave them on the blog or email me at bobsadviceforstocks@lycos.com. Please be sure to come and visit my Stock Picks Bob's Advice Podcast Site where you can hear me discuss more about many of the same stocks in the blog!
Bob
Friday, 5 May 2006
CNS, Inc. (CNXS) "Trading Transparency"
Hello Friends! Thanks so much for stopping by and visiting my blog,
Stock Picks Bob's Advice. As always, please remember that I am an amateur investor, so please remember to consult with your professional investment advisors prior to making any investment decisions based on information on this website.
Earlier today I sold 30 shares (1/6th of my position) of ResMed (RMD) which hit a 60% appreciation target. Thus, with the second targeted sale of this stock at a gain, I had the "permission" to add a new position in my trading portfolio.
Looking through the
list of top % gainers on the NASDAQ, I saw that an old favorite of mine, CNS (CNXS) was hitting the top % list on good earnings news. The Morningstar report looked good to me so I added this stock to my portfolio, purchasing 240 shares of CNXS at $24.40. As I write, the stock is now trading at $24.56/share, up $3.07 or 14.29% on the day.
I will try to get around to doing an updated review on this stock later today. Meanwhile, thanks again for visiting. Please feel free to leave comments here or email me at bobsadviceforstocks@lycos.com if you have any comments, questions, or any other thoughts you would like to share with me! As always, remember to also stop by and visit my
Stock Picks Bob's Advice Podcast Site.
Bob
ResMed (RMD) "Trading Transparency"
Hello Friends! Thanks so much for stopping by and visiting my blog,
Stock Picks Bob's Advice/. As always, please remember that I am an amateur investor, so please remember to consult with your professional investment advisors prior to making any investment decisions based on information on this website.
A few moments ago I noticed that ResMed (RMD) was having a very nice day trading as I write at $47.58, up $4.18 or 9.63% on the day. In fact, the stock hit a 60% appreciation point for me and I sold 1/6th of my position of 180 shares or 30 shares at $47.84. These shares were originally purchased 2/4/05 with a cost basis per share of $29.87. Thus, I had a gain of $17.97/share or 60.2% since my purchase.
As is my strategy, since I am at 22 positions, under my 25 position maximum, I shall now have "permission" to add a new position to my trading account. When I get a chance I shall start scouring the top % gainers list. If anything looks good, I shall keep you posted.
Thanks so much for stopping by and visiting! If you have any questions or comments, please feel free to leave them on the blog or email me at bobsadviceforstocks@lycos.com. Also, please remember to stop by and visit my
Stock Picks Bob's Advice Podcast Site where you can hear me discuss different stocks including a discussion or ResMed a few months ago.
Bob
Wednesday, 3 May 2006
Garmin (GRMN) May 3, 2006
Click HERE for my PODCAST ON GARMINHello Friends! Thanks so much for stopping by and visiting my blog,
Stock Picks Bob's Advice. As always, please remember that I am an amateur investor, so please remember to consult with your professional investment advisors prior to making any investment decisions based on information on this website.

This evening, looking through the
list of top % gainers on the NASDAQ, I came across Garmin (GRMN) which deserves a place in this blog. Garmin closed at $96.43, up $8.51 or 9.68% on the day. Now the funny thing is, I am sure I have looked at this stock before, but I cannot find any entry :). (That is a sure sign I need that remodeling job that I am exploring even as I write!) I do not have any shares nor do I own any options on this stock.
Let me run you through the key points that impressed me when I was looking at this stock.
1. What does the company do?According to the
Yahoo "Profile" on Garmin, the company
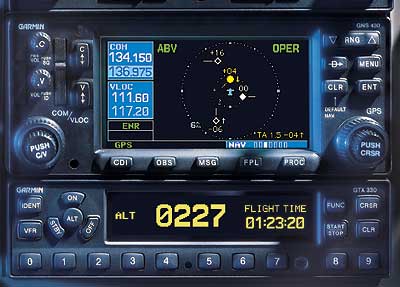
"...through with its subsidiaries, engages in the design, manufacture, and marketing of navigation, communications, and information products, which are enabled by global positioning system (GPS) technology worldwide. It operates in two segments, Consumer and Aviation."
2. How about the latest quarterly result?In fact, it was the
announcement of 1st quarter 2006 results which pushed the stock higher today.
The company reported strong results with revenue climbing 67% to $322.3 million from $192.7 million in the same period a year earlier. Net income almost doubled to $87.5 million from $47.4 million the prior year same period. On a per share basis this worked out to $.80/share, up from $.43/share last year. As part of the "trifecta", exceeded analysts expectations:
"In a Thomson Financial poll, analysts forecast profit of 67 cents on sales of $256 million."
To top off the report, the company raised guidance. Analysts have been expecting 2006 profit of $3.22 on sales of $1.32 billion. The company guided higher:
"Garmin said it is looking for per-share earnings to top $3.40 this year and revenue to exceed $1.4 billion. The company projected sales growth of between 10 percent and 20 percent in its aviation, outdoor fitness and marine businesses. The automotive segment is forecast to see sales surge more than 75 percent this year."
I guess the only other thing a company can announce to push the price higher and attract interest is a stock dividend, and Garmin didn't disappoint, and announced a 2:1 stock split payable December 15th. What else could an investor want?
3. How about longer-term results?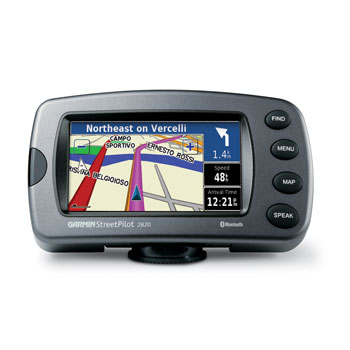
For this information, I like to review what I consider to be an important page of information, the
Morningstar.com "5-Yr Restated" financials on Garmin. Starting first with revenue growth, I am very impressed with the consistent increase from $369 million in 2001 to $1.028 billion in 2005. Earnings/share have increased steadily as well from $1.05/share in 2001 to $2.85/share in 2005. In addition, the company started paying a $.50/share dividend in 2003 and has paid this $.50/share in 2004 and 2005. An additional point from this page is the consistency in the number of shares outstanding with 108 million reported in 2001, and 108 million in 2005.
And the free cash flow? This has been positive and essentially growing from $141 million in 2003 to $131 million in 2004 and $220 million in 2005.
The balance sheet looks strong to me with $366.4 million in cash which by itself could pay off both the $195.5 million in current liabilities and the negligible $9.5 million in long-term liabilities combined more than 1.5x over. If we combine the current assets, we can calculate a current ratio of 4.1. (over 1.5 is healthy).
4. What about some valuation numbers on this stock?
reviewing the
Yahoo "Key Statistics" on Garmin, we can see that this is a large cap stock with a market capitalization of $10.43 billion. The trailing p/e is 33.81, with a forward p/e (fye 31-Dec-07) of 26.56. The PEG is a bit rich as well at 1.81.
Garmin is also priced richly by the Price/Sales ratio, which is reported at 9.3 for this company by the
Fidelity.com eresearch website. Topping this industrial group of "Scientific/Tech. Instruments" is SiRF Technology (SIRF) with a Price/Sales ratio of 11.5. This is followed by Garmin at 9.3, Flir Systems (FLIR) at 3.9, Fisher Scientific (FSH) at 1.7 and Beckman Coulter (BEC) at 1.4.
Finishing up with Yahoo, we can see that therer are 108.21 million shares outstanding with only 59.96 million of them that float. As of 4/10/06 there were 8.07 million shares out short representing 13.0% of the float. This is a significant short interest imho, with a short ratio of 8.3. The shares out short could well have been part of the strong price rise today on the announcement of fabulous earnings news! As noted, the company pays a $.50/share dividend yielding 0.60%. No prior stock splits are reported on Yahoo...except the current anticipated slip in December, 2006.
5. What about a chart?Reviewing the
"Point & Figure" chart on Garmin from StockCharts.com:
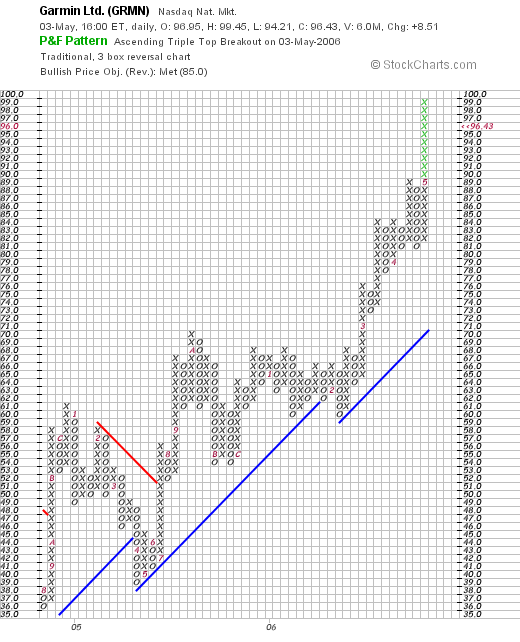
We can see what I would have to call a gorgeous chart with a steady increase from $35 in August, 2004, to the current level of $96.43. The chart appears quite strong to me.
6. Summary. What do I think?
Let's review, the company reported what I would call an impeccable earnings report today before the open of trading with extremely strong revenue and earnings growth. They beat expectations. They raised guidance. They are splitting the stock! WOW.
The Morningstar.com report is also gorgeous with steady and strong revenue and earnings growth, the company pays a small dividend and has been holding the line on the number of shares outstanding. The company is showing increasing free cash flow and the balance sheet is strong with loads of cash and little debt. Valuation-wise, the PEG is over 1.5 but under 2, and the Price/Sales ratio is also rich. So this isn't priced on sale...but still.... The company has a significant number of shares out short and the chart looks nice. There are a lot of things going for this company and this stock. Now, if I were only in the market to buy some shares.
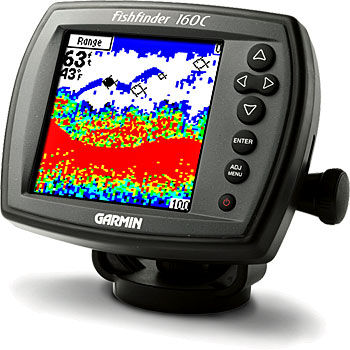
You will note that I haven't been talking about the products. The fish-finders. The GPS systems. THAT is the 'story' behind the company. What makes me tick are all those fundamental stuff that imho makes the stock move. Not the story. Doesn't really matter to me!
Thanks so much for stopping by and visiting. If you have any comments or questions, please feel free to leave them on the blog or email me at bobsadviceforstocks@lycos.com. Please be sure to visit my Stock Picks Bob's Advice Podcast Website where you can download an mp3 of me commenting on many of these same stocks in my blog!
Bob
Tuesday, 2 May 2006
LoJack (LOJN) Revisiting a Stock Pick
Click HERE for my PODCAST on LoJackHello Friends! Thanks so much for stopping by and visiting my blog,
Stock Picks Bob's Advice. As always, please remember that I am an amateur investor, so please remember to consult with your professional investment advisors prior to making any investment decisions based on information on this website.

I was reviewing the
list of top % gainers on the NASDAQ today and came across Lojack (LOJN), an old favorite of mine, that is trading, as I write, at $23.51, up $1.50 or 6.82% on the day. I do not own any shares or options of this company.

I first
posted LoJack on Stock Picks Bob's Advice on April 13, 2005, when LOJN was trading at $13.94/share. With the stock currently trading at $23.51, the stock has gained $9.63 or 69.1% since posting this stock a little over a year ago!
Let's take another look at this company and I will show you why I think it deserves mention once again on this blog.
1. What does the company do?According to the
Yahoo "Profile" on LoJack, the company
"...together with its subsidiaries, provides technology products and services for the tracking and recovery of mobile assets worldwide. Its wireless network technology offers a means for the tracking and recovery of stolen vehicles, motorcycles, and construction equipment."
2. How did the company do on the latest quarterly report?On February 21, 2006, LoJack
reported 4th quarter 2005 results. For the quarter ended December 31, 2005, revenue climbed 17% to $45.4 million from $39.6 million in the same quarter last year. Net income did even better, growing 62% to $5.02 million or $.25/diluted share, up from $3.1 million or $.18/diluted share in the year-ago same period.
3. How has the company done 'longer-term'?
Looking at the
"5-Yr Restated" financials on LOJN from Morningstar.com, we find that revenue growth has been very steady with $96 million reported in 2001 growing to $191 million in 2005. Earnings have been a bit more erratic, dropping from $.45/share in 2001 to $.12/share in 2002. However, since 2002, growth has once again been steady with increases to $.96/share in 2005. The company has increased the number of shares outstanding from 16 million in 2001 to 18 milion in 2005 and 19 million in the trailing twelve months (TTM). Free cash flow has also been positive and growing with $5 million in 2003, $8 million in 2004 and $18 million in 2005.
The balance sheet looks healthy with $47.6 million in cash and $63.8 million in other current assets. When these are compared against the $44.1 million in current liabilities, we can derive a current ratio of just over 2.5. The company also has another $43.5 million in long-term liabilities.
4. How about some valuation numbers on this company?Reviewing
Yahoo "Key Statistics" on LoJack, we can see that this is a small cap stock with a market capitalization of $447.9 million. The trailing p/e isn't too bad at 24.46 and the forward p/e (fye 31-Dec-07) is even nicer at 18.81. We don't have a PEG on this company.
According to the
Fidelity.com eresearch website, LoJack is in the "Security/Protection Services" industrial group. Within this particular group, the Price/Sales ratio is relatively rich for LOJN at 2.2, the highest in its group. this is followed by Armor Holdings (AH) with a Price/Sales ratio of 1.3, Checkpoint Systems (CKP) with a ratio of 1.3, Brinks (BCO) with a ratio of 0.6, and Compudyne (CDCY) at 0.4.
Finishing up with Yahoo, we find that there are 19.05 million shares outstanding with 18.36 million that float. As of 4/10/06, there were 877,800 shares out short, representing 4.80% of the float or 3 trading days of volume.
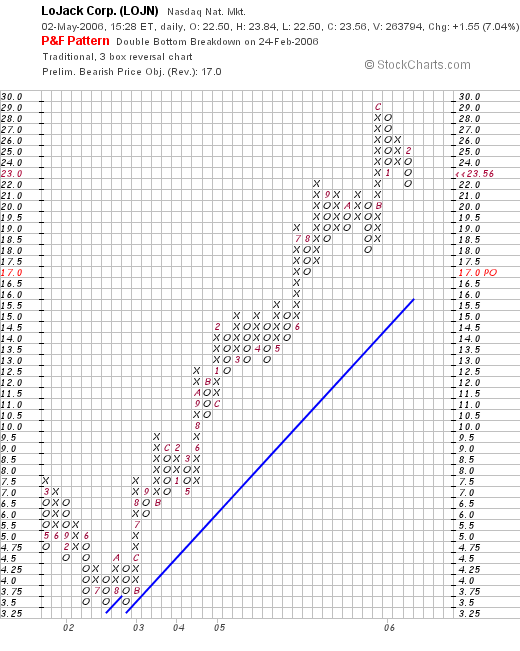
5. What does the chart look like?Reviewing the
"Point & Figure" chart on LOJN from StockCharts.com, we can see that the stock which traded lower from $7.50 in February, 2001, to a low of $3.50 in June, 2002, literally hit a 'triple bottom', and in August, 2003, broke into new high territory at around $7.50 again, and since that time has been trading steadily higher to the current level of $23.56. This chart looks quite strong to me!
6. Summary
So what do I think? The stock moved higher today with the initiation of analyst coverage at J.P. Morgan at "overweight". The last quarter was strong. The five year Morningstar report also looks nice with steady revenue growth and almost as steady earnings improvement. Free cash flow is positive and growing and the balance sheet is solid. Valuation-wise, the p/e is a tad rich and the Price/Sales ratio is also no bargain, being at the top of its group. Finally the chart looks very strong.
I like this stock not so much for the business it is in, the story behind the company, but rather for the consistency of its results. This imho is the best reflection of good management.
Thanks again for visiting! If you have any comments or questions, please feel free to email me at bobsadviceforstocks@lycos.com or just leave them here on the blog. Also, be sure to visit my Stock Picks Bob's Advice Podcast Site.
Bob
Posted by bobsadviceforstocks at 3:33 PM CDT
|
Post Comment |
Permalink
Updated: Tuesday, 2 May 2006 9:57 PM CDT
Saturday, 29 April 2006
A Reader Writes: "...a couple of stocks that I would love to get your opinion..."
Hello
Friends! Thanks so much for stopping by and visiting my blog,
Stock Picks Bob's Advice. As always, please remember that I am an amateur investor, so please remember to consult with your professional investment advisors prior to making any investment decisions based on information on this website.
I received a nice email from Bret M., who is a friend of my son Ben.

Bret wrote:
"Ben told me about your blog a few weeks ago and Ive been enjoying reading it.
Your strategy is very interesting and I really like the way it automatically
keeps you in a bull market and pulls you out of a bear.
I've got a couple of stocks that I would love to get your opinion on.
My dad is
an optometrist and he owns a little stake in Advanced Medical Optics (EYE). It
has done very well and I know you would say to peel off a small chunk of it. Have you heard anything about it posibly
being bought
out by J&J? Do you suspect that would that be good for EYE stock?
Another stock that my dad and I have been in and out of a little is DXPE. We
found it on a Yahoo "top 10 stocks under 10 bucks" list last summer
and it then
shot up after Katrina. We rode it from like 10 to 18. It is extremely
volitile,
but has made its way up to 38. What do you think about its fundementals? Is it
too late or too expensive now to get back in?
Thanks for the help. I look forward to hearing back from you. Thanks.
Bret M."
Brett, thanks so much for writing. First of all, I am not privy to any inside information. I do not know if EYE might be an acquisition target. It is a general rule that acquisitions are favorable for the acquired company which generally sees a significant increase in its stock price. Should you be selling a little bit of your holding as the company's stock price rises? You of course know my answer. If it is wise to sell your losing stocks quickly, it is also wise to sell your gaining stock slowly. It is often hard to both sell a stock that has dropped and it is equally hard to justify selling a stock when you are in the midst of feeling so good about it. I am sure you understand this.

This past Thursday, April 27, 2006, EYE
announced 1st quarter 2006 results. Sales increased nicely to $238.2 million for the quarter, a 23.7% increase over the prior year same quarter. However, first quarter net income came in at $2.6 million or $.04/share, down sharply from $13.8 million or $.35/share last year. The company had a lot of excellent reasons and did provide reasonably strong guidance for future results, but I am always looking at the 'bottom line'.
I also have a tough time with the EYE
Morningstar.com "5-Yr Restated" financials, which, while showing strong revenue growth show that the company dropped from $.35/share in 2003 to a loss of $(3.89)/share in 2004 and $(8.28)/share in 2005. In addition, free cash flow which was $22 million in 2004, dropped to a negative $(2) million in 2005.
The balance sheet as reported on Morningstar.com shows the company with a bit of a heavy debt load with a current ratio of 1.84, which isn't bad, but also a $710.5 million in long-term liabilities.
And the
"Point & Figure" chart on EYE from StockCharts.com:
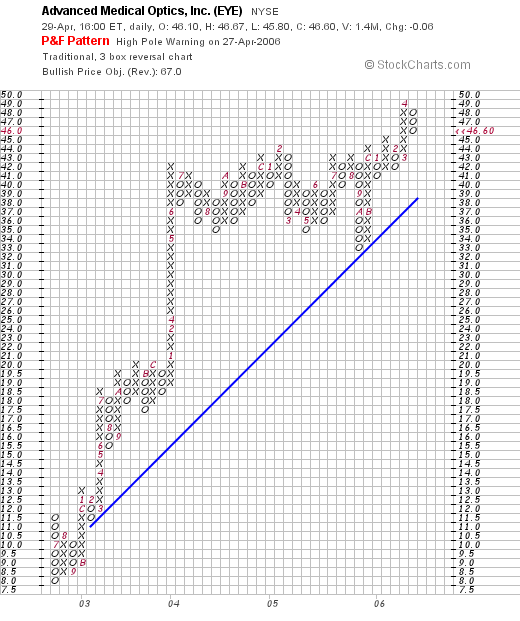
Clearly this stock looks very strong on the chart-side of things. All the more reason to take some small profits. I do not invest based on stories or hypotheses. I did at one time in the past.
I like to look hard at actual corporate performance, with the limited tools at my disposal. I am not looking for what 'could be' but what is actually occurring. Basic stuff like earnings, free cash flow, valuation numbers, and balance sheets. This is how I approach my investments. That, along with careful tending of my holdings with partial sales of stocks as they approeciate and quick sales of stock posting losses. I have had several of my stocks acquired....most recently Sybron Dental (SYD) that I wrote up a month or so ago. But I believe they are getting acquired because others are examining these companies with the same perspective I am applying.
Now for that other stock you mentioned: DXPE....a stock that I don't think I am familiar with...so let's take a look.
 According to the Yahoo "Profile" on DXPE, the company
"...distributes maintenance, repair, and operating (MRO) products, equipment, and service to industrial customers in the United States. It operates in two segments, MRO and Electrical Contractor."
What about the latest quarter? On April 26, 2006, DXPE
announced 1st quarter 2006 results. Sales grew 49.6% to $62.5 million from $41.8 million in the same quarter the prior year. For this quarter that ended March 31, 2006, net income came in at $2.5 million or $.44/share, up 193% from $854,000 or .15/share in the prior year same period. I would have to admit that this was a
fabulous report!
What about longer-term?
Except for a dip in revenue from $174.4 million in 2001 to $148.1 million in 2002, the company has been growing its revenue to $185.4 million in 2005.
Earnings have grown steadily during the past five years from $.21/share in 2001 to $.94/share in 2005. This is a very small company with 4 million shares in 2001, increasing to 5 million in the trailing twelve months (TTM).
Free cash flow has been deteriorating recently, dropping from $7 million in 2003, $3 million in 2004, and $(2) million in 2005.
The balance sheet is fine with $.6 million in cash and $55.6 million in other current assets, balanced against $28.1 million in current liabilities (giving us a 'current ratio' of 2.0) and $25.3 million in long-term liabilities.
And the chart: looking at the
"Point & Figure" chart on DXPE from StockCharts.com:
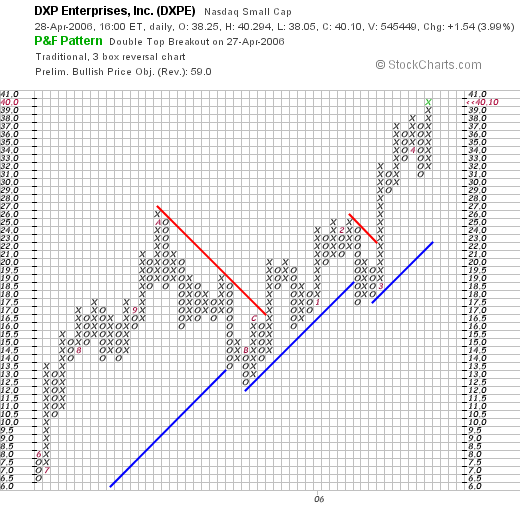
Basically, this chart looks quite strong as well.
What about DXPE 'valuation'? Looking at the Yahoo "Key Statistics" on DXPE, we can see that this is a small company with a market cap of only $198.49 million. The trailing p/e is a bit rich at 42.48, but with the rapid growth in earnings, the forward p/e is much nicer at 21.68. There is no PEG available (probably no analyst with 5 yr results estimated). The Price/Sales is 1.03. According to the Fidelity.com eresearch website, DXP is in the "Industrial Equipment Wholesale" industrial group, and is priced midway between MSC Industrial with a Price/Sales ratio of 3 and CE Franklin (CFK) at 0.7. Thus, by this measure the stock isn't really overpriced.
So what do I think? I am a bit concerned about some of the things I have found and mentioned on EYE. However, the company remains optimistic. Being more concerned about actual results, I wouldn't be entering EYE at this point, but waiting for those results to happen. DXPE is a bit of a different story. The results in the latest quarter were fabulous.
Your question about "getting back in" is the problem of doing stocks "for a trade". Although I did the same in BOOM with 300 shares just yesterday :). But my core holding wasn't affected. It is better to just sell portions of stocks on large gains and sell ALL of your shares when stocks do poorly, not when they do WELL. Do you follow?
Should you enter now? I would if the stock hit the new high list and met my own criteria. I might pass on DXPE and miss a great company with their reported negative cash flow. There are just too many stocks to choose from and I go for perfect :). As for you, it is your call. I don't think this particular stock is so big it doesn't have any room to grow further. I would, however, establish sale points on any position you take, both on the upside and the downside. Forget the trades (except occasionally) imho. Generally think about managing your holdings instead.
Just my call.
Thanks so much for writing. Let me know if what I wrote was helpful and what you decided to do!
Regards.
Bob
A Reader Writes "I just wanted to get some advice from you..."
Hello Friends! Thanks so much for stopping by and visiting my blog,
Stock Picks Bob's Advice. As always, please remember that I am an amateur investor, so please remember to consult with your professional investment advisors prior to making any investment decisions based on information on this website.
I received a nice letter a few days ago from Isaac N. who wrote:
"I just wanted to get some advice from you concerning a stock I own.
I know you advise to sell partially after 30% gain is attained. I
bought ADM at 22.65 (44 shares) and now is at 36.67, a 61.9% gain.
Is it wrong for me to hold this stock as it has crossed the 30% gain
value? This is one of three stocks I own. I am also looking into
buying one more stock. Which sectors do you think will be hot in the
future. I'm very patient so I'm not necessarily looking for a stock
that will have immediate gains.
Thanks,
Isaac N"
Isaac, thanks so much for writing!
I want to try to take a look at several of the points that you raise in your comments. First of all, is ADM a good stock to own? And should you sell some shares now that you have 60% gain? And what sector do I think will be hot in the future?
Let me comment briefly on these things.
First of all Archer-Daniels-Midland (ADM). The stock closed at $36.34 on 4/28/06, up $.15 or .41% on the day. Currently ADM appears to be riding the ethanol bandwagon.
Latest quarter:
On January 31, 2006, ADM
reported 2nd quarter 2006 results. Sales grew 3% to $9.3 billion from $9.06 billion the year earlier. Net income for the quarter ended December 31, 2005, increased 17% to $367.7 million or $.56/share, up from $313.5 million or $.48/share the prior year. So far so good. Better yet than the results themselves was the fact that the company exceeded estimates:
"Analysts surveyed by Thomson Financial had expected the company to post earnings of 42 cents per share on sales of $9.18 billion."
So this
was a nice report!
How about longer-term? Looking at the
Morningstar.com "5-Yr Restated" financials, we can see that revenue grew strongly between 2001 and 2004, then flattened out in 2005 and the trailing twelve months (TTM). Meanwhile, earnings have skyrocketed between 2004 when they were $.76/share and 2005 when earnings came in at $1.59. Dividends have also been increasing steadily throughout this period. In addition the number of shares outstanding has been shrinking from 661 million in 2001 to 653 million in 2005 and 654 million in the TTM.
Free cash flow has been a bit erratic, but overall appears to be strongly positive (except for a negative $(476) million in 2004). The balance sheet also looks reasonable with a current ratio of about 1.5. The company does have a bit of a debt load with $5.2 billion in long-term liabilities. But the finances overall look just fine.
Reviewing
Yahoo "Key Statistics" on ADM, this is a large company with a market cap of $23.76 billion. The trailing p/e isn't bad at 17.73, but the PEG is a bit rich at 2.11. However, with the latest strong earnings, this may well be adjusted downward. The Price/Sales at 0.66 appears reasonable as well. There are a lot of shares out at 653.8 millio outstanding with 633.22 million that float. Only 5.65 million shares are out short, representing 0.9% of the float or 1.3 trading days of volume. As noted, the company pays a 1.1% dividend and last declared a 5% stock split in August, 2001.
The chart? Taking a look at the
"Point & Figure" chart on ADM from StockCharts.com:
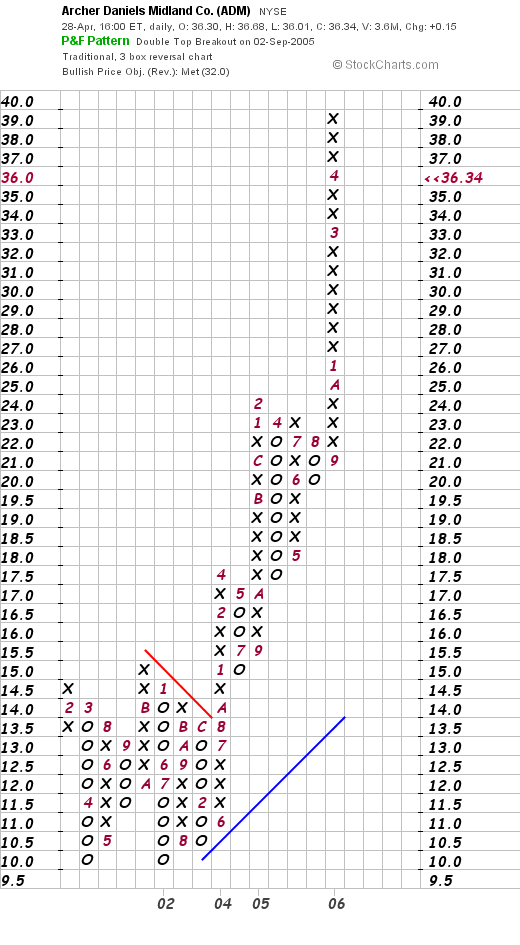
Clearly, this stock has been 'on a tear' recently. The stock broke through resistance at $14 in August, 2004, and has skyrocketed to its current level of $36.34. If anything, the stock price appears a bit over-extended. This is something that I describe when the price elevates far above the "blue" arbitrary support line. Overall the chart looks very strong.
Anyhow, insofar as ADM is concerned it is an interesting play especially on the Ethanol business. The numbers basically look fine except for the relatively stagnant growth in revenue. Earnings, however, have climbed.
Should you sell 1/6th? You probably know my answer. But that is just what I do. Doesn't mean you need to do it. I believe in selling my gaining stocks slowly and partially and my losing stocks completely and quickly. It is this bias that will keep your overall performance maximized imho.
What stock or industry should you consider? I am biased towards the medical technology firms but I still depend on what I call my "zen" approach on investing. I buy stocks that are climbing strongly on the day that I have my "permission" to add a new position. So my choice of industry, although I do have my own bias, depends on which stocks show up on the top % gainers list and also meet my own criteria.
I will refrain from naming a particular stock as I am sure you are more than capable of selecting a stock for consideration. If you would like, scan through my past entries, take a look at current information, and you will have hundreds of stocks to choose from!
Good luck and keep me posted. Thanks so much for taking the time to write.
Bob
Posted by bobsadviceforstocks at 11:04 AM CDT
|
Post Comment |
Permalink
Updated: Saturday, 29 April 2006 11:06 AM CDT
"Looking Back One Year" A review of stock picks from the week of February 7, 2005

Hello Friends! Thanks so much for stopping by and visiting my blog,
Stock Picks Bob's Advice. As always, please remember that I am an amateur investor, so please remember to consult with your professional investment advisors prior to making any investment decisions based on information on this website.
As I like to remind readers, the weekend is a time for reflection for me here on this blog. I like to review both past stock picks as well as actual holdings in my trading portfolio. The review of my past picks assumes a "buy and hold" strategy. In fact, I employ and recommend using an investment approach that involves selling losers quickly and completely and gaining stocks slowly and partially. However, for the sake of this blog, the "buy and hold" strategy is easier to evaluate and this is what I am doing in these reviews each weekend.

On February 7, 2005, I
posted Manor Care (HCR) on Stock Picks Bob's Advice when in was trading at $34.90. HCR closed at $43.85 on April 28, 2006, for a gain of $8.95 or 25.6% since posting.

On April 26, 2006, HCR
reported 1st quarter 2006 results. Revenues for the quarter came in at $869 million, down from $879 million in the same quarter last year. Net income was $25 million, down from $40 million or $.30/diluted share, down from $.46/diluted share the prior year same period. The company offered several good explanations within the report for this change in performance, however, I am stuck on the bottom line and for my purposes this stock gets a "thumbs-down" on this quarterly report.
On February 11, 2005, I
posted Trex (TWP) on Stock Picks Bob's Advice when Trex was trading at $48.46. Trex closed at $29.88 on April 28, 2006, for a loss of $(18.58) or (38.3)% since posting.
On April 27, 2006, TWP
announced 1st quarter 2006 results. For the quarter ended March 31, 2006, sales came in at $105.3 million, up from $89.9 million in the year-ago same period. Net income, however, came in at $4.2 million or $.29/diluted share compared with net income of $8.4 million or $.56/diluted share in the same quarter last year. Apparently, this is one company that is suffering from the increased cost of plastic raw materials.
So how did I do with these two stocks for that week a little over a year ago? Well, HCR showed a 25.6% gain and TWP showed a loss of (38.3)%. Thus, the average performance for these two was a
loss of (6.35)%.
A couple of comments. First of all, this shows how seemingly strong companies
can lose money over time! And that I am completely capable of posting a stock that can lose money! And how it is important imho to establish loss limits on your stocks. If I had in fact actually purchased these two stocks in my portfolio, I would have sold my TWP quickly and it would have been gone long before this particular loss, and my HCR would have been still in my portfolio biasing my performance to the gain. (I do NOT own either of these stocks in my trading portfolio....I believe I did have some shares of TWP in the near past in a managed account....I am not sure if it is still there.)
Anyhow, thanks so much for stopping by! If you have any comments or questions, please feel free to drop me a line at bobsadviceforstocks@lycos.com or feel free to leave your comments right here on the blog. Also, please be sure and drop by my
Stock Picks Bob's Advice Podcast Website wehre you can hear me talk about many of the same stocks I write about in my blog!
Bob
Friday, 28 April 2006
AngioDynamics (ANGO) "Revisiting a Stock Pick"
Hello Friends! Thanks so much for stopping by and visiting my blog,
Stock Picks Bob's Advice. As always, please remember that I am an amateur investor, so please remember to consult with your professional investment advisors prior to making any investment decisions based on information on this website.

Earlier today, as I noted in another post, I purchased 200 shares of AngioDynamics (ANGO) at $30.24/share. AngioDynamics (ANGO) closed at $2.91, up 10.33% on the day.
I recently had ANGO in my 'trading portfolio' and in fact,
reviewed AngioDynamics on Stock Picks Bob's Advice on February 11, 2006, a little over two months ago.

I purchased 240 shares of AngioDynamics at a cost of $26.26 on 1/6/06. These shares were sold on 3/2/06, last month (!), at a price of $23.46, for a loss of $(2.80) or (10.6)%. Showing up again on the list of top % gainers, and having a 'permission slip' to add a new position having sold 1/6th of my Ventana (VMSI) at a 90% gain, I decided to give ANGO another shot!
Let's review some of the latest information on this company and see if it is worth another purchase.
1. What does this company do?According to the
Yahoo "Profile"on AngioDynamics, the company
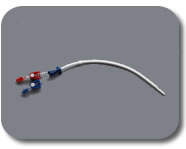
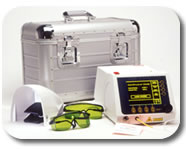
"...engages in the design, development, manufacture, and marketing of medical devices for the minimally invasive diagnosis and treatment of peripheral vascular disease. Its products include angiographic catheters, hemodialysis catheters, plasma thromboplastin antecedent dilation catheters, thrombolytic products, image-guided vascular access products, endovascular laser venous system products, and drainage products."
 2. How did the company do in the latest quarter?
On March 21, 2006, AngioDynamics
reported 3rd quarter 2006 results. For the quarter ended February 25, 2006, net sales increased 28% to $19.8 million, up from $15.5 million in the same quarter the prior year. Net income for the quarter was $1.9 million or $.14/diluted share, up 73% from $1.09 million the prior year and up 56% from the $.09/diluted share reported in the same quarter last year. To finish out what I call a "trifecta" in earnings reports, the company raised guidance stating:
"The Company is revising upwards its fiscal 2006 financial guidance. AngioDynamics now expects net sales growth to exceed 29% over fiscal 2005, to at least $78.0 million. Year-over-year net income growth is expected to exceed 60%, to $7.3 million, which includes an anticipated one-time charge totaling $400,000, net of income taxes, to be incurred in connection with the Company's requirement to comply by May 2006 with Section 404 of the Sarbanes-Oxley Act. This compares with the Company's prior guidance for net sales of at least $76.0 million, and net income of at least $6.7 million for fiscal 2006. The Company now expects its earnings per diluted share to increase to $0.57 for fiscal 2006, compared with its prior guidance of $0.52 per diluted share."
 3. How about longer-term results?
Reviewing the
Morningstar.com "5-Yr Restated" financials on ANGO, we see the steady progression in revenue from $23.4 million in 2001 to $60.3 million in 2005 and $72.2 million in the trailing twelve months (TTM). We have only two years of earnings to examine: the company reported $.37/share in 2005 and $.50/share in the TTM. Total shares were 12 million in 2005 and 13 million in the TTM.
Free cash flow is now positive and has been improving, with $(3) million in 2003, $1 million in 2004, $3 million in 2005 and the TTM.
The balance sheet is solid with $28.9 million in cash, enough by itself to pay off the combined $10.1 million in current liabilities and the $2.8 million in long-term liabilities more than 2x over. When combined with the $27.2 million in other current assets, the current ratio is calculated at 5.55. This looks solid to me!
4. How about some valuation numbers on this company?
Looking through the
Yahoo "Key Statistics" on ANGO, we find that this is a small cap stock with a market capitalization of only $388.50 million. The trailing p/e is rich at 61.52. The forward p/e (fye 28-May-07) is estimated at 41.43. However, with the rapid '5 yr expected' earnings growth, the PEG is a reasonable 1.39.
The company appears rather richly valued by Price/Sales ratio according to the
Fidelity.com eresearch website. Fidelity reports AngioDynamics with the richest Price/Sales ratio in the group of "Medical Instruments/Supplies" industrial group. AngioDynamics (ANGO) leads the group with a Price/Sales ratio of 5.1. This is followed by Stryker (SYK) at 3.7, Boston Scientific (BSX) at 3.1, Becton Dickinson (BDX) at 2.9, Baxter (BAX) at 2.4, and Bausch & Lomb (BOL) at 1.2. Certainly, by this measure, ANGO is not a screaming bargain.
Referring back to Yahoo, we find that there are only 12.50 million shares of this company outstanding with 10.23 million that float. Of these shares, 187,230 or 1.60% of the float was out short as of 3/10/06, representing 2.4 trading days of volume (the short ratio). This does not appear to be much of a factor imho. No cash dividends and no stock dividends are reported on Yahoo.
5. What does the chart look like?Looking at the
"Point & Figure" chart on AngioDynamics from StockCharts.com:
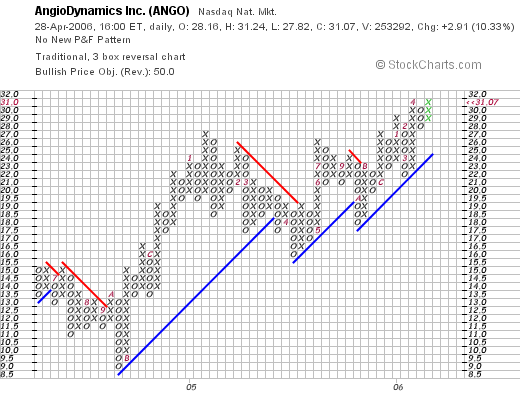
We can see that the stock which was trading at $15/share in June, 2004, dropped to a low of $9.00/share in October, 2004, and since then, through fits and starts has been heading higher to the current $31.07 level. The chart looks strong to me but not over-extended.
6. Summary
So what do I think? Well, I liked this stock enough to take another position in this stock even after being stopped out last month at a loss! The latest quarter was very nice with the company even boosting guidance. The Morningstar record is also solid but there isn't a long record of increasing earnings as it appears that this company has not been public too long (a negative). However, revenue has been growing nicely, and whatever results on earnings shows steady growth. Free cash flow is now positive and growing and the balance sheet looks nice.
Valuation-wise, the p/e is rich although the PEG at under 1.5 isn't too bad. The Price/Sales ratio is also rich with the company at the top of its group. Finally, the chart looks nice.
I basically like this company that is doing just fine. Hopefully, the stock price will cooperate better allowing me to stay a little longer than last time!
Thanks so much for stopping by! If you have any comments or questions, please feel free to leave your comments on the blog or email me at bobsadviceforstocks@lycos.com. Also feel free to listen to my January 6, 2006 PODCAST on ANGO. Please excuse a few technical glitches on this early podcast of mine. For a list of all of my podcasts, be sure to come and visit my Stock Picks PODCAST Website.
I hope you all have a wonderful weekend!
Bob
"Trading Transparency" ANGO
Hello Friends! Thanks so much for stopping by and visiting my blog,
Stock Picks Bob's Advice. As always, please remember to check with your professional investment advisors prior to making any investment decisions based on information on this website.
I have had a very busy Friday! After selling my 300 shares of Dynamic Materials (BOOM) that I bought yesterday (!), and selling a 1/6th position of my Ventana (VMSI) that hit a 90% appreciation point, this gave me "permission" to add a new position (being under my 25 position maximum).
Looking through the list of top % gainers I came across AngioDynamics (ANGO) a stock that I owned about 6 weeks ago, and had sold. The stock still met criteria, and deciding to give it another go (?), I bought 200 shares at $30.24. As I write, ANGO is trading at $31.00, up $2.84 or 10.09% on the day.
Anyhow, that's how it all worked out! Thanks so much for stopping by. If you have any comments or questions, please feel free to leave them on the blog or email me at bobsadviceforstocks@lycos.com. Please also be sure to visit my
Stock Picks Bob's Advice Podcast Site where you can listen to me talk about many of the stocks I discuss on my blog.
If I get a chance, I shall try to write up something about this ANGO trade in greater detail this weekend.
Bob
Newer | Latest | Older


