Stock Picks Bob's Advice
Tuesday, 25 July 2006
"Revisiting a Stock Pick" Hologic (HOLX)
Hello Friends! Thanks so much for stopping by and visiting my blog, Stock Picks Bob's Advice. As always, please remember that I am an amateur investor, so please remember to consult with your professional investment advisors prior to making any investment decisions based on information on this website. I apologize for not doing a lot of posting the last couple of weeks. I am still working at building a new blog website but with the market correction, I frankly have not been motivated to look for new stocks....but have been posting my sales as they arise.
 With the market climbing once again today (two days in a row!) I figured I would be able to find a stock or two that I liked. In fact, Hologic (HOLX), an old favorite of mine, was on the list of top % gainers, and the last price I have for it is $48.34, up $3.47 or 7.73% on the day. It is near the close of trading and probably is the closing price. I don't have any shares of HOLX in my Trading Account but my son does own literally 20 shares and my stock club also has purchased shares in Hologic.
I first posted Hologic on Stock Picks Bob's Advice on April 27, 2005, when the stock was trading at $35.85. HOLX had a 2:1 stock split on December 1, 2005, making my effective stock pick 'price' actually $17.93. With today's closing stock price of $48.34, this represents an appreciation of $30.41 or 170% since posting the stock just a little over a year ago. And to think I didn't buy any shares for myself! At least I talked my stock club into this stock and bought a few shares for my son's account!
Let's take a closer look at this company. First of all what they do. According to the Yahoo Profile on Hologic, this company
" ...engages in the development, manufacture, and supply of diagnostic and medical imaging systems for serving the healthcare needs of women. It focuses on mammography and bone densitometry."
Next, what about the latest quarterly report? Actually, it was the third quarter 2006 earnings report release that sparked today's rally in the stock. Revenue for the third quarter ended June 24, 2006, came in at $119.7 million, a 62% increase over the $74.1 million reported in the same quarter last year. Net income increased 46% to $12.0 million or $.25/diluted share up from $8.2 million or $.18/diluted share in the same quarter last year.
How about longer-term results? If we check the Morningstar.com "5-Yr Restated" financials on HOLX, we can see that revenue has been steadily increasing from $180.2 million in 2001 to $287.7 million in 2005 and $341.2 million in the trailing twelve months (TTM). Earnings during this period have increased from a loss of $(.67)/share in 2001 to a profit of $.01/share in 2002, $.63/share in 2005 and $.75/share in the TTM. The company has been increasing its number of shares outstanding from 31 million in 2001 to 43 million in 2005 and 46 million shares outstanding in the TTM. I would rather see a stable number of shares all things being considered, however, with the solid growth in revenue in earnings, the company has been growing its financial results faster than its outstanding shares!
Free cash flow has been a bit erratic but has increased from a negative $(4) million in 2003 to $37 million in 2005 and $17 million in the TTM.
The balance sheet looks solid with $108.3 million in cash, more than enough to cover the combined $65.4 million in current liabilities and the $5.3 million in long-term liabilities combined. Calculating the 'current ratio' gives us a total of $256.1 million, which when divided by the $65.4 million in current liabilities, yields a current ratio of 3.92. (1.5 or higher is the minimum for good financial health as a rule).
And how about some updated statistics/valuation numbers on this company? Looking at the Yahoo "Key Statistics" on Hologic, we find that the company is a mid-cap stock with a market capitalization of $2.20 billion. The trailing p/e is certainly rich at 65.01, and the forward p/e (fye 24-Sep-07) isn't much better at 40.48. The PEG, however, suggests a more reasonable valuation of the p/e, that since due to the rapid growth in earnings, the PEG is estimated at 1.32 (5 yr expected).
Reviewing the Fidelity.com eresearch website, we find the Hologic is in the "Medical Appliances/Equipment" industrial group, and is in fact the most richly valued of the group in terms of the Price/Sales ratio. HOLX leads this group with a Price/Sales ratio of 6.2. Following Hologic is Medtronic (MDT) at 5.1, St Jude (STJ) and Zimmer Holdings (ZMH) both at 4.2, Biomet (BMET) at 3.9 and Edwards Lifesciences (EW) with a Price/Sales ratio of 2.9.
Insofar as profitability, using the 'return on equity' (ROE) as a guide, we find that Hologic is only average in this measure. Leading the group is Biomet with a ROE of 25.9%, Medtronic at 23.8%, Zimmer at 16.6%, then Hologic at 15.1%, St Jude at 14.4% and Edwards Lifesciences at 13.8%.
Finishing up the statistics from Yahoo, we find that there are 45.59 million shares outstanding and 45.1 million that float. Currently there are 6.56 million shares out short representing 14.5% of the float or a significant 6.9 trading days of volume. (I use 3 days as my arbitrary cut-off for significance.)
No cash dividend is paid and as I noted above, the company last split its stock on 12/1/05 when it declared a 2:1 stock split.
And what does the chart look like? Taking a look at the "Point & Figure" chart on Hologic from StockChart.com:
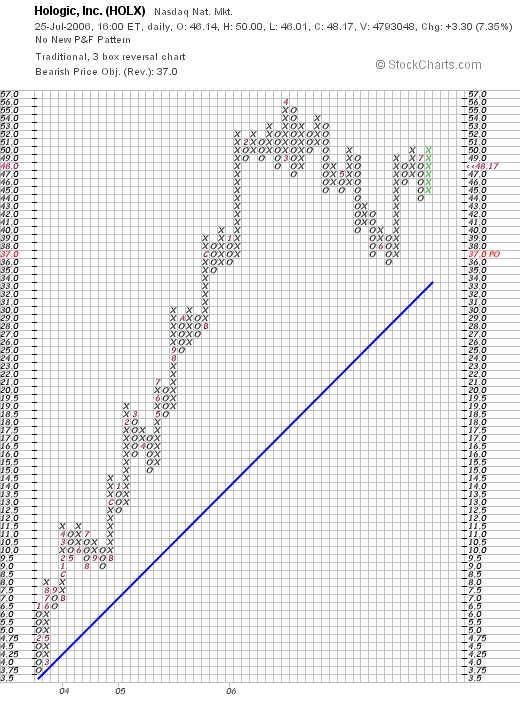
We can see a beautiful graph with an almost perfectly ascending price progression until May, 2006, when the stock sold off down to almost its support level. The stock appears to be appreciating once again.
So what do i think? I think the company reported a terrific quarter, has an outstanding Morningstar.com report (except for the very mild dilution of shares), and has a nice chart. Valuation, however, appears a bit rich and the stock thus appears to be "priced to perfection." Hopefull the company will continue to deliver perfect results. Certainly, the company's digital mammographer is selling well and this type of cancer detection may have some advantages over prior diagnostic procedures. with the p/e in the 60's and even the forward p/e in the 40's, fortunately we have a PEG just over 1.2. Even as measured by the Price/Sales ratio, the stock price appears rich. And profitability is not quite so phenomenal either. Only the rapid growth in earnings will continue to drive the stock higher.
Anyhow, that's the pick for this afternoon! A great performance from last year. Hopefull, for my son and my stock club, the stock will continue to perform well. Valuation, however, is a bit rich for what you are getting imho.
Thanks again for stopping by! If yhou have any comments or questions please feel free to leave them on the blog or email me at bobsadviceforstocks@lycos.com. Also, please be sure to stop by and visit my Stock Picks Bob's Advice Podcast Website!
Bob
Posted by bobsadviceforstocks at 3:10 PM CDT
|
Post Comment |
Permalink
Updated: Tuesday, 25 July 2006 5:30 PM CDT
Saturday, 22 July 2006
"Looking Back One Year" A review of stock picks from the week of April 4, 2005

Hello Friends! Thanks so much for stopping by and visiting my blog, Stock Picks Bob's Advice. As always, please remember that I am an amateur investor, so please remember to consult with your professional investment advisors prior to making any investment decisions based on information on this website.
One of my weekend tasks that I try to address is the review of past stock picks on this blog. For ease of evaluation, I use a "buy and hold" assumption of past picks. In reality, I advocate and employ a disciplined buying and selling strategy with all of the stocks that I choose to own. This of course would affect the ultimate price performance of any investment.
Since I have again missed a couple of weeks in this review process, my trailing 52 weeks is getting closer to a trailing 65 weeks! In fact, I did review the week of March 28, 2005, but there weren't any stocks "picked" that week. My previous full review was on June 24, 2006 when I reviewed past picks from the week of March 21, 2005. Thus, I am now up to the week of April 4, 2005, which was a busy week for me on the blog! Let's take a look at those stock picks and see how they would have performed if we had purchased equal dollar amounts of the selections.

On April 4, 2005, I posted Jos A. Bank (JOSB) on Stock Picks Bob's advice when it was trading at $31.88. JOSB had a 5:4 stock split on 2/16/06, making my effective pick price actually only $23.88. JOSB closed on 7/21/06 at a price of $25.64 giving me a gain of $1.77 or 7.4% since "picking" the stock.
 On June 8, 2006, JOSB announced first quarter 2007 results. For the quarter ended April 29, 2006, sales increased 17.7% to $113.7 million as compared with $96.6 million in the same quarter last year. Comparable store sales grew 4.7% during the period and combined catalog and internet sales climbed 25.0%. Net income, however, declined to $5.9 million or $.32/share, down from $6.7 million or $.38/share the prior year.

On April 5, 2005, I posted Greif Inc. (GEF) on Stock Picks Bob's Advice when it was trading at $74.06. GEF closed at $67.97 on 7/21/06, for a loss of $(6.09) or (8.2)% since posting.
 On May 31, 2006, GEF announced 2nd quarter 2006 results. For the quarter ended April 30, 2006, net sales grew 1% to $620.1 million from $613.0 million in the same quarter last year. GAAP net income came inat $28.7 million or $.97/diluted Class A share and $1.49/diluted Class B share, compared to GAAP net income of $16.8 million or $.57/diluted Class A share and $.88/diluted Class B Share in the prior year.
 On April 7, 2005, I posted Bed Bath and Beyond (BBBY) on Stock Picks Bob's Advice at a price of $40.80. BBBY closed at $32.62 on 7/21/06 for a loss of $(8.18) or (20.0)% since listing.
On June 21, 2006, BBBY reported 1st quarter 2006 results. For the quarter ended May 27, 2006, net sales were $1.396 billion, a 12.2% increase from net sales of $1.244 billion in the same quarter in 2005. Net earnings for the quarter came in at $100.4 million, or $.35/diluted share, up from $98.9 million or $.33/diluted share the prior year. During the quarter, the company reported comparable store sales growth of 4.9%, better than the 4.4% same store growth in sales reported last year.

Finally, on on April 8, 2005, I posted Buckle (BKE) on Stock Picks Bob's Advice when the stock was trading at $35.60. Buckle closed at $37.90 on 7/21/06 for a gain of $2.30 or 6.5% since posting.
On May 18, 2006, Buckle reported 1st quarter results. For the quarter ended April 29, 2006, sales came in at $109.6 million, up from $105.5 million. Income increased to $9.4 million or $.47/share, up from $8.6 million or $.40/share in last year's same quarter. However, same store sales, a better indicator imho of the long-term potential of a retail firm, declined (1.3)%. Thus, even though sales overall grew, this result was influenced by new store openings and results were not quite as encouraging taking into consideration the shrinkage of same store sales results.
So how did I do for that week in April last year? Well, the average performance of the four stocks listed came in at a loss of (3.6)% with two stock losing and two stocks gaining....but the loss in BBBY biased the entire group into a losing result.
Thanks so much for stopping by and visiting! If you have any comments or questions, please feel free to leave them on the blog or email me at bobsadviceforstocks@lycos.com. Also, please be sure to stop by and visit my Stock Picks Bob's Advice podcast website!
Bob
Posted by bobsadviceforstocks at 3:45 PM CDT
|
Post Comment |
Permalink
Updated: Saturday, 22 July 2006 7:09 PM CDT
Monday, 17 July 2006
"Trading Transparency" Barnes Group (B)
Hello Friends! Thanks so much for stopping by and visiting my blog, Stock Picks Bob's Advice. As always, please remember that I am an amateur investor, so please remember to consult with your professional investment advisors prior to making any investment decisions based on information on this website.
I confess that all of this bear market is wearing me down! Earlier today, I sold one of my remaining twelve holdings in my trading account: Barnes Group (B) that hit an 8% loss. In fact, I sold my 360 shares that were acquired 2/16/06 at a cost basis of $19.58/share at a price of $17.97. This represented a loss of $(1.61)/share or (8.2)5 since purchase. Again, since I sold this stock at a loss instead of on a gain, this is a negative internal signal of my portfolio telling me once again to hang on to the proceeds and sit on my hands.
I am now down to 11 positions from my maximum of 25, and still above my minimum of 6. Hopefully the crisis in the middle-east will soon be resolved and the markets will move higher once again. I hope I am not too much of a Polyanna about these international events.
Thanks so much for stopping by and visiting! If you have any comments or questions, please feel to leave them on the blog or email me at bobsadviceforstocks@lycos.com. Also, please be sure to come and visitn my Stock Picks Bob's Advice Podcast site where you can hear me talk about many of the same stocks I have been writing about the past several years.
Bob
Friday, 14 July 2006
July 14, 2006 Kinetic Concepts (KCI)
CLICK HERE FOR MY PODCAST
ON KINETIC CONCEPTS
Hello Friends! Thanks so much for stopping by and visiting my blog, Stock Picks Bob's Advice. As always, please remember that I am an amateur investor, so please remember to consult with your professional investment advisors prior to making any investment decisions based on information on this website.
 The market continues to back off with the Dow down 98.69 to 10747.60 as I write and the NASDAQ down 16.31 to 2037.80. Not wishing to get too discouraged, I decided to go ahead and scan the list of top % gainers on the NYSE
and came across Kinetic Concepts (KCI), trading as I write at $44.45, up $3.30 or 8.02% on the day. I do not own any shares nor do I have any options on this stock. In fact, I was planning to write this one up yesterday, but you know how that goes....one thing leads to another and pretty soon I haven't written anything at all! I shall try to keep this brief and get the information on this company posted this afternoon!
First of all, what does this company do? According to the Yahoo Profile on Kinectic, the company "...engages in the design, manufacture, marketing, and service of wound care and therapeutic products in the United States and internationally."
On April 25, 2006, KCI reported 1st quarter 2006 results. For the quarter ended March 31, 2006, total revenue increased 14% to $319.2 million. Net earnings increased 31% to $48.5 million and net earnings per share increased 29% to $.66/share.
Reviewing the 5-Yr Restated Financials from Morningstar.com, we can see revenue increasing steadily from $.5 billion in 2001 to $1.2 billion in 2005. Earnings per share increased from $1.67/share in 2005 to $1.82/share in the TTM. Free cash flow is positive with $204 million in 2003, $95 million in 2004 and $144 million in 2005. KCI reported $125 million in free cash flow in the trailing twelve months (TTM).
The balance sheet looks fine with $136.5 million in cash and $365.8 million in other current assets. With $200.6 million in curretn liabilities, this yields a current ratio of about 2.5. Long-term liabilities are not insignificant at $331.0 million, but the current assets are approximately equal to the combined short and long-term liabilities.
Looking at Yahoo Key Statistics on KCI, we can see that this is a large cap stock with a market capitalization of $3.2 billion. The trailing p/e is moderate at 24.45, but the forward p/e is even nicer at 14.78 (fye 31-Dec-07). Thus, with the rapid growth, the PEG works out to 0.91.
Reviewing the Fidelity.com eResearch website, we can see that this company is in the "Medical Appliances/Equipment" industrial group. Within this group, the stock's valuation is quite reasonable as measured by the Price/Sales ratio with this company coming in dead last at 2.4. Topping this group is Medtronic (MDT) with a Price/Sales ratio of 5.1, followed by St. Jude (STJ) at 4.2, Zimmer (ZMH) at 4.2, Biomet (BMET) at 3.9 and Edwards Lifesciences (EW) at 2.9.
Interestingly, looking at profitability, even though this company is the cheapest in valuation it is top in profitability with a return on equity of 73.2%. This is followed by Biomet at 25.9%, Medtronic at 23.8%, Zimmer at 16.6%, St. Jude at 14.4% and Edwards Lifesciences at 13.8%. This is an interesting combination of a cheap stock with great profitability.
Going back to Yahoo for some more numbers, we find that there are 71.68 million shares outstanding wtih 57.9 million that float. Currently, as of 6/12/06, there were 1.64 million shares out short representing 2.8% of the float and only 2.5 trading days of average volume (the short ratio). No dividend is paid and no stock split is reported.
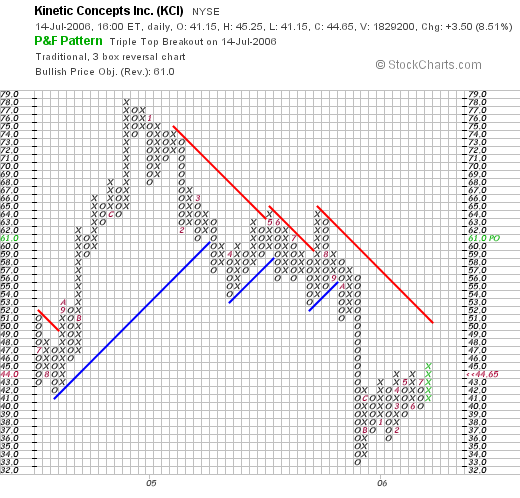
Looking at the StockCharts.com "Point & Figure" chart on KCI, we can see that this stock was trading much higher as recently as December, 2004, when the stock price hit $78/share. The stock has more recently been under pressure, with a drop to $33/share in July, 2005. Since that point, the stock has been trading higher to the current level of $44.65/share. Long-term the graph looks awful in my humble opinion, but short-term looks a little more promising:
So what do I think about this stock? Well it is an interesting company that has been moving higher the past two days in an otherwise very weak market. I suspect that earnings are due....maybe investors think the news will be strong (?). The last quarter was great, the Morningstar.com report looks nice, and valuation is attractive with a p/e in the low 20's, a PEG under 1.0, a Price/Sales ratio the lowest in its group and the profitability, as measured by return on equity (ROE), the highest in its group. Finally the chart looks interesting....the stock price does appear to be moving higher after a significant correction in valuation.
Anyhow, that's my stock for today! Thanks so much for stopping by and visiting! Please note that although I write up a stock today, I do not recommend purchase of any stock unless one has a "buy signal" generated by your own portfolio....that is one of your stocks is at a partial sale point due to price appreciation. If you have any comments or questions, please feel free to email me at bobsadviceforstocks@lycos.com or just leave them on the blog. Also, please be sure to stop by and visit my Podomatic.com podcast site!
Bob
Posted by bobsadviceforstocks at 3:53 PM CDT
|
Post Comment |
Permalink
Updated: Friday, 14 July 2006 8:42 PM CDT
Thursday, 13 July 2006
"Trading Transparency" Toro (TTC)
Hello Friends! Thanks so much for stopping by and visiting my blog,
Stock Picks Bob's Advice. As always, please remember that I am an amateur investor, so please remember to consult with your professional investment advisors prior to making any investment decisions based on information on this website.
A few moments ago I sold my 120 shares of Toro (TTC) when it hit an (8.9)% loss. The shares were sold at $44.06. I had purchased these shares just a few weeks ago on 5/25/06 at a cost of $48.36. As I do with sales on bad news, I shall be sitting on my hands once again as my portfolio continues to shrink in the face of the ever-continuing bear market.
Thanks so much for stopping by. I hope you are faring better than I am! If you have any comments or questions, please feel free to email me at bobsadviceforstocks@lycos.com or just leave your comments on the blog. Also, be sure to visit my
Stock Picks Bob's Advice podcast site.
Bob
Wednesday, 12 July 2006
"Trading Transparency" Genesco (GCO)
Hello Friends! Thanks so much for stopping by and visiting my blog,
Stock Picks Bob's Advice. As always, please remember that I am an amateur investor, so please remember to consult with your professional investment advisors prior to making any investment decision based on information on this website.
The market continues to dictate my actions. A few moments ago another of my recent purchases, Genesco (GCO) hit an 8% loss and I sold my shares. The exact details were 200 shares of Genesco sold this morning at $31.59. I had purchased these shares 5/26/05 at a cost basis of $34.40/share. Thus, my loss was $(2.81) or (8.17)% since my purchase.
This brings my portfolio down to 13 positions from my maximum planned of 25, and still above my minimum level planned of 6 positions. I, as you know, shall once again be sitting on my hands, as I like to say, with the proceeds. I am still waiting for a sale on good news to give me the permission slip to add a new position to my shrinking :( portfolio.
If you are new to the blog, I use a sale at a targeted appreciation point to allow me to add a new position in my trading portfolio. By not re-investing stocks sold on bad news, I have a primitive system of responding to market activity: moving into cash in bad markets and moving back into equities when things are going well. We all try to do this; the only difference is that my particular approach doesn't require me to make that decision. I allow my own stocks to dictate my response to market action. Time will tell how successful this approach shall be!
Thanks again for visiting. If you have any comments or questions, please feel free to leave them on the blog or email me at bobsadviceforstocks@lycos.com. If you have an mp3 that you can send me with a comment or question, please do so at bobsadviceforstocks@podomatic.com so that I can include it in my
Stock Picks Bob's Advice Podcast!
Bob
Tuesday, 11 July 2006
"Revisiting a Stock Pick" Perficient (PRFT)
Hello Friends! Thanks so much for stopping by and visiting my blog,
Stock Picks Bob's Advice. As always, please remember that I am an amateur investor, so please remember to consult with your professional investment advisors prior to making any investment decisions based on information on this website.

I was looking through the
list of top % gainers on the NASDAQ today and came across an old favorite of mine; in fact, a stock that I also had owned in the not too distant past: Perficient (PRFT). Perficient closed at $13.45, up $1.32 or 10.88% on the day.
I first
posted Perficient on Stock Picks Bob's Advice on March 4, 2005, when the stock was trading at $9.33. With today's close at $13.45, this represents a nice gain of $4.12 or 44.2% since posting this stock a little over a year ago. Unfortunately, I was unable to hang on to my shares which I purchased on 3/4/05 at $9.26, and then sold them rather quickly with a (10.7)% loss on 3/8/05 at $8.37. As I had pointed out on my post when I purchased shares, stocks at $10 or less are quite volatile, and if you wish to stick to 8% loss limits, you are rather likely to get 'shaken out'.
Let's take another look at this stock. I shall, in my effort to keep posts easy for me, limit the pictures and get right to the information.
According to the
Yahoo "Profile" on Perficient, the company
"...provides information technology consulting services primarily to Global 2000 and midsize companies in the United States. It engages in the design, building, and delivery of ebusiness solutions using a set of software products."
Looking through the
Yahoo "headlines" on Perficient to see why the stock moved higher, we can see that the company
raised 2nd quarter revenue guidance, with revenue now expected between $36.6 million to $37.7 million, up strongly from prior guidance of revenue of $31 to $32.8 million. Once again, we can see the effect of both the growth in revenue as well as the company's
guidance for the street affecting the stock price in a very direct fashion!
Looking for the latest quarterly results, I found the
1st quarter 2006 results for PRFT, which was reported on May 3, 2006. Total revenue climbed 50% to $29.6 million from $19.7 million the prior year same period. GAAP earnings per share came in at $.07/share, up from $.06/share last year. This year's results is better than it appears, as this year now includes appropriate inclusion of the cost of "non-cash stock compensation" this year, compared to last year when no such expense was included.
How about longer-term results? Reviewing the
Morningstar.com "5-Yr Restated" financials, we see the steady growth in revenue from $20.4 million in 2001 to $97 million in 2005 and $106.9 million in the trailing twelve months (TTM).
Earnings have increased from a loss of $(7.01)/share in 2001 to a profit of $.07 in 2003 and a profit of $.29/share in the TTM. On a negative note, the company certainly
has been growing quickly, but has apparently done so with acquisitions and the floating of additional shares of stock. While PRFT has 6 million shares in 2001, this grew to 22 million in 2005 and 25 million shares in the TTM. Hopefully a greater portin of Perficient's growth in the future will be from organic growth of existing businesses and less from acquisitions.
Free cash flow is positive and growing with $2 million in 2003, $4 million in 2004 and $7 million in 2005. They are reporting $8 million in free cash flow in the TTM.
The balance sheet according to Morningstar.com looks solid with $2.3 million in cash and $25.2 million in other current assets. Calculated, this works out to a current ratio of 2.8. Indeed, the total current assets can easily pay off the combined current and long-term liabilities which togeter add up to $11.8 million.
Looking at
Yahoo "Key Statistics" on PRFT, we find that this is a small cap stock with a market capitalization of $334.86 million. The p/e is rich at 46.88, but the company is growing so fast that the forward p/e is 23.26 and the PEG works out to a ratio of 1.07.
Using the
Fidelity.com eresearch website, we find that Perficient is in the "Business Software & Services" industrial group. Within this group, the stock is reasonably priced with a Price/Sales ratio of 3. Leading off this group is BEA Systems (BEAS) with Price/Sales ratio of 4. This is followed by First Data (FDC) at 3.2, Perficient at 3, Automatic Data Processing (ADP) at 2.9, Fiserv (FISV) at 1.9 and Business Objects (BOBJ) at 1.8.
Again, since this is a small company which is just now growing its profitability, it is priced based on future anticipated results and not the current profit. This is reflected in the ROE (Return on Equity) ratio. Topping this group is Fiserv at 19.7%, then First Data Corp. at 19%, Automatic Data Processing at 18.9%, BEA Systems at 13.2%, then Perficient at 11.8% and at the bottom is Business Objects at 5.8%.
Finishing up with Yahoo, we can see that there are 24.82 million shares outstanding with 21.99 million of them that float. As of 6/12/06, there were 921,510 shares out short representing 3.7 trading days of volume. This short interest represents 4.6% of the float, and does not appear very significant to me.
Looking at the
Perficient "Point & Figure" chart from StockCharts.com:
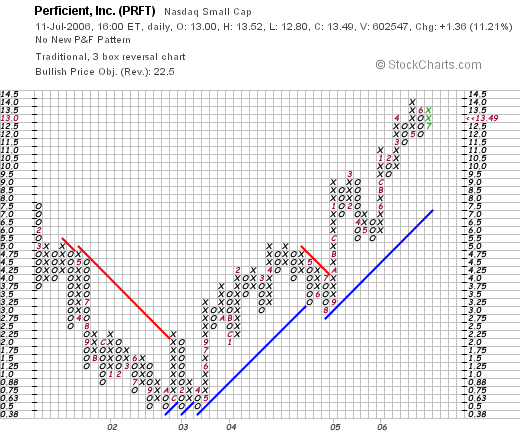
We can see that while the company moved lower between January, 2001, when it was trading as high as $7.50, dropping to a low of $.50/share in September, 2002, the stock subsequently and certainly since last year when I first posted the stock, has been moving ahead strongly and steadily.
So what do I think of the stock? Well I liked it enough last year to buy some shares :). I don't own any shares or options now. However, the strong guidance to higher revenue numbers is encouraging. The latest quarterly report was encouraging, especially with the added accounting requirements. Morningstar.com looked good except for the fairly significant growth in the float the past few years. And valuation, while not that exciting, still came in with a PEG just over 1.0, and other numbers in the middle of their group. The balance sheet is solid, and the company is spinning off growing amounts of free cash. Finally, the chart still looks strong, and certainly the stock has been on a tear since last year!
Thanks so much for stopping by! If you ahve any comments or questions, please feel free to leave them on the blog or email me at bobsadviceforstocks@lycos.com. Also, don't forget to drop by and visit my Stock Picks Bob's Advice Podcast site.
Bob
Sunday, 9 July 2006
A Reader Writes: 'Instructions on how to send an mp3?'
Hello Friends! Thanks so much for stopping by and visiting my blog,
Stock Picks Bob's Advice. As always, please remember I am an amateur investor, so please remember to consult with your professional investment advisors prior to making any investment decisions based on information on this website.
Keith from Melbourne, Florida, was kind enough earlier this week to let me know that my latest podcast was missing the final ten minutes. I corrected the problem, although I did overlap about 30 seconds...I shall work on my Audacity skills....I promise!
I encouraged Keith, as I did all of you, to consider sending me an mp3, or an audio clip that I would be happy to include in my
podcast website. He wrote:
"Bob
It is repaired. I was able to download it but it went right into Qucktime so I was not able to download it to my IPOD or even save it to my HD. I was hoping to be able to do it so I could save it and listen to again.
Also thank you for the shout out. I will check out the microphone to send you an MP3. Could you put the instructions or site on your Blog?
Thanks
Keith
Let me try to answer your question Keith. First of all, the easiest thing to do, imho, is to pick up an inexpensive headphone/microphone combination at Best Buy, Circuit City, or your local electronics/business store. (I don't have any stock in those two, it is just I have access to Best Buy).
If you go to my
main podomatic page..you should see a place to leave comments along the right side of the page. You can either directly record these comments on Podomatic or you can create an mp3 file with freeware like Audacity or Garage Band if you have a Mac...this is a little harder because as I understand it you need to export it into iTunes then export it back to your desktop as an mp3...I prefer Audacity.
You can find Audacity by going to http://audacity.soundforge.net and download it for free. If that link doesn't work just search under "Audacity recording software" on Google.
Let me know how this works and looking forward to including my first guest mp3 into the podcast. Let me know how your club is doing and what you all think of my process....Thanks again Keith!
Bob
Posted by bobsadviceforstocks at 8:22 AM CDT
|
Post Comment |
Permalink
Updated: Sunday, 9 July 2006 10:40 PM CDT
Monday, 3 July 2006
Sirenza Microdevices Inc. (SMDI) July 3, 2006
CLICK HERE FOR MY PODCAST ON SIRENZAHello Friends! Thanks so much for stopping by and visiting my blog,
Stock Picks Bob's Advice. As always, please remember that I am an amateur investor, so please remember to consult with your professional investment advisors prior to making any investment decisions based on information on this website.

I hope you all had a chance to read through my previous post on
"My Investment Strategy". As I go through this review, I think you will see how this all fits in.
Looking for a candidate to review this afternoon, I started with the
list of top % gainers on the NASDAQ. After examining several of the names on this list, I came across Sirenza Microdevices (SMDI) which closed at $13.52, up $1.38 or 11.37% on the day. I do not own any shares nor do I have any options on this stock.
According to the
Yahoo "Profile" on Sirenza, the company
"...engages in the design and supply of radio frequency (RF) components for the commercial communications, consumer and aerospace, defense, and homeland security equipment markets. The company’s products receive and transmit voice and data signals in mobile wireless communications networks, as well as in other wireless and wireline applications in the United States and internationally."
On May 3, 2006, SMDI
announced 1st quarter 2006 results. The company reported revenue for the quarter ended March 31, 2006, of $20.9 million, a 72% increase over the $12.1 million reported in the same quarter last year. In addition, this was a 7% sequential increase in revenue over the immediately preceding quarter. Net income was $1.6 million or $.04/share compared to a net loss of $(1.8) million or $(.05)/diluted share in the prior year same quarter.
On a longer-term basis, if we review the
Morningstar.com "5-Yr Restated" financials on SMDI, we can see a steady increase in revenue from $19.8 million in 2001 to $64.2 million in 2005 and $72.9 million in the trailing twelve months (TTM0.
Earnings have turned around from a loss of $(.67)/share in 2001 to a profit of $.01/share in 2004, $.04/share in 2005 and $.13/share in the trailing twelve months.
The company
has been increasing its float (and I believe using the shares for acquisitions) increasing the number of shares outstanding from 29 million in 2001 to 35 million in 2005 and 45 million in the TTM. This 50% increase in shares outstanding was apparently effective as the company grew its revenues almost 400% and turned from a loss of $(.67)/share ot a profit of $.13 in this same period of time.
Free cash flow which also was a negative $(10) million in 2003, improved to $2 million in 2004, $6 million in 2005 and $10 million in the trailing twelve months.
The balance sheet looks solid with $24.9 million in cash reported, enough to pay off
both the $12.3 million in current liabilities and the $.3 million in long-term liabilities combined almost twice over. Calculating the current ratio, with total current assets adding up to $46.7 million, compared with the $12.3 million in current liabilities gives us a ratio of 3.8. Also appearing quite healthy.
Looking at the
"Key Statistics on SMDI from Yahoo", we see that this is a mid-cap stock with a market capitalization of $605.07 million. The trailing p/e is
rich at 108.16, but the company is just turning profitable and estimates allow a forward p/e (fye 31-Dec-07) of only 22.53. Thus, even though the p/e is currently over 100, the PEG is only 1.22.
Using the
Fidelity.com eresearch website, we find that the company is in the "Semiconductor-Integrated Circuit" industrial group. The Price/Sales ratio also appears rich relative to this group with Sirenza (SMDI) coming in at 6.5. This is only exceeded by Marvell (MRVL), and followed by Broadcom (BRCM) at 6.1, Semtech (SMTC) at 4.6, RF Micro Devices (RFMD) at 1.5 and Skyworks (SWKS) at 1.1.
Regarding profitability, this company is in the middle of its group with a return on equity (ROE) of 9.6%. Tops in the group is Broadcom (BRCM) at 15.6%, followed by Marvell (MRVL) at 11.7%, Semtech (SMTC) at 9.9% the SMDI, then RF Microdevices (RFMD) at 2.9% and Skyworks (SWKS) at 2%.
Finishing up with Yahoo, we can see that there are 44.75 million shares outstanding with 24.84 million that float. Currently there are 1.63 million shares out short (6/12/06) representing 5.70% of the float or 2.7 trading days of volume (under my 3 day cut-off for significance in this "short ratio").
No dividend is paid and no stock split is reported on Yahoo.
If we review the
"Point & Figure" chart on Sirenza from StockCharts.com:
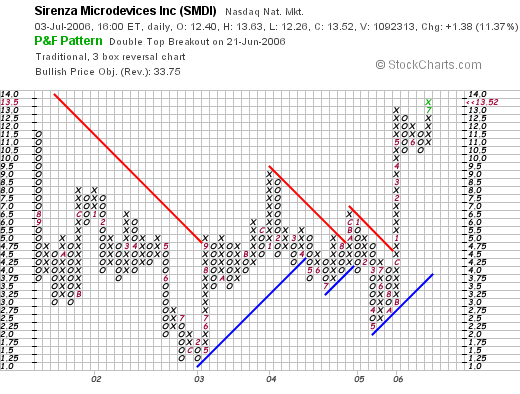
We can see that this stock, which traded down from $11.50 in July, 2001, to a low of $1.25 in February, 2003, then moved higher in a step-wise and tentative fashion, finally decisively breaking out into higher price ranges in December, 2005, breaking through resistance at $4.50 and moving to the current range of $13. The stock appears to have broken higher once again and overall, the chart looks fine to me.
So to summarize, here is a stock in the semiconductor area that moved higher today. The latest quarter was quite strong and the Morningstar.com report looks very consistently strong the past five years. Valuation is rich both in terms of p/e and Price/Sales but the company is improving its earnings so quickly that the PEG is under 1.5. Finally the chart looks encouraging.
Anyhow, that's the pick for today! Thanks again for stopping by and visiting. Please drop me a line at bobsadviceforstocks@lycos.com if you have any comments or questions. Also, be sure and listen to my Stock Picks Bob's Advice Podcast Site.
Bob
Posted by bobsadviceforstocks at 1:36 PM CDT
|
Post Comment |
Permalink
Updated: Monday, 3 July 2006 11:36 PM CDT
Saturday, 1 July 2006
My Investment Strategy
CLICK HERE FOR MY PODCAST ON INVESTMENT STRATEGYHappy 4th of July everyone!

I wanted to share with you this picture of the Star Spangled Banner from the Smithsonian. I had a chance to visit the Smithsonian a couple of years ago and that flag still stays in my memory and the effort that has gone into preserving it for future generations. Thank you Smithsonian.
Getting off of my patriotic platform, I wanted to spend a few moments this evening restating the purpose of this blog, my thoughts on investing, and my strategy for dealing with markets whether they be bear markets or bull markets.
Please remember that I am an amateur investor, so please consult with your professional investment advisors prior to making any investment decisions regarding your own investments. However, I have been investing for 38 almost 39 years now. I have read much, and I have had my share of losses as well as gains, and I have been distilling my thoughts into this approach which is what this blog is really about.
There are four basic parts of my approach that I would like to share with you in no particular order. The first thing I would like to discuss is the overall approach to the portfolio, that is how do I manage my portfolio, especially in response to market forces and to individual stock performance.
I have found that I am basically unable to accurately guess the future direction of the market. I do not know from one day to the next whether the market will be rising or falling the upcoming day or week or even year. Maybe others have better luck, but I don't presume this ability.
Thus, I have chosen a more passive technique for managing my portfolio. I have labeled this approach my "zen" approach, meaning that I am trying hard to listen to my portfolio, the stocks that I do own, as they through their own actions "talk" to me. (Is this too touchy-feely or what?).
Simply put, my stocks can do one of two things that affect my trading activity: they can either rise in price and reach targeted sale points, an event that I refer to as "good news"; or they can drop in price and reach sale points, an event that I refer to as "bad news." Alternatively, stocks may experience "bad news" meaning actual news that I choose to interpret as being fundamentally bad. I try not to make this judgment too often but I do reserve the right to intervene to sell stocks on these real news events.
And how do these events affect my strategy? Long ago I accepted the wisdom of limiting losses when they were small, and started to sell stocks at 8% losses. This particular rule was adopted from William O'Neill and the CANSLIM approach of Investors Business Daily. I could understand that avoiding large losses was important. However, I found myself buying additional stocks after a sale at a loss, and then rather quickly being handed an additional loss after selling the second stock at another 8% loss. In other words, the market was compounding my losses for me. This simply didn't make sense.
Thus, I have decided that after selling a stock at a loss, that I would not immediately re-invest the proceeds. Instead I would "sit on my hands" until I had a different signal that it would be time to buy.
This is where the "good news" comes in. If we are to assume that sales within our portfolios are indicative of a poor investment climate, it is also reasonable to assume that our portfolio should also be generating "good news" or signals that it is time to add a position. Since I have used a sale on the downside as "bad news" it makes sense to use a sale on the upside as "good news".
It is this good news/bad news dichotomy that drives my portfolio into equities from cash and back into cash again. I like to credit Robert Lichello who wrote "How to Make $1,000,000 in the Stock Market-Automatically with some of this philosophy and strategy that he developed to move money into and out of mutual funds by his own strategy. I use nothing like what he did, but he inspired me to think about this approach.
Since I cannot endlessly add positions, and at the same time, I cannot go down to zero positions as I use my positions to give me information, I decided upon 25 positions as my maximum and 6 positions as my minimum number of holdings. I suggest to people that they start at 12 positions, which would be "neutral" with 50% of their cash invested. Then, they would either drop down to 6 or up to 24 (or 25) on good news.
The next thing I want to touch on is my selling strategy for individual holdings that I referred to in the above discussion. First the bad news selling. As I indicated above, after an initial purchase, I sell if a stock drops to an 8% loss. When I sell on events that I refer to as "bad news", I sell the entire position, all of the shares that I own.
After making a single partial sale on "good news", which for me the first targeted partial sale is at a 30% appreciation point, then, if the stock starts to decline, I like to sell the stock entirely at break-even, keeping to the well-established doctrine of avoiding letting a stock which you had a profit, develop a loss.
However, if I have made partial sales more than once, for instance, twice: once at 30% and once at 60% appreciation points, then I allow a stock to retrace only 50% of the highest appreciation sale point. That is if a stock had a partial sale at both 30 and 60% points, then I would sell all of my remaining shares if the stock retraced back to a 30% appreciation point from the original purchase.
As noted above, whenever I sell shares on "bad news", I sit on my hands. I do not go out and buy a different stock hoping this time it would do better. I use this sale as a signal to pull back from the market. I "listen" to my portfolio!
What about sales on "good news"? Here I try to stay with my basic philosophy of "selling declining stocks quickly and completely, and selling gaining stocks slowly and partially." What do I mean by this?
I have already shared with you my strategy for selling on the downside. On the upside, I have established targeted appreciation points to make small, partial sales of my positions. While originally selling 1/4 of my remaining shares at each sale point, I realized the size of the positions was dwindling and I needed to either stretch out the intervals or reduce my sale amount. Choosing the latter, I have recently been selling 1/6th of my positions at each targeted appreciation point...and this has been working well at maintaining the size of the positions.
Currently, my targeted sale points are in groups of four: 30, 60, 90, and 120% appreciation points, then 180, 240, 300, and 360% appreciation, then 450, 540, 630, and 720%....etc. These appreciation points are rather arbitrary, but at each of these points my system directs me to sell 1/6th of my holding and to use the proceeds along with additional funds to add a new position to the portfolio as long as I am under my 25 position maximum. At the maximum, the proceeds would be just placed in cash, awaiting a future purchase.
How do I determine which stocks to buy? This is what all of my stocks that I discuss is about. Stocks that are suitable for buying by my strategy, are stocks which on the day that I have "permission" to add a new position are they themselves on the top % gainers list. Other criteria include a latest quarterly result with both increased revenue and earnings (beating expectations and raising guidance is a plus!) In addition, I want to see consistent revenue and earnings growth on the Morningstar report and positive free cash flow, without too much of a growth in the number of shares outstanding. Also, the balance sheet should show an abundance of assets and a scarcity of liabilities :). If possible, some valuation numbers including a PEG between 1.0 and 1.5, and a Price/Sales ratio not too high in its group, and a Return on equity that is high for its group. I also like to see lots of short-sellers who might be in the midst of a squeeze. I review point and figure charts and simply put, just like to see a chart with the price moving steadily higher.
Anyhow, THAT's a mouthful for this evening. I haven't talked much about my strategy for awhile, and knowing how many new people just drop by here and depart, I wanted to have another chance to share this philosophy and investing strategy that I have been employing with all of you readers and listeners!
Have a healthy and safe 4th of July!
If you have any comments or questions, please feel to write me at bobsadviceforstocks@lycos.com and be sure to listen to my Stock Picks Bob's Advice Podcast Site
Bob
Posted by bobsadviceforstocks at 10:43 PM CDT
|
Post Comment |
Permalink
Updated: Friday, 7 July 2006 10:48 PM CDT
Newer | Latest | Older


