Stock Picks Bob's Advice
Monday, 25 September 2006
Harris Corporation (HRS)
Hello Friends! Thanks so much for stopping by and visiting my blog, Stock Picks Bob's Advice! As always, please remember that I am an amateur investor, so please remember to consult with your professional investment advisors prior to making any investment decisions based on information on this website.
 I would like to try to briefly present a stock this afternoon that made the list of top % gainers on the NYSE. As I write, Harris Corp. (HRS), is trading at $44.25, up $1.28 or 2.98% on the day. I do not own any shares or have any options on this company. I do think it deserves a place on this blog!
According to the Yahoo "Profile" on Harris, the company "...through its subsidiaries, provides communications products, systems, and services to government and commercial customers. It operates in four segments: Government Communications Systems, RF Communications, Microwave Communications, and Broadcast Communications."

What drove the stock higher today was an announcement that due to a positive settlement between Harris and the IRS, the company was raising guidance by $.08 for the year ending in June, 2007, from $2.60 to $2.70 to $2.65 to $2.75/share.
On July 26, 2006, Harris reported 4th quarter 2006 results. Revenue increased 21% to $992 million, up from $822 milliion in the same quarter last year. GAAP net income climbed by 39% to $85.1 million or $.61/diluted share. At that same announcement, the company raised guidance for full 2007 from $2.50 to $2.60 to $2.60 to $2.70/share. As I just noted above, the company today raised guidance once more! Besides raising guidance for the 2007 year, the company 'beat the street' reporting results ahead of expectations of $965 million in revenue and $.60/share in earnings. This is what I have referred to elsewhere as my trifecta-plus in a quarterly report: increasing revenue, increasing earnings, beating expectations AND raising guidance! Not much an investor could ask for imho.
Reviewing the Morningstar.com "5-Yr Restated" financials, we can see the steady revenue growth from $1.8 billion in 2002 to $3.5 billion in 2006. Earnings, after dipping from $.62/share in 2002 to $.45/share in 2003, have steadily increased to $1.46 in 2005 and $1.71 in 2006. The company has also steadily increased its dividend from $.10/share in 2002 to $.24/share in 2005 and $.32/share in 2006. Meanwhile, the shares outstanding have been virtually unchanged with 132 million shares in 2003, 133 million in 2006 and 134 million in the trailing twelve months (TTM).
Free cash flow has been positive at $223 million in 2004 and $232 million in 2006.
The balance sheet on Morningstar.com looks solid with $293.9 million in cash and $1,134.5 million in other current assets. When combined and compared to the $752.1 million in current liabilities, yields a current ratio of 1.90.
In addition, the company has another $728.1 million in long-term liabilities.
Looking at Yahoo "Key Statistics" on HRS, we can see that this is a large cap stock with a market capitalization of $5.94 billion. The trailing p/e is a moderate 25.98, and the forward p/e is estimated (fye 30-Jun-08) at 14.65. The PEG, with the rapid growth anticipated, is estimated at 0.99 making this valuation very reasonable imho.
According to the Fidelity.com eresearch website, HRS is in the "Communications Equipment" industrial group. Harris is reasonably priced per this site, with a Price/Sales ratio of 1.8. Leading this group is Qualcomm (QCOM) with a ratio of 9.2, followed by Adtran (ADTN) at 3.4, HRS at 1.8, Nokia (NOK) at 1.7, Motorola (MOT) at 1.5 and ADC Telecom (ADCT) at 1.3.
Relative to profitability, as measured by the return on equity (ROE), HRS is towards the bottom of the pack with an ROE of 15.2%. Leading the group is Nokia at 35.4%, Motorola at 30.1%, Adtran at 19.5%, Qualcomm at 19.3%, then HRS at 15.2% and ADC Telecom at 5.8%.
Per Yahoo, there are 133.86 million shares outstanding with 132.83 million that float. As of 8/10/06, there were 3.09 million shares out short representing 2.30% of the float or 3.3 average trading days of volume (the short ratio). The company, as noted, pays a small dividend of $.44/share (est.) for a 1% yield. The company had a 2:1 stock split last year on March 31, 2005.
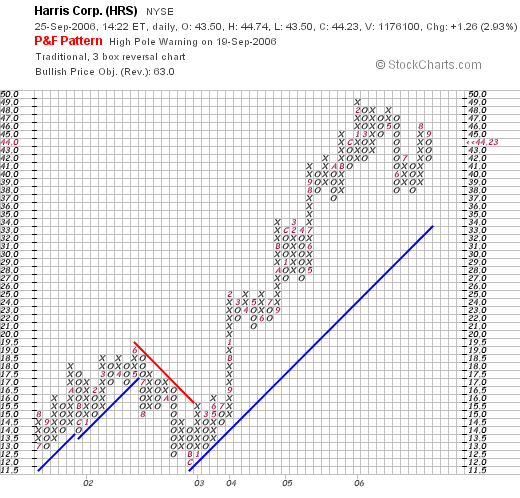
How about the chart? If we examine a Point & Figure chart from StockCharts.com on Harris, we can see that the stock price, after climbing to $19 from $13 between July, 2001, and June, 2002, then fell to a low of $12 in December, 2002. Since that time, after breaking through resistance at about $15.50, the stock has moved very strongly higher to a recent high of $49 in February, 2006. The stock has consolidated somewhat the past several months and is currently at the $44 level. The stock chart looks strong to me!
In conclusion, the stock moved higher today in a steady fashion after guidance was raised again on next year's results. The company had a great recent quarter, beating expectations and raising guidance in addition to reporting solid growth in both revenue and earnings. Longer-term, the company has demonstrated a rather consistent growth in revenue with a slightly less consistent growth in earnings (although the last several years have been solid.) As an additional 'plus' the company even pays a dividend and has been increasing it each year as well. All of this on a steady number of shares outstanding.
Free cash flow is positive and the balance sheet is solid. Valuation-wise the p/e is mildly high, but with the steady growth the forward p/e is in the teens and the PEG sits at 0.99. The price/sales is average, and Return on Equity is a bit low for its group. Finally the chart looks solid.
All-in-all, I like this stock. I haven't had lots of success with defense contractors and I put this company in that group, but the numbers look nice, valuation is reasonable, and the dividend growth is also attractive. If I were in the market to be buying a stock, this is the kind of stock I would be buying today!
Thanks so much for stopping by. If you have any comments or questions, please feel free to drop me a line at bobsadviceforstocks@lycos.com or just leave them on the blog. Also, please stop by and visit my Stock Picks Bob's Advice podcast site, where you can download an mp3 and hear me talk about many of the same stocks I write about right here!
Bob
Sunday, 24 September 2006
"Weekend Trading Portfolio Analysis" Starbucks (SBUX)

Hello Friends! Thanks so much for stopping by and visiting my blog, Stock Picks Bob's Advice! As always, please remember that I am an amateur investor, so please remember to consult with your professional investment advisors prior to making any investment decisions based on information on this website.
Another weekend task that I like to do around these parts is to review stocks that I actually own in my "trading portfolio". Eventually (today?) I shall try to update my trading portfolio link along the left side of this blog. Meanwhile, I shall continue to update you on my positions on a regular basis. Currently, I am trying to post a review of each holdings going alphabetically through my shortened list of holdings (still standing at eleven). Reviewing about every two weeks, my last review what on September 9, 2006, when I reviewed my ResMed holding. Going alphabetically, my next position is Starbucks (SBUX). Let's take another look at this company.
 I currently own 50 shares of Starbucks (SBUX) that were purchased on 1/24/03 with a cost basis of $11.40. SBUX closed at $34.01 on September 22, 2006, for an unrealized gain of $22.61 or 198.3% since my purchase on my remaining shares.
This is my oldest position of my eleven stocks. Unfortunately early on in my investment strategy, I was selling 1/4 positions of my holdings at targeted gains. (Now I sell 1/6th of my remaining positions). Also, I didn't buy a large position of Starbucks initially. These two factors have combined to result in a smaller current position in this terrific stock! However, I continue to manage this holding as I do all of my positions.
I have sold portions of SBUX as the stock has appreciated. That is, I sold 25 shares for a gain of $141.47 on 9/8/03, 15 shares on 1/23/04 for a gain of $185.33, 15 shares on 6/18/04 for a gain of $308.64, 10 shares on 12/3/04 with a gain of $350.78, 11 shares on 12/5/05 for a gain of $215.03, and my latest sale on 4/19/06 was 9 shares with a gain of $237.03. This represents six sales of portions of my holding at targeted appreciation points of 30, 60, 90, 120, 180, and 240% appreciation targets.
When will I be selling shares of SBUX next? Assuming no fundamentally bad news (for which I always reserve the right to arbitrarily sell all shares), I shall be selling 1/6th of my holding (8 shares) at a 300% appreciation target. This would be at a 4.00 x $11.40 = $45.60. On the downside, I would be selling all of my shares if the stock retraces to 50% of its highest appreciation sale, or at a 120% gain. Calculating this, 2.20 x $11.40 = $25.08.
Let's take another look at Starbucks and see how it is currently doing and whether it still deserves a spot on this blog!
1. What exactly does Starbucks (SBUX) do?
According to the Yahoo "Profile" on Starbucks, the company
"...engages in purchasing, roasting, and selling whole bean coffees worldwide. The company offers brewed coffees, espresso beverages, cold blended beverages, various complementary food items, premium teas, a line of compact discs, and coffee-related accessories and equipment, including drip and French press coffeemakers, espresso machines, and coffee grinders primarily through its retail stores. Starbucks also licenses its trademark for retail store operations, and grocery and warehouse club stores, as well as to produce and distribute its branded products. It also engages in producing and selling coffee drinks, espresso drink, and a line of ice creams."
2. Is there any recent news affecting the stock price?
There are many headlines on this company but the recent news of a 5 cents/drink increase in the price of beverages and an approximately 50 cents/pound increase in the price for its coffee beans suggested to analysts confidence that the company can maintain its estimated 5% same store sales increase. This news was taken positively about the company's prospects and appeared to be a bullish factor for the stock.
3. How did the company due in its latest quarterly report?
On August 2, 2006, Starbucks announced 3rd quarter 2006 results. For the quarter ended July 2, 2006, net revenues came in at $2 billion, a 23% increase over the prior year's third quarter. Net earnings climbed 16% to $145 million. Earnings per share were up 12.5% to $.18/share, up from $.16/share last year. In addition, the company reported same-store sales growth of 4% which was a bit lower than past months' results. To give a sense of scale of this company, within the report they announced plans to open approximately 2,400 net new stores in fiscal 2007. This was an increase over the 2,000 stores estimated to be opened in fiscal 2006.
4. What are the longer-term financial results for this company?
Reviewing the Morningstar.com "5-Yr Restated" financials on Starbucks, we can see the record of steady revenue growth from $2.6 billion in 2001 to $6.4 billion in 2005 and $7.4 billion in the trailing twelve months (TTM).
Earnings during this period have also steadily increased from $.23/share in 2001 to $.61/share in 2005 and $.72/share in the TTM. Interestingly, the number of shares, which was at 780 million in 2003, increased to 794 million in 2004 and then have declined to 785 million in 2005 and 756 million in the TTM due to company share buy-backs.
Free cash flow has been positive with $238 million in 2003, increasing to $280 million in 2005 and $404 million in the trailing twelve months (TTM). This growth in free cash flow has occurred in the face of the large increase in capital spending from $378 million in 2003 to $696 million in the TTM. Presumably, this spending is related to both the share buy-backs and expenses related to opening new stores.
The balance sheet, while adequate, are a bit heavy in current liabilities. The company is reported to have $442 million in cash and $927 million in other current assets. When combined, this $1.37 billion in current assets, just covers the $1.32 billion in current liabilities yielding a current ratio of 1.04. Adequate but not impressive. The company fortunately has long-term liabilities of only $224.6 million. In addition, with the $400 million in free cash flow on an annualized basis, this balance sheet is probably more than adequate.
5. What about some valuation numbers on this company?
If we review the Yahoo "Key Statistics" on Starbucks, we find that this is a large cap stock with a market capitalization of $25.71 billion. This company is richly-valued with a trailing p/e of 52.32 and a forward p/e estimated at 40.01 (fye 02-Oct-07). Based on the 5 yr expected earnings, the PEG is also rich at 2.36.
If we examine the results from the Fidelity.com eresearch website, we find that Starbucks has been assigned to the "Specialty Eateries" industrial group. Within this group, Starbucks is moderately priced with a Price/Sales ratio of 3.6. Topping this group is Tim Hortons (THI) with a ratio of 7, following Starbucks is Panera (PNRA) with a ratio of 2.7 and Caribou Coffee (CBOU) at a much cheaper 0.6.
Looking at profitability, as measured by the Return on Equity (ROE), Starbucks is tops in this department with a ROE of 24.7%. This is followed by Tim Hortons at 19.2%, Panera at 17.4% and at the bottom of the list is Caribou with a (6.7)% ROE. (Sometimes 'cheaper' isn't better!)
Returning to Yahoo, they report 756.07 million shares outstanding with 746.87 million that float. Currently there are 20.22 million shares out short representing 2.7% of the float and 4 trading days of volume (the short ratio). Slightly exceeding my own 3 day rule for short interest, this may potentially help the stock on the upside in the face of any good news. The company does not pay a dividend and the last stock split was a 2:1 stock split October 24, 2005.
6. What does the chart look like?
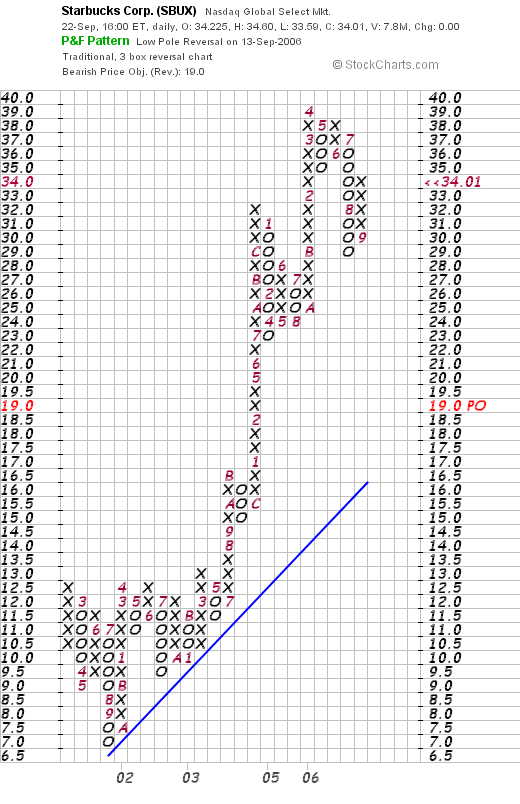
If we review the "Point & Figure" chart on Starbucks from StockCharts.com, we can see that while the stock price initially consolidated in a tight range between February, 2002 and March, 2003, beetween $12.50 and a low of $7.00, the stock broke out strongly in March, 2003, and has moved higher since to a high of $39 in April, 2006. The stock has been correcting but has not broken its up-trend imho.
7. Summary: What do I think about this stock?
Let's review some of the many aspects of this stock I have touched on in the above review. First of all, I own shares of Starbucks so my analysis is certainly colored by this bias. But trying to be as frank as possible, Starbucks is above all the classic growth stock story. They have a quality product and have been a true category-killer in the coffee market. Most recently, they had the power (perhaps explained by a moat) to announce an increase to their coffee drinks and coffee beans.
The latest quarter showed positive sales and earnings growth. However, same-store sales growth in the 4% range is a bit anemic. In addition, the company has announced plans for a 2,700 store addition. It will be instructive to observe their execution of this large expansion. The Morningstar.com report shows the impressive growth in revenue and earnings and the recent decline in shares outstanding. The company is able to produce an increasing flow of free cash but the balance sheet is a bit heavy on current liabilities with current assets just covering them.
Valuation-wise, the p/e is rich in the 50's and a forward p/e above 40. Thus, the PEG, at 2.8, also suggests that even with anticipated growth, the stock is richly priced. On the plus side, the Price/Sales ratio is more-or-less reasonable within its small specialty eateries group. And the ROE is tops in the group demonstrating its profitability. There are a significant number of investors/speculators betting against Starbucks with a relatively large number of shares out short. Finally, the chart looks strong with a steady increase in share price the past 3 years.
So what do I think? Well, I am glad I have owned Starbucks since 2003. I am not sure I would be a buyer in here although it never has paid to bet against this company. I am a bit concerned over a few factors: the relatively rich valuation with a p/e in the 50's and a PEG at 2.8, and what appears to be a moderation in same-store sales growth. Coupled with a balance sheet showing a large level of current liabilities....with the committment to buy back shares AND open 2,700 outlets....is this a stretch? Meanwhile, I am staying put with my small 50 share investment. I suspect Starbucks will come through and doubters will once again find themselves on the outside....
Thanks so much for stopping by and visiting! If you have any comments or questions, please feel free to leave them on the blog or email me at bobsadviceforstocks@lycos.com. Also, be sure and visit my Stock Picks Bob's Advice podcast site where you can listen to me talk about many of the same stocks on the blog!
Bob
Saturday, 23 September 2006
"Looking Back One Year" A review of stock picks from the week of May 23, 2005

Hello Friends! Thanks so much for stopping by and visiting my blog, Stock Picks Bob's Advice! As always, please remember that I am an amateur investor, so please remember to consult with your professional investment advisors prior to making any investment decisions based on information on this website.
Once again it is the weekend and for me that means I should take a look at past stock picks to see how they turned out! For the sake of this review, I continue to assume a "buy and hold" strategy for all stocks discussed. For performance evaluations, I am assuming that one purchased equal dollar amounts of all stocks that week and I am simply doing an average of the % change of each stock reviewed.
In actual practice I employ and recommend a disciplined ownership strategy of selling losing stocks quickly on small losses and selling gaining stocks partially and slowly at targeted appreciation levels. It is this bias that I believe will result in profitable portfolios longterm. This blog is an ongoing experiment in that approach.
 On May 23, 2005, I posted Dynamic Materials (BOOM) on Stock Picks Bob's Advice when it was trading at $37.64/share. BOOM had a 2:1 stock split on October 13, 2005, making my effective stock pick price $18.82. BOOM closed at $32.83 on September 22, 2006, giving my selection an appreciation of $14.01 or 74.4% since being posted.
 On August 3, 2006, Dynamic materials reported 2nd quarter 2006 earnings. Sales for the quarter ended June 30, 2006, climbed 51% to $27.8 million from $18.4 million in the same quarter the prior year. Sales were up 10% sequentially from the prior quarter. Net income climbed 137% to $5.0 million or $.41/diluted share up from $2.1 million or $.18/diluted share in the prior year. Analysts had expected $24 million and earnings of $.28/share. Although the company dampened expectations about the upcoming quarter, they expected the following fourth quarter to be strong.
 On May 24, 2005, I posted Forward Industries (FORD) on Stock Picks Bob's Advice when it was trading at $20.43/share.
FORD closed at $5.12 on September 22, 2006, for a loss of $(15.31) or (74.9)% since posting.
 On July 27, 2006, Forward Industries announced third quarter 2006 results. For the quarter ended June 30, 2006, net sales dropped sharply to $7.3 million compared with $13.1 million for the same three months in 2005. Net income came in at $285,000 or $.04/diluted share in the 2006 quarter, compared with $2.6 million or $.33/diluted share in the same quarter in 2005.
 Finally, on May 26, 2005, I posted Michaels Stores (MIK) on Stock Picks Bob's Advice when the stock was trading at $41.25. MIK closed at $43.22 on September 22, 2006, for a small gain of $1.97 or 4.8% since posting.
On August 23, 2006, Michaels announced their 2nd quarter 2006 results. For the quarter ended July 29, 2006, total sales came in at $768.3 million, a 3.1% increase over the prior year same period sales. Same-store sales, however, decreased (0.3)%. Net income for the second quarter came in at $20.3 million and diluted earnings were $.15/share. This was up from $16.5 million in sales and $.12/share in earnings. The company did provide guidance of an increase in same-store sales of 1% to 3% for the next quarter with total sales gaining 4% to 6%. However, even though sales figures were up for the latest quarter, the negative same-store sales growth certainly creates some concern about the vigor of the earnings prospects.
So how did I do with these three stock picks for that week in May last year? Basically, the phenomenal performance of Dynamic Materials was negated by the awful performance of Forward Industries. Thus, with the small positive growth reported by Michaels, the average performance for the three stocks is a small 1.4%.
Thanks so much for stopping by and visiting my blog! If you have any comments or questions, please feel free to email me at bobsadviceforstocks@lycos.com or just leave your comments right on the blog itself! Please be sure to take the time and visit my Stock Picks Podcast Website where you can, for the past year, hear me talk about stocks in addition to the possibilities of reading about them.
Bob
Posted by bobsadviceforstocks at 3:42 PM CDT
|
Post Comment |
Permalink
Updated: Sunday, 24 September 2006 12:03 AM CDT
Friday, 22 September 2006
September 22, 2006 HEICO (HEI)
CLICK HERE TO GET TO MY PODOMATIC PAGE FOR MY PODCAST.
Hello Friends! Thanks so much for stopping by and visiting my blog, Stock Picks Bob's Advice! As always, please remember that I am an amateur investor, so please remember to consult with your professional investment advisors prior to making any investment decisions based on information on this website.
Even though the overall market tone is poor today, I wanted to see if I could find another stock to discuss with all of you readers. When investing, it is helpful to build a portfolio of stocks. But it is always the challenge of deciding which stocks are best to be owning within that portfolio. I hope that these discussions are helpful to you in making your own decisions about possible stock selections. But do consult with professional advisors as well.
 Over the years, I have employed a stock-picking system that starts with an examination of the top % gainers that day on the NYSE, the NASDAQ, and sometimes the AMEX as well. Looking through the list of top % gainers on the NYSE today, I came across HEICO Corporation (HEI) which as I write is trading at $34.53, up $1.13 or 3.38% on the day. Often this low a % gain is not sufficient for a stock to make the top % gainers list. However, on a declining day, it suffices.
I do not own any shares nor do I have any options on this stock. However, I reviewed the things I have found important on an investment and believe that this is a stock that deserves a spot on my blog! Let me share with you the factors that led me to this decision.
1. Was there any news that led the stock to move higher today?
Reviewing the news on the stock, I saw that Sun Trust Robinson Humphrey had raised its opinion on HEI from "neutral" to buy. This apparently was enough to push the stock higher today.
2. What exactly does this company do?
According to the Yahoo "Profile" on HEICO, the company
"... through its subsidiaries, engages in the design, manufacture, and sale of aerospace, defense, and electronics related products and services in the United States and internationally. It operates in two segments, Flight Support Group and Electronic Technologies Group."
3. How did they do in the latest quarter?
On August 30, 2006, HEI reported 3rd quarter 2006 results. Net sales for the quarter ended July 31, 2006, increased 48% to $102.1 million, up from $69.2 million in the same quarter last year. Net income came in at $8.28 million, up 37% from $6.05 million, or $.31/diluted share, up from $.23/diluted share in the same period last year. In light of these strong results, the company went ahead and raised guidance on the full year to $378 to $380 million in revenue (up from $370 to $376 million guidance provided in June), $66 to $67 million in operating income, and net income in a range from $1.14 to $1.16/share (up from the $1.09 to $1.12/share guidance in June) . The current quarter's net income exceeded by $.03/share the $.28/share expected by analysts. The revenue figure also exceeded the $92.5 million expected by analysts polled by Thomson Financial.
In my slang, I call this a 'trifecta-plus'. That is, the company reported strong revenue AND earnings growth, beat expectations and raised guidance. The best that can be expected from a quarterly report imho.
4. What about longer-term financial results?
Looking at the "5-Yr Restated" financials on HEI from Morningstar.com, we can see the steady growth in revenue from $171.3 million in 2001 to $269.6 million in 2005 and $325.9 million in the trailing twelve months (TTM).
Earnings, however, have been a little less consistent, dropping from $.65/share in 2001 to $.50/share in 2003. However, since 2003, earnings have steadily increased to $.87/share in 2005 and $1.02 in the TTM.
The company also pays a small dividend, with $.05/share paid in 2001 through 2005, and $.07/share paid in the TTM.
The number of shares outstanding has been relatively stable, increasing from 22 million in 2001 to 25 million in 2005 and the TTM.
Free cash flow has been positive with $24 million in 2003, $28 million in 2005 and $22 million in the TTM.
The balance sheet as presented by Morningstar.com appears solid with $5.4 million in casha nd $152 million in 'other current assets'. This total of $157.4 million can easily cover the $45.1 million of current assets and cover most of the long-term liabilities which are reported at $151.5 million. the current ratio works out to a 'healthy' 3.49.
5. What about some 'valuation' numbers on this stock?
Referring to Yahoo "Key Statistics" on HEICO, we can see that this is a mid-cap stock with a market capitalization of $865.60 million. The trailing p/e is a moderate 31.05, and the forward p/e is estimated (fye 31-Oct-07) at a nicer 24.77. The PEG is a tad rich at 1.51.
According to the Fidelity.com eresearch website on HEICO, this company is in the "Aerospace/Defense-Products/Services" industrial group. Within this group, HEI is relatively richly priced relative to the Price/Sales ratio which tops the group at 2.5. Also at 2.5 is Rockwell Collins (COL) at 2.5, Honeywell (HON) follows at 1.1, Goodrich (GR) at 0.9, Lockheed Martin (LMT) at 0.9, and Northrop Grumman (NOC) at 0.8.
Insofar as profitability is concerned, utilizing the Return on Equity (ROE) as a measure, HEI also comes in low at 10.1%. This only is better than Northrop at 8.4%. Leading the group is Rockwell at 42.8%, Lockheed Martin at 27.8%, Goodrich at 24.3%, honeywell at 17%, followed by HEI at 10.1% and Northrop at 8.4%.
Even though these numbers do not particularly show this company to be a great 'value', the strong revenue and earnings growth just reported suggests that investors are looking beyond these 'static' numbers which are about valuation based on current performance, but are pricing into this stock future earnings and revenue expectations.
Returning to Yahoo for a few more numbers, we find that there are 25.32 million shares outstanding with 16.12 million that float. Now here is the interesting piece of information. Yahoo is reporting, as of 8/10/06, 2.40 million shares out short, up from 2.14 million the prior month. With the average volume of only 119.6 thousand shares, this represents a whopping 21.4 trading days of volume out short. It is no surprise to me, as I use a '3-day rule' to assess current ratios, that with the good earnings news this past week or so, the company has rallied strongly, likely both from investors buying shares for the first time as well as speculators covering their bad 'bet'.
As noted above, the company is paying a small (but increased) dividend of $.08/share yielding 0.20% The last stock split was reported January 2, 2004, when the stock had an 11:10 split. (what most people would refer to as a 10% stock dividend).
6. What does the chart look like?
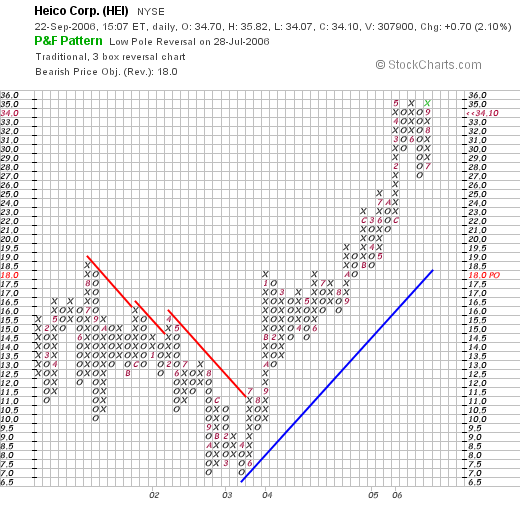
If we take a look at the "Point & Figure" chart from StockCharts.com on HEICO, we can see that the stock was actually declining between January, 2001 when the stock was at $16, and when it bottomed in April, 2003 at $7.00. (This corresponds with the drop in earnings during that same period....once again re-emphasizing the correlation between earnings performance and stock price performance imho.). After breaking through resistance at the $11.50 level in June, 2003, the stock has subsequently traded higher to its current level near $35.
7. Summary: What do I think about this stock?
In conclusion, I find HEICO to be an interesting stock pick for this blog. They are a relatively small sized company (mid cap to be precise) with relatively few shares outstanding. They just reported great results beating expectation on both revenue and earnings and guided analysts higher for the next quarter. The Morningstar.com fundamentals look nice with steady revenue growth, steady earnings growth for the last 3 years, positive free cash flow, and a solid balance sheet. Valuation-wise the PEG is at 1.5, the Price/Sales and ROE are a bit rich. An interesting footnote is the large number of shares out short. We may well be watching a continued slow 'squeeze' of the short-sellers. Finally, the chart looks nice.
What I haven't told you is my familiarity with the product. What I call the "Peter Lynch" portion of my analysis. I am not familiar with their products but like the stock due to the underlying performance of the company.
Thanks so much for stopping by and visiting my blog! If you have any comments or questions, please feel free to leave them on the website or email me at bobsadviceforstocks@lycos.com. Also, please be sure to drop by and visit my Stock Picks Podcast Website where you can hear me as well as read what I write!
Bob
Posted by bobsadviceforstocks at 2:37 PM CDT
|
Post Comment |
Permalink
Updated: Sunday, 24 September 2006 6:20 PM CDT
Monday, 18 September 2006
Precision Castparts (PCP)
Hello Friends! Thanks so much for stopping by and visiting my blog, Stock Picks Bob's Advice! As always, please remember that I am an amateur investor, so please remember to consult with your professional investment advisors prior to making any investment decision based on information on this website.
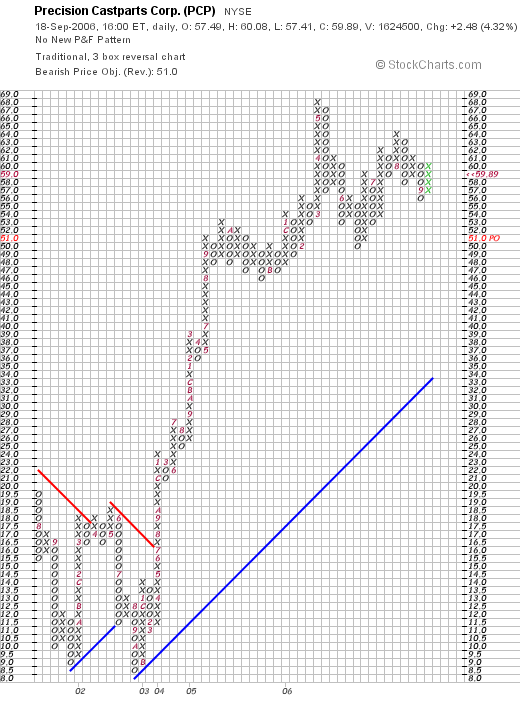
 I was looking through the list of top % gainers on the NYSE tonight, and came across Precision Castparts (PCP) which closed at $59.89, up $2.48 or 4.32% on the day in an otherwise anemic market. I do not own any shares of PCP nor do I own any options on this company.
This review tonight is more or less a "revisit" of an old stock pick that was brought to my attention by George K., a good friend of mine, and a member of my stock club who suggested I take a look at PCP. In fact, I reviewed PCP on Stock Picks Bob's Advice on February 19, 2006, when it was trading at $56.37. Since the post, the stock has appreciated $3.52 or 6.2%. I hope that George picked up a few shares of this one at the time of his email and my discussion. If I find out, I will try to pass it on to you.
Let's take another look at this company and I will try to show you why I now fully agree with George that this stock deserves a spot on this blog!
1. What exactly does this company do?
According to the Yahoo "Profile" on Precision Castparts, the company
"... engages in the manufacture of metal components and products; and the provision of investment castings, forgings, and fasteners/fastener systems for critical aerospace and industrial gas turbine applications. It operates through four segments: Investment Cast Products, Forged Products, Fastener Products, and Industrial Products."
2. Was there any news today to explain the stock move higher?
Looking through the news today, I found a single story from Motley Fool listing Precision Casparts (PCP) as one of the "Best Stocks of the Millennium. And what they are discussing is the appreciation of stocks since the end of 1999, December 31, 1999 to be exact. PCP was one of six stocks discussed, having appreciated 770% since that date! (The other stocks were Middleby, National Healthcare, Itron, and ITT). Was this the story that drove the stock higher? Probably not, but that was the only news item on the stock that I could locate!
3. How did the company do in the latest reported quarter?
On July 25, 2006, Precision Castparts (PCP) reported results for the 1st quarter of fiscal 2007. For the quarter ended July 2, 2006, sales increased 31.6% from $853 million in sales to $1.12 billion. Net income for the quarter increased from $77.9 million to $118 million, or $.86/diluted share, up 48.3% from $.58/diluted share. (These results include results from the newly acquired Special Metals operation). This quarter's results exceeded analysts' expectations of $.74/share. Sales results also exceeded expectations of $1.06 billion.
4 . How about longer-term financial results?
Reviewing the Morningstar.com "5-Yr Restated" financials, we can see that revenue, which dipped from $2.2 billion in 2002 to $1.8 billion in 2003, has subsequently steadily increased to $3.5 billion in 2006 and $3.8 billion in the trailing twelve months (TTM).
Earnings, however, have been quite erratic, increasing from $.41/share in 2002 to $1.17/share, then dropping to a loss of $(.01)/share in 2005, increasing to $2.58/share in 2006 and $2.85/share in the TTM.
The company has increased shares somewhat from 103 million in 2002 to 133 million in 2006 and 135 million in the TTM.
Free cash flow has been strongly positive if not steady with $87 million in 2004, $292 million in 2005, dropping to $132 million in 2006 and $227 million in the TTM.
The company has a relatively small amount of cash with $97.8 million reported. When combined with the $1.8 billion in other current assets, results in a total current assets of $1.91 billion. When compared to the $1.1 billion in current liabilities, results in a 'current ratio' of 1.74.
5. How about some valuation numbers on this stock?
Reviewing Yahoo "Key Statistics" on Precision Castparts, we find that this is a large cap stock with a market capitalization of $8.11 billion. The trailing p/e is a moderate 21.02 and the forward p/e (fye 02-Apr-08) is even nicer at 13.74. With the rapid growth in earnings anticipated, the PEG works out (5 yr expected) to a very nice 1.10. From these parameters the stock appears reasonably valued.
Examining the Fidelity.com eresearch website for data on PCP, we can see that this company is in the "Steel & Iron" industrial group. Relative to the Price/Sales ratio, this stock is the richest in valuation in the group with a Price/Sales ratio of 2.1. This is followed by Oregon Steel Mills (OS) at 1.3, Nucor (NUE) at 1.1, Steel Dynamics (STLD) at 1.1 and Gibraltar Industries (ROCK) at 0.5.
Insofar as profitability is concerned, as measured by the Return on Equity (ROE), PCP is also near the bottom of the 'heap'. Topping this list is Nucor with a ROE of 33.3%, followed by Steel Dynamics (STLD) at 29.1%, Oregon Steel at 22.8%, Precision at 18.6%, and Gibraltar Industries at 10.3%.
Returning to Yahoo, we can see that there are 135.48 million shares outstanding with almost all, 134.87 million share, that float. Of these that float, 1% or 1.38 million shares are out short representing a short ratio of 1.2. The company pays a dividend of $.12/share yielding 0.2%. The last stock split was a 2:1 split on September 9, 2005.
6. What does the chart look like?
Reviewing the "Point & Figure" chart from StockCharts.com on PCP, we can see that the stock, which drifted lower between July, 2001 when the stock was trading at $15.50, hit a low of $8.50 in October, 2002. The stock broke through resistance in July, 2003, at $17 and has traded higher since. The upward move of this stock chart appears to have slowed but is still moving higher.
7. Summary: What do I think about this stock?
Let's review some of the observations I have made above. First of all, the stock moved nicely higher on the heels of a 'top millennium' stock on Motley Fool. The latest quarter was quite strong with solid growth of both earnings and revenue with the company beating expectations on revenue and earnings results. On Morningstar.com, except for the erratic earnings, the company has produced solid revenue growth, a reasonable balance sheet, and a strong chart to boot! On the downside, while the p/e isn't bad and the PEG is just over 1.0, the Price/Sales as well as the Return on Equity numbers left a little to be desired. I am willing to overlook those valuation numbers in light of the phenomenal earnings report and the possibility of future earnings growth. Overall, I like this company a lot! (Good pick George!)
Of course, since I have not sold any portion of my stocks at a targeted gain, I am still not 'elibible' to be buying a new position. But if I were.....this would be the kind of stock that I would be looking at!
Thanks once again for stopping by! If you have any comments or questions, please feel free to email me at bobsadviceforstocks@lycos.com or go ahead and leave your comments right on the blog. Also, be sure and visit my Stock Picks Podcast Website.
Bob
Sunday, 17 September 2006
"Looking Back One Year" A review of stock picks from the week of May 16, 2005
Hello Friends! Thanks so much for stopping by and visiting my blog, Stock Picks Bob's Advice! As always, please remember that I am an amateur investor, so please remember to consult with your professional investment advisors prior to making any investment decisions based on information on this website.
The weekend is almost over and I wanted to make sure I get to the 'stock pick review' that I have been doing each weekend (unless I get too busy) for the past several years. I do not think it is enough to just write up some stock ideas and leave it at that. I owe it to you, the reader, to examine those past selections and find out how they turned out. I suppose that this continued re-examination of stocks can help me refine my own ideas about what makes a good stock market pick.
For the sake of this review, I am assuming a buy and hold strategy for these picks. For my average performance, I am assuming that an equal dollar purchase has been made of all stocks that particular week and that by averaging each stock's performance, I can arrive at some sort of average for the group of investments. As you probably know, most of the stock picks are not actually purchased by me in my trading portfolio. However, virtually every single stock in there came out of the same process that led me to write the stocks up! I continue to post my trades...both purchases and sales, and try to update my trading portfolio at intervals as well as going through my actual holdings about every two weeks.
In regards to that 'buy and hold' strategy, as you probably know, if you are a regular reader here, I use a very disciplined trading strategy with all of the stocks that I own. First of all, I will have only a maximum of 25 positions (currently I am at 11). My minimum holdings are also limited at 6, although I have never been at that level, I am currently below my maximum # of positions as well. I only add a new position if I sell a portion of a holding at a targeted gain...currently I use 30, 60, 90, 120%, then 180, 240, 300 and 360%, then 450, 540, 630, 720...etc. as targeted gains. At each of those targeted price appreciation levels, I am currently selling 1/6th of my remaining shares (I was selling 1/4 of my position until I realized that the size of my positions was dwindling). When I do sell a stock at a gain, I use that as a signal that the market is 'ripe' for a new position to be added.
However, when I sell on what I call bad news I don't do anything with the proceeds, what I like to refer to as "sitting on my hands". Currently bad news sales occur when either there is a fundamental announcement of bad news, or the stock price declines to targeted sale points. My current targets are at an (8)% loss after a first purchase, break-even if I have sold a portion at the first targeted appreciation (30% gain), or 1/2 of the highest appreciation target achieved. The final strategy means that if I have sold a portion of a stock three times (that is at 30, 60, and 90% appreciation targets), my targeted sale on the downside would be at 1/2 the 90% appreciation point...or at 45% appreciation, instead of break-even or even at an 8% loss.
 The first stock discussed that week was American Healthways (AMHC) that on January 31, 2006, announced a change in name to Healthways (HWAY). I posted my 'pick' on May 16, 2005, when the stock was trading at $39.42. HWAY closed at $48.05 on September 15, 2006 for a gain of $8.63 or 21.9%.
On June 26, 2006, HWAY announced 3rd quarter 2006 results. Revenues climbed 36% to $106.8 million, up from $78.4 million in the prior year same period. Net income came in at $9.3 million or $.26/diluted share, up from $8.5 million or $.24/diluted share in 2005. This exceeded analysts' expectations of $.21/share, on $104.6 million in revenue. The company also raised guidance for the full year for earnings of $1.17 to $1.20, up from prior guidance of $1.16 to $1.19/share. Revenue guidance was unchanged in the range of $415 million to $435 million for the full year.
 On May 18, 2005, I posted FactSet Research (FDS) on Stock Picks Bob's Advice when it was trading at $31.53. FDS closed at $47.21 on September 15, 2006, for a gain of $15.68 or 49.7% since posting.
On June 20, 2006, FactSet reported 3rd quarter fiscal 2006 results. For the quarter ended May 31, 2006, revenues climbed 24.5% to $98.8 million, from $79.3 million in the same quarter the prior year. Net income increased to $21.0 million from $19.6 million last year same period. Diluted earnings per share grew to $.41 up from $.39 the prior year.
 Finally, on May 20, 2005, I posted Kyphon on Stock Picks Bob's Advice when it was trading at $28.85/share. On September 15, 2006, KYPH closed at $39.27, for a gain of $10.42 or 36.1% since posting.
On July 26, 2006, Kyphon reported 2nd quarter 2006 results. Revenue for the quarter ended June 30, 2006, totaled $101.1 million, up 35% over the $75.0 million reported in the same quarter the prior year. Net income for the quarter increased 19% to $9.5 million or $.21/diluted share, up from $7.9 million or $.18/diluted share for the same period last year.
So how did I do with these three stocks? In a word, terrific! I do not think that this performance is accidental but is related to all of the underlying strength of the companies involved. However, past performance is NO guarantee of future performance, so take this with a grain of salt. Anyhow, averaging the three stocks, I had an average performance of a gain of 35.9% since posting these stocks a bit over a year ago.
Thanks so much for stopping by and visiting! If you have any comments or questions, please feel free to drop me a line at bobsadviceforstocks@lycos.com or go ahead and leave your comments on the blog! Please also visit my Stock Picks Podcast Site and you can hear me talk about many of these same stocks I have been writing about here!
Have a great week everyone!
Bob
Posted by bobsadviceforstocks at 8:22 PM CDT
|
Post Comment |
Permalink
Updated: Sunday, 17 September 2006 9:10 PM CDT
Saturday, 16 September 2006
Zumiez (ZUMZ)
CLICK HERE FOR MY PODCAST ON ZUMIEZ
Hello Friends! Thanks so much for stopping by and visiting my blog, Stock Picks Bob's Advice! As always, please remember that I am an amateur investor so please remember to consult with your professional investment advisors prior to making any investment decisions based on information on this website.
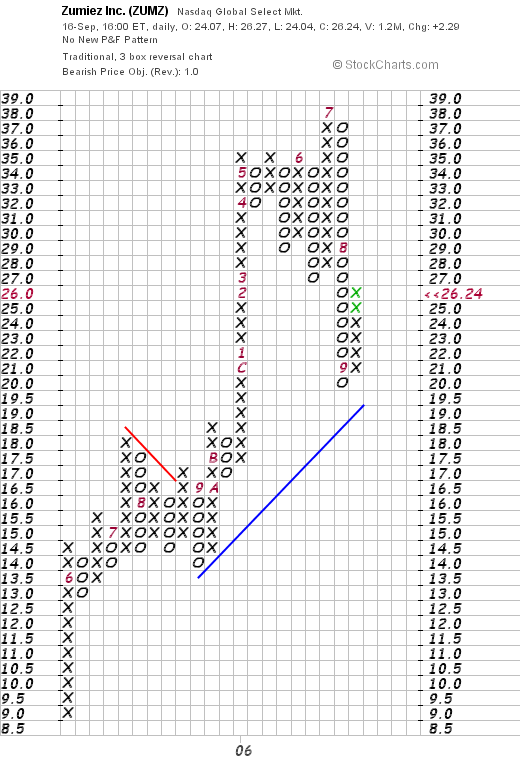
 Zumiez (ZUMZ) made the list of top % gainers on the NASDAQ more than once this past week. Zumiez was on the list yesterday, closing at $26.24, up $2.29 or 9.56% on the day. I do not own any shares nor do I have any options on this stock. I did buy 22 shares for my son in his account a couple of months ago.
 I have been watching this stock for awhile as there is a Zumiez store in my local mall. But more significantly, when the same store sales reports have been announced, Zumiez is one of the strongest retail firms reporting from my perspective. More on this in a bit. But above all, I think this company deserves a spot on the blog for all of the things I like to see in a stock.
1. What exactly does this company do?
According to the Yahoo "Profile" on Zumiez, the company
"...operates as a mall based specialty retailer of action sports related apparel, footwear, equipment, and accessories in the United States. It offers apparel offerings, including tops, bottoms, outerwear, and accessories such as caps, belts, and sunglasses; and footwear offerings, such as action sports-related athletic shoes and sandals. The company also provides equipment offerings or hardgoods, including skateboards, snowboards, and ancillary gear, such as boots and bindings; and miscellaneous novelties and digital versatile discs. It serves young men and women between the ages of 12 and 24."
2. Was there any news reported to explain the big move higher?
Actually, I didn't see any particular news on Friday to explain the move higher! Earlier in the week Piper Jaffray upgraded the stock from "Market Perform" to "Outperform" which might still have had an effect on Friday.
3. How did they do in the latest quarter?
 On August 16, 2006, Zumiez (ZUMZ) reported 2nd quarter 2006 results. For the quarter ended July 29, 2006, total sales increased by 41.5% to $55.8 million, from $39.4 million reported in the same quarter in the prior fiscal year. Net income for the quarter was $1.6 million or $.06/diluted share, up 94% from the $848,000 or $.03/share reported the prior year. This beat analysts expectations of $.05/share for the quarter. During the quarter, comparable store sales increased 12.6% compared with the 11.6% comparable (same-store) sales growth reported in 2005. In an additional positive note, the company raised guidance for fiscal 2006 to $.66 to $.67/diluted share. This is what I call my 'trifecta plus' in an earnings report. For me, that means the company increased its revenue, increased its earnings, beat expectations AND raised guidance. Everything an investor could desire in an earnings report!
4. How about longer-term financial results?
Reviewing the Morningstar.com "5-Yr Restated" financials on Zumiez, we can see the steady picture of revenue growth with $84.7 million in revenue in 2001, increasing to $205.6 million in 2006 and $220 million in the trailing twelve months (TTM).
Unfortunately, Morningstar doesn't show any income figures as the company came public in May, 2005.
Free cash flow has improved from $1 million in 2004 to $8 million in 2006 and $15 million in the TTM.
The balance-sheet is solid with $38 million in cash, which by itself could cover the $32.9 million in current liabilities and much of the $9.4 million in long-term liabilities. Adding in the $43.4 million of other current assts results in $81.4 million in total current assets, which when compared to the $32.9 million in current liabilities yields a current ratio of 2.47.
5. What about some valuation numbers on this stock?
 Looking at the Yahoo "Key Statistics" on Zumiez, we find that this is a mid-cap stock with a market capitalization of $723.91 million. The trailing p/e is rich at 50.85, with a forward p/e (fye 28-Jan-08) much nicer at 29.48. This company's growth is expected by analysts (5 yr expected) to be so strong that the PEG works out to a very reasonable .98.
Per the Fidelity.com eresearch website, ZUMZ is in the "Apparel Stores" industrial group. Within this group, ZUMZ is the richest in valuation in regards to the Price/Sales ratio with a ratio of 3.2. Zumiez is followed by American Eagle (AEOS) at 2.6, Chico's (CHS) at 2.4, Abercrombie & Fitch (ANF) at 2.1, Limited (LTD) at 1.1 and Gap (GPS) at 1.
Checking relative profitability, ZUMZ is towards the bottom with a Return on Equity (ROE) of 19.8%. This group is topped by Abercrombie at 35.9%, Limited at 30.8%, American Eagle at 26.7%, Chico's at 26.1%, and following Zumiez is Gap at 17.2%. Thus, from these two measures the company appears richly valued with a Price/Sales relatively high and a profitability relatively low.
Returning to Yahoo, we find that there are 27.59 million shares outstanding with 14.68 million that float. As of 8/10/06 there were 3.06 million shares out short, representing 13.9% of the float or 5.9 trading days of volume. This high level of short interest (I use a short ratio of 3 as a cut-off), may well explain the move higher Friday as short-sellers scramble to cover their shorts! No cash dividends are paid and the last stock split was a 2:1 split on April 20, 2006.
6. What does the chart look like?
Looking at a "Point & Figure" chart from StockCharts.com, we can see that this stock has moved strongly, if unevenly, higher since coming public in May, 2005. The stock hit a high of $38 in July, 2006, and is now bouncing off support in the area of $21 to close at $26.24 Friday. The chart has stayed above the blue 'support line' and looks encouraging to me without being over-extended.
7. Summary: What do I think about this stock?
Let's review some of the things that led me to write up this stock on the blog. First, the stock made a nice move higher on Friday, and indeed was strong for much of last week after a brokerage house upgraded the stock to 'outperform'. And the latest quarter? Strong with a 41.5% increase in revenue and a 94% increase in earnings.
The company both beat expectations and raised guidance in the latest quarter. However, same store sales which were in the 10-11% range in the latest quarter has dropped down to the 4.7% range the past month. In addition, the Morningstar.com report is solid with steady revenue growth (since company is a relatively recent IPO, Morningstar has limited earnings and share # reports), free cash flow, and a solid balance sheet. Valuation-wise, the p/e is quite rich at just over 50. However, earnings are anticipated to continue to growing rapidly and the PEG is under 1. The company is no bargain either as measured by Price/Sales ratio as well as Return on Equity. However, the relatively large short-interest may well be moving this stock higher as well. Finally, the chart looks nice.
On a Peter Lynch style approach, I like the fact that this is a very small retail firm with fairly steady and positive same store sales growth. I think they cater to a unique youth audience and are quite successful at it as well! Assuming the ability to continue to growth those sales at stores open at least a year, this company has lots of room to grow. We will need to continue to watch those same-store sales numbers which come out monthly, to make sure that this relatively weak figure for same store sales does not deteriorate.
So am I buying any shares? No, of course not. If you are a regular reader, you will know that I shall be sitting on my hands until one of my regular stocks hits a sale at an appreciation target.
Thanks so much for visiting! If you have any comments or questions, please feel free to leave them on the blog or email me at bobsadviceforstocks@lycos.com.
Bob
Posted by bobsadviceforstocks at 10:01 PM CDT
|
Post Comment |
Permalink
Updated: Sunday, 17 September 2006 10:49 PM CDT
Thursday, 14 September 2006
NeuroMetrix (NURO)
Hello Friends! Thanks so much for stopping by and visiting my blog, Stock Picks Bob's Advice! As always, please remember that I am an amateur investor, so please remember to consult with your professional investment advisors prior to making any investment decisions based on information on this website.
 Earlier today I noted that NeuroMetrix (NURO) was behaving well in an otherwise anemic market. (The market is consolidating today after several days of price appreciation and in the face of an otherwise weak retail report). As I write, NURO is trading at $20.50, up $1.76 or 9.39% on the day. I do not have any shares or options on this stock.
I would like to briefly share with you some of my thoughts on this stock and why I have chosen it for this blog.
As I do with all of my picks, I start with the stocks that are moving strongly higher that day. NURO made the list of top % gainers on the NASDAQ today with its strong move to the upside.
According to the Yahoo "Profile" on NeuroMetrix, the company
"...engages in the design, development, and sale of proprietary medical devices used to diagnose neuropathies. The company offers NC-stat System, a neuropathy diagnostic system that provides physicians the ability to diagnose patients with neuropathies at the point-of-service."
Reviewing the latest quarterly report, on July 27, 2006, NURO reported 2nd quarter 2006 results. 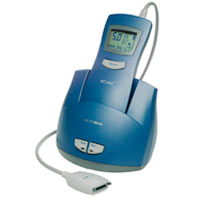 For the quarter ended June 30, 2006, revenue came at $14.0 million, a 73% increase over the $8.1 million reported in the second quarter of 2005. Net income worked out to $1.36 million or $.13/share, as compared with a loss of $(636,500) or $(.05)/share the prior year. The report notes that results would have been even better minus the stock-based compensation reporting requirements.
Loking longer-term at the Morningstar.com "5-Yr Restated" financials, we can see the steady increase in revenue from $3.5 million in 2001 to $34.3 million in 2005 and $45.2 million in the trailing twelve months (TTM). Net income has improved from a loss of $(10) million in 2001, improving to a profit of $1 million in 2005 and improving to $3 million in the TTM. On a per share basis, results were first reported in 2005 when $.07/share were reported. This has sharply improved to $.25/share in the TTM.
The free cash flow trend is encouraging with $(4) million in free cash flow improving to $(3) million in 2004, $1 million in 2005 and $3 million in the trailing twelve months.
The Morningstar.com balance sheet looks solid with the company reported to have $34.7 million in cash, enough to pay off both the $6.0 million in current liabilities and the $1.2 million in long-term liabilities combined...more than 4x over.Calculating the 'current ratio', with the total current assets working out to $45 million, when compared to the $6 million in current liabilities, this works out to a ratio of 7.5 which is quite solvent.
 Reviewing Yahoo "Key Statistics" on NURO, we find that this stock is a small cap stock with a market capitalization of only $262.73 million. The trailing p/e is a very rich 87.09, but the forward p/e is a bit better (fye 31-Dec-07) at 38.87, but still rich. Thus, the PEG at 1.51 is not a steal, but with the rapid growth anticipated, the current p/e may not be as bad as it looks at first glance.
Reviewing the Fidelity.com eresearch website, we can see that this company is in the "Medical Instruments/Supplies" industrial group. It tops the group in terms of the Price/Sales ratio with a ratio of 5.4. NURO is followed by Cytycf (CYTC) at 5.3, Stryker (SYK) at 4, Boston Scientific (BSX) at 3.2, Becton Dickinson (BDX) at 3.1 and Baxter (BAX) at 3.
Also, in terms of profitability, as measured by Return on Equity (ROE), NURO is less than stellar with Becton Dickinson at the top at 20.4%, Cytyc at 20.1%, Stryker at 19.9%, Baxter at 19.7% and NeuroMetrix at 8.7%, only followed by Boston Scientific at (55.7)%. Clearly, this stock is not an intrinsic bargain, but investors are paying for the future rapid growth and the possibilities that this investment represents, not the actual current performance.
Returning to Yahoo, we can see that there are 12.52 million shares outstanding and 11.88 million that float. Of these, 24.9% were out short as of 8/10/06, representing 2.86 million shares or 10.1 trading days of volume. I use a 3 day rule and this is triple my level for significance. There does appear to be quite a few shares sold short on this company and what we are witnessing today may well represent part of a squeeze on the shorts.
No dividend is paid and no stock splits are reported by Yahoo.
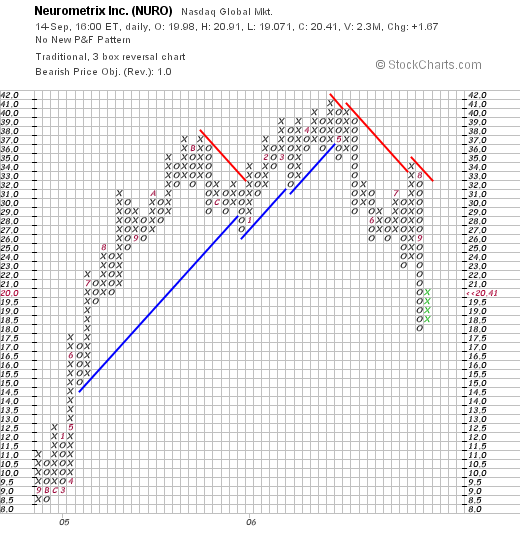
What about the chart? If we review a "Point & Figure" chart from StockCharts.com on NURO, we can see that the company which was trading strongly higher from $8.50 in September, 2004, broke through resistance and peaked at $41 in April, 2006. Indeed the chart looks like the stock 'rolled over' and the price declined to the recent low of $18. Today's nice move to $20.41 does not really break this trend. Hopefully, the upcoming quarter will be strong and the shorts will once again be 'squeezed' if we are to see this stock turn around and move to new highs. It would be nice to see this stock trading above $32 before I could feel more comfortable suggesting that this stock should be bought in here.
Thanks again for stopping by and visiting! If you have any comments or questions, please feel free to leave them on the blog or email me at bobsadviceforstocks@lycos.com. Also, be sure and stop by and visit my Stock Picks Podcast Website.
Bob
NeuroMetrix (NURO)
Hello Friends! I don't have time to do a whole post...but take a look at NURO and I think you might like what you see. Latest quarter, Morningstar, and today's move make it an interesting idea. I haven't looked at this one before, don't own any shares, am not planning at this time to buy any shares (I don't have a buy signal), but I was afraid that with my busy schedule, I wouldn't get around to writing this one up!
Regards!
Bob
Wednesday, 13 September 2006
"Revisiting a Stock Pick" Global Payments (GPN)
CLICK HERE FOR MY PODCAST ON GLOBAL PAYMENTS
Hello Friends! Thanks so much for stopping by and visiting my blog, Stock Picks Bob's Advice! As always, please remember that I am an amateur investor so please remember to consult with your professional investment advisors prior to making any investment decisions based on information on this website.
 We had another nice day in the market. I cannot remember how long it has been since we have had so many up days in a row! I hope it is not premature to start getting optimistic about things, but with the interest rate hikes on hold and energy prices pulling back, we might just have the beginnings of a new bull market. Hopefully, that is not wishful thinking :).
Going back to my usual haunts looking through the top % gainers lists, I came across what I call an "old favorite" of mine, Global Payments (GPN) which made the list of top % gainers on the NASDAQ, closing at $41.25, up $2.61 or 6.75% on the day. I have an arbitrary rule on this blog that I do not like to review past stock picks until at least a year has passed.
I first reviewed Global Payments on Stock Picks Bob's Advice on September 9, 2005, when it was trading at $68.89. GPN had a 2:1 stock split October 31, 2005, making my effective stock pick price actually $34.45. With today's close at $41.25, the stock has appreciated $6.80 or 19.7% over the past year. I do not own any shares nor do I have any options on this stock.
Let's take another look at this stock and see why I think it deserves a spot on Stock Picks!
1. What exactly does this company do?
If we look at the Yahoo "Profile" on Global Payments, we can see that this company
"...provides payment processing and consumer money transfer services worldwide. The company operates in two business segments, Merchant Services and Money Transfer."
2. Was there any news today to explain the stock price move?
Today, as reported, UBS upgraded GPN from "Neutral" to "Buy". Scouring the news on Global Payments, I found another story regarding GPN's acquisition of Sarajevo-based Diginet, an "indirect payment processor" adding to its "presence in the Balkan region." Personally, I have observed that most acquisitions result in the acquiring company dropping slightly in price and the company to be acquired climbing higher. However, some acquisitions might well be additive to earnings. It does appear that the UBS upgrade may have been the bigger news.
3. How did the latest quarterly report turn out?
This news report was a little harder to locate but was easily retrieved from the company website. Global Payments announced 4th quarter 2006 results on July 28, 2006. For the quarter ended May 31, 2006, revenue grew 15% to $238.8 million, up from $207.7 million in the same quarter the prior year. 4th quarter GAAP net income was $34.1 million, compared with $23.5 million the prior year. On a per share basis this worked out to $.41/diluted share, up from $.29/diluted share the same quarter the prior year.
4. How has this company done longer-term?
Reviewing the Morningstar.com "5-Yr Restated" financials on GPN, we can see the steady pattern of revenue growth from $463 million in 2002 to $784 million in 2005 and $908 million in 2006.
Earnings have grown just as consistently with $.31/share reported in 2002, increasing to $1.16/share in 2005 and $1.53/share in 2006. The company has been paying a dividend of $.08/share steadily since at least 2002. Nicely, even though there has been a slight increas in shares outstanding, this has been a modest increase from 72 million shares in 2002 to 79 million shares in 2006. This is less than a 10% increase in the shares while revenue doubled and earnings quintupled.
Free cash flow is also gorgeous. Global Payments had $68 million in free cash flow in 2004, increasing to $195 million in 2005 and $210 million in 2006.
The balance sheet is solid with $218.5 million in cash, enough to pay off the current liabilities of $149.7 million and most of the long-term liabilities of $98.8 million. Calculating the current ratio, the company has a total of $348.4 million in total current assets, which when divided by the $149.7 million in current liabilities yields a current ratio of 2.33. Current ratios over 2 are considered healthy.
5. How about some valuation numbers on this stock?
Using the Investopedia definition of market capitalization:
"Mega Cap: Market cap of $200 billion and greater
Big/Large Cap: $10 billion to $200 billion
Mid Cap: $2 billion to $10 billion
Small Cap: $300 million to $2 billion
Micro Cap: $50 million to $300 million
Nano Cap: Under $50 million"
Global payments would be considered a mid-cap stock with a market capitalization of $3.30 billion per Yahoo "Key Statistics". Elsewhere on this blog, I have described mid-cap stocks as companies with market capitalizations of $500 million to $3 billion, so this certainly varies from source to source.
The trailing p/e is a moderate 27, with a forward p/e (fye 31-May-08) of only 20.62. Analysts are apparently fairly bullish on growth prospects as the PEG ratio works out to a reasonable 1.35.
Examining the Price/Sales ratio on the Fidelity.com eresearch website, and using the Paul Sturm perspective, we find that Global Payments (GPN) is in the "Business Services" Industrial Group, and is fairly richly valued with a Price/Sales ratio of 3.5. This is exceeded only by Getty Images (GYI) with a ratio of 3.7, and is followed by Choicepoint (CPS) with a ratio of 3.1, Fidelity National Information Services (FIS) at 2.9, and Cintas (CTAS) at 1.9.
Looking at profitability, as measured by Return on Equity (ROE), finds Global Payments leading this group with a figure of 18.1%, this is followed by Cintas at 15.3%, Choicepoint at 12.9%, Getty Images at 11.6%, and Fidelity National Information Services at 9.6%.
Returning to Yahoo for some more numbers, we find that there are 79.91 million shares outstanding and 66.66 million of them that float. Currently, as of August 10, 2006, there were 2.47 million shares out short, representing 3.10% of the float or 2.5 trading days of volume (the short ratio). Using my own arbitrary 3 day rule on short ratios, I do not find this a very significant level of short interest.
As I noted earlier, the company does pay a small dividend of $.08/share yielding 0.2%. The last stock split was a 2:1 split on October 31, 2005.
6. What does the chart look like?
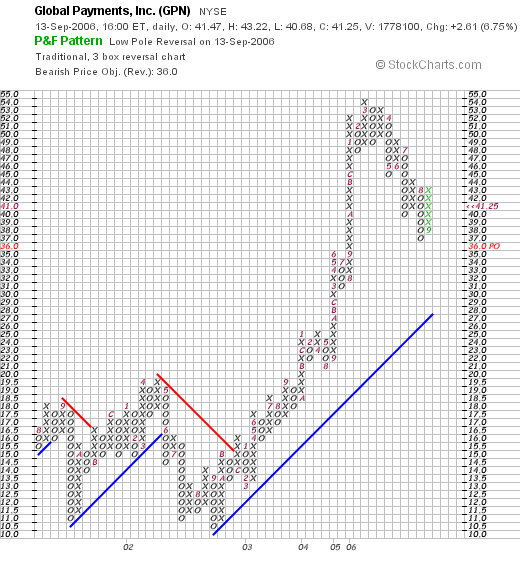
If we review the "Point & Figure" chart on Global Payments from StockCharts.com, we can see that this stock was going nowhere between August, 2001, and December, 2002, when it traded in a range between $10.50 and $20. The stock broke out in December, 2002, breaking through resistance at $15. The stock moved steadily higher until accelerating in January, 2006, and topping out at $54/share. Recently the stock has pulled back to the $37 level, but moved sharply higher today back up to the $41.25 range. The stock chart looks solid to me.
7. Summary: What do I think about this stock?
Let's review some of the things going on with this stock which moved nicely higher today. First of all the stock was upgraded by UBS and also announced a strategic acquisition. The latest quarter was very strong with a steady growth in revenue and earnings. Looking at the Morningstar report, we found that this revenue growth was remarkably steady the past five years with steady revenue and earnings growth with only a small increase in the shares outstanding. The company even pays a small dividend.
Free cash flow has been positive and growing solidly the past few years, the balance sheet is solid with ample cash and a current ratio over 2. Valuation-wise, the p/e isn't bad in the 20's, the PEG is only a big over 1.2, the Price/Sales is a bit rich, but GPN leads its group in terms of return on equity. There aren't many shares out short. And finally, the chart looks nice to me.
This "profile" of a company is the kind of stock I am looking for and this company has once again demonstrated it deserves a place in this blog! Of course, I am not buying any shares now. I am still waiting for a signal from my own portfolio--a sale of a portion of my holdings at a gain. Meanwhile, I continue to 'sit on my hands'.
Thanks so much for stopping by and visiting! If you have any comments or questions, please feel free to leave them on the blog or email me at bobsadviceforstocks@lycos.com. Please also be sure to come and visit my Stock Picks Podcast Site!
Bob
Newer | Latest | Older


