Stock Picks Bob's Advice
Tuesday, 24 October 2006
"Trading Transparency" Precision Castparts (PCP)
Hello Friends! Thanks so much for stopping by and visiting my blog, Stock Picks Bob's Advice! As always, please remember that I am an amateur investor, so please remember to consult with your professional investment advisors prior to making any investment decisions based on information on this website.
Earlier today I sold a portion of my Coach (COH) stock at a gain of just over 360% since purchasing. This sale at a gain amounts to a "buy signal" for me in my portfolio management system. This is significant as my last "buy signal" purchase was a buy of 120 shares of Toro (TTC) on 5/25/06. Anyhow, with the signal in hand, and my nickel burning a hole in my pocket, I scanned the list of top % gainers on the NYSE, and noted that Precision Castparts (PCP), a stock that I have looked at just last month on this blog, was moving strongly higher. In fact, as I write, the stock is trading at $68.97, up $3.79 or 5.81% on the day. A few moments ago, I purchased 120 shares of PCP at $68.96.
Thanks so much for stopping by and visiting my blog! If you have any comments or questions, please feel free to drop me a line at bobsadviceforstocks@lycos.com or leave your comments right on the blog! Also, be sure to stop by and visit my Stock Picks Podcast Site!
Bob
"Trading Transparency" Coach (COH)
Hello Friends! Thanks so much for stopping by and visiting my blog, Stock Picks Bob's Advice! As always, please remember that I am an amateur investor, so please remember to consult with your professional investment advisors prior to making any investment decisions based on information on this website.
Earlier today, my 102 shares of Coach (COH) hit a targeted appreciation point and I sold 1/6th of my holdings. This worked out to 17 shares which were sold at a price of $38.73. This leaves 85 shares of Coach in my trading portfolio. These shares were acquired 2/25/03 with a cost basis of $8.33/share. Thus, I had a gain of $30.40 or 364.9% since my purchase of these shares. This was my eighth (!) partial sale of this position, having sold shares at 30, 60, 90, 120, 180, 240, and 300% gain targets. My next sale on the upside would be at a 450% appreciation level or 5.5 x $8.33 = $45.82, or on the downside if the stock retreats to 1/2 of my highest appreciation sale or at a 225% gain: 3.25 x $8.33 = $27.07.
In any case, a sale at a gain is a signal for me to purchase a new position. That is, since I am below my maximum number of positions, currently I am at 10 positions, I have a "permission slip" to identify a new investment and add it to my portfolio.
That nickel is burning a hole in my pocket already! Thanks again for stopping by and visiting! If you have any comments or questions, please feel free to email me at bobsadviceforstocks@lycos.com or just go ahead and leave a comment on the blog. And if you get a chance, please drop by and visit my Stock Picks Podcast Site where you can listen to me discuss many of the stocks and strategies I write about here on the blog.
Bob
Sunday, 22 October 2006
A Reader Writes "Why would you calculate FCF to exclude....?"
Hello Friends! Thanks so much for stopping by and visiting my blog, Stock Picks Bob's Advice! As always, please remember that I am an amateur investor, so please remember to consult with your professional investment advisors prior to making any investment decisions based on information on this website.
 This evening I received an interesting email from Matt R. who wrote me regarding my comments on CVS. I would like to answer his question as well as I am able, but would invite other readers, especially accounting people, who might be able to address his question in a bit more knowledgeable fashion.
Matt wrote:
"Hey Bob, stumbled across your blog today. Great information! Thanks for doing what you do.
Have a question for you...in your posting on 10/11/06 re CVS, you made the following statement....
"Free cash flow, which was negative at $(153) million in 2003, and $(434) million in 2004, turned positive at $117 million in 2005 and higher yet at $308 million in the TTM."
Why would you calculate FCF to exclude CVS's proceeds from their Sale-Leaseback transaction and also exclude dividends paid?
My calc for 2003 yields....
968.9 - 1,121.7 + 487.8 - 105.2 = +229.8
Are proceeds from the Sale-Leaseback not traditionally included in Net Capital Investments?
Thanks,
-Matt"
First of all Matt, thanks so much for writing! My numbers are not calculations that I have derived.
My number for Free Cash Flow (FCF) is from the
Morningstar.com "5-Yr Restated" financials page. On that page, which I have just linked to, you will see that Morningstar reports that CVS had $969 million in operating cash flow. From this, they report $1,122 million in Capital Spending which they subtracted from the operating cash flow resulting in a negative $(153) million. Up to this point, you and Morningstar.com are in agreement. After that you added in (apparently) the proceeds from the Sale-Leaseback and subtracted the dividend payments with the resultant free cash flow as you calculated it coming in at a positive $229.8 million. Quite frankly, I am not sophisticated enough in these matters to give you an opinion. But let's see what we can find.
Apparently there are no good defined rules for treatment of sales-leaseback arrangements in terms of free cash flow analysis.
Companies have the choice of treating these proceeds as either "cash from investing" or as "cash from financing".
"The research, conducted by the Financial Analysis Lab at the Georgia Institute of Technology, looked at 37 nonfinancial public companies that entered into operating leases through large sale-leaseback transactions over the last six years. booked Thirty of the companies booked the sale proceeds as cash from investing, while just seven reported the sale proceeds as cash from financing activities.That's understandable, since companies that book the deals as cash from investing can include the proceeds in their free-cash-flow calculations. Companies that account for the deals as cash from financing can't do that.
The problem is that the choice of investing-cash treatment for sale-leasebacks can distort the reporting of free cash flow. For companies that used the cash-from-investing treatment, study co-author and lab director Charles Mulford subtracted the sale proceeds from free cash flow. The adjustment caused significant decreases; for example, companies such as AMC Entertainment, Carmax Inc., and CVS Corp. dropped from a positive to a negative free cash flow."
The article continues:
"Companies that view a sale-leaseback as an investing event — interpreting the transaction as generating funds from the sale of property or equipment — take that double benefit. They book the asset disposition as a straight asset sale, and therefore add the sale proceeds into their free-cash-flow calculation.
Companies that view a leaseback deal as a financing event, however, interpret the transaction solely as generating funds, not disposing of an asset, and don't include the proceeds in their free-cash-flow calculation.
The blame for the reporting disparity doesn't fall on companies, according to Mulford and his co-author, Amit Patel, a graduate research assistant at Georgia Tech's College of Management. Rather, it's unclear under GAAP how to account for sales proceeds arising from sales-leaseback transactions that involve operating leases, according to their report."
Thus, I believe that Morningstar.com apparently must attribute this cash as being from a financing activity and not as from an investment. Please correct me if I am wrong, but I believe you are getting into a current accounting controversy that is over my head.
You also asked about the role of dividends in the calculation of free cash flow. Since I am not an accountant, I needed to do a little bit of work. You suggested that they should be subtracted from the FCF figure, but I found another article that suggests that this is not standard treatment. The article explains:
"Some analysts refer to free cash flow (FCF) as a basis for measuring a company's ability to meet continuing capital requirements. Others argue that FCF should represent the cash available after meeting all current commitments, that is, required payments made to continue operations (including dividends, current debt repayment, and regular capital reinvestment to maintain current operating activities). Still others argue that FCF should represent the cash available after meeting operating expenses, including working capital additions and the cost of maintaining operating assets. This approach defines FCF as "CFO minus capital maintenance expenditures." International Accounting Standard (IAS) 7 recommends that FCF should be recognized as "cash from operations less the amount of capital expenditures required to maintain the firm's present productive capacity." Using this description, dividends and mandatory debt payments would not be subtracted to arrive at FCF. Thus, using this description, discretionary cash expenditures would include growth-oriented capital expenditures and acquisitions, debt reduction, dividends, and stock repurchases."
Thank you so much for writing! Your question has given me the opportunity to try to understand the numbers that I share with readers so easily yet without as much of an understanding of the methodology involved. Please let me know if this addresses your concerns about the free cash flow calculations!
If you have any other questions or comments, please feel free to leave them on the blog or email me at bobsadviceforstocks@lycos.com. Also, be sure and visit my Stock Picks Podcast Site where I talk about many of the same stocks I write about here on the blog! Have a great week in the market!
Bob
"Looking Back One Year" A review of stock picks from the week of June 20, 2005

Hello Friends! Thanks so much for stopping by and visiting my blog, Stock Picks Bob's Advice! As always, please remember that I am an amateur investor, so please remember to consult with your professional investment advisors prior to making any investment decisions based on information on this website.
It is the weekend (at least for a few more hours!) and it is time for my weekend review! If you are a regular reader of this blog, you may know that I try to re-examine past stock picks on a regular basis to find out how they turned out and if they are still worthy of inclusion on this blog.
This review assumes a "buy and hold" strategy, while in fact, I employ a disciplined portfolio management approach, selling my losers quickly and completely and selling my gaining stocks slowly and partially at targeted appreciation points. This difference in strategy would certainly affect performance. However, for the ease of evaluation, I assume that I purchased equal dollar amounts of each stock discussed during the week I wrote them up. Most of the stocks I discuss I have never owned. Some, however, have been and continue to be part of my investment portfolio. I try very hard to make sure that I have let you know whether I own each of the stocks discussed.

On June 20, 2005, I posted Molecular Devices (MDCC) on Stock Picks Bob's Advice when it was trading at $21.20. MDCC closed at $19.03 on October 20, 2006, for a loss of $(2.17) or (10.2)% since posting.
 Molecular Devices reported 2nd quarter earnings on July 20, 2006. The company reported a net loss of $(458,000) or $(.03)/share on revenue of $47.3 million. In the prior year the company had net earnings of $3.7 million or $.21/share. More recently, the company announced lower guidance for the third-quarter, with earnings of $.12 to $.17/share on revenue of $44 to $46 million. Analysts had been expecting earnings of $.29/share according to Thomson First Call. On July 20, 2006, the company had announced guidance of $.22 to $.26/share on revenue of $48 to $52 million. If raised guidance is bullish for a stock, it is a bearish event when the company reduces guidance!
 On June 21, 2005, I posted Somanetics (SMTS) on Stock Picks Bob's Advice when it was trading at $22.25. SMTS closed at $21.97 on October 20, 2006, for a loss of $(.28) or (1.3)% since posting.
 On September 18, 2006, Somanetics announced 3rd quarter 2006 results. Revenue for the quarter increased 50% to $7.9 million from the $5.2 million reported in the same quarter in 2005. Net income increased to $1.9 million or $.13/diluted share, up from $994,147 or $.08/share in the same period a year earlier. In the same earnings report the company raised guidance to $.47 to $.49/share from previous guidance of $.40 to $.42/diluted share for fiscal 2006.
So how did I do with these two stock picks from last year? In a word, mediocre. For these two stocks, I had an average loss of (5.75)%.
Thanks again for stopping by! If you have any comments or questions, please feel free to email me at bobsadviceforstocks@lycos.com or leave your words right on the blog. Also, be sure to stop by and visit my Stock Picks Podcast Site where you can hear me talk about many of the same stocks I write about! Wishing you all a profitable week in the market!
Bob
Thursday, 19 October 2006
Alliance Data Systems (ADS) "Revisiting a Stock Pick"
Hello Friends! Thanks so much for stopping by and visiting my blog, Stock Picks Bob's Advice! As always, please remember that I am an amateur investor, so please remember to consult with your professional investment advisors prior to making any investment decisions based on information on this website.
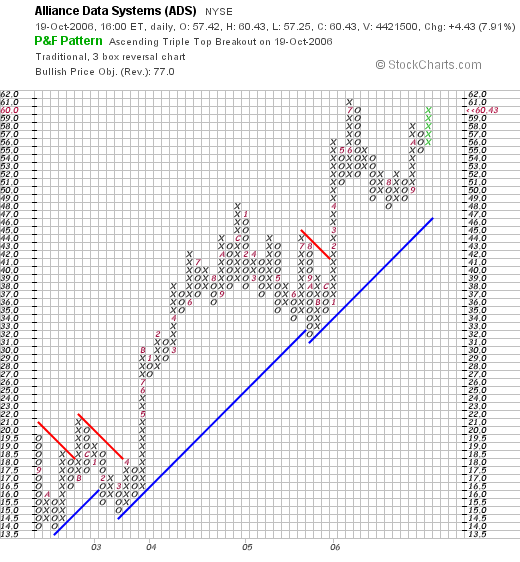
 I was looking through the list of top % gainers on the NYSE and came across an old favorite of mine, Alliance Data Systems (ADS) which had a nice move higher today, closing at $60.43, up $4.43 or 7.91% on the day. I first reviewed ADS on Stock Picks Bob's Advice on August 1, 2003, when the stock was trading at $28.45. Today's close works out to a gain of $31.98 or 112.4% since my first posting.
I "revisited" Alliance on January 29, 2004, when the stock was trading at $29.50. I also took another look at ADS and also took a position in the stock on June 16, 2005, when ADS was trading at $39.00. I sold these shares on October 25, 2005, after taking a small loss on this investment. This is one stock that unfortunately I didn't manage to hang onto, as the stock has moved significantly higher since my sale. However, I do believe the stock deserves to be in this blog, and I would like to take another look at this company with today's large move to the upside.
1. What exactly does this company do?
According to the Yahoo "Profile" on ADS, this company
"...and its subsidiaries provide transaction services, credit services, and marketing services in North America. The company facilitates and manages interactions between its clients and customers through multiple distribution channels, including instore, catalog, and online. Its transaction services comprise issuer services, such as card processing, billing and payment processing, and customer care; utility services consisting of customer information system hosting, customer care, and billing and payment processing; and merchant services, such as point-of-sale services and merchant bankcard services."
2. Was there any news to explain today's move higher?
Shares rose today after the company reported strong earnings yesterday after the close of trading.
3. How did they do in the latest reported quarter?
As I noted above, yesterday, October 18, 2006, the company reported 3rd quarter 2006 results. For the third quarter ended September 30, 2006, total revenue increased 32% to $506.6 million, up from $384.8 million in the same quarter the prior year. Net income increased 36% to $48.8 million in the quarter compared with $35.9 million in the same quarter last year. On a diluted per share basis this worked out to $.60/share, up 43% from $.48/share the prior year. In the same announcement, the company raised guidance for 2006 cash earnings/share to $3.00 to $3.05. The company also guided for 2007 with revenue expected to be at $2.1 billion, and earnings per share of "at least $3.50" peer diluted share.
As was reported on TheStreet.com, this 'cash-basis results' of $.81/share beat the expected $.67/share. The 2007 guidance was also ahead of Wall Street's forecast of $3.32/share in earnings on revenue of $2.14 billion.
Thus, the company managed to come in with what I call a "trifecta-plus" in a quarterly report: increased revenue, increased earnings, exceeding expectations, and raising guidance! The stock price responded accordingly!
4. What about longer-term financial results?
Reviewing the Morningstar.com "5-Yr Restated" financials on ADS, we find that revenue has been steadily increasing with $770 million in 2001 increasing to $1.5 billion in 2005 and $1.77 billion in the trailing twelve months (TTM).
Earnings have also steadily increased with $.31/share reported in 2002, increasing to $1.64/share in 2005 and $2.04 in the TTM.
The company has modestly increased its shares outstanding from 74 million in 2002 to 82 million in 2005, but has retired shares since with only 80 million shares reported outstanding in the TTM. No dividend is reported.
Free cash flow has been erratic with $70 million reported in 2003, $300 million in 2004, $43 million in 2005 and $133 million in the TTM.
The balance sheet is adequate if not overwhelming. The company is reported to have $151 million in cash, and $764.7 million in other current assets for a total of $915.7 million in total current assets. When compared to the $594.5 million in current liabilities this yields a current ratio of 1.54. In addition, the company has a significant $1.29 billion in long-term liabilities.
5. How about some valuation numbers on this stock?
Reviewing the Yahoo "Key Statistics" on ADS, we find that this is a large mid-cap stock with a market capitalization of $4.84 billion. The trailing p/e is a moderate 29.67 with a forward p/e (fye 31-Dec-07) of 18.20. With rapid growth expected over the next 5 years, the PEG works out to a very reasonable 1.07.
Checking the Fidelity.com eresearch website, we can see that this company is in the "Credit Services" industrial group. Within this group, ADS is reasonably priced with a Price/Sales ratio of 2.6. Leading this group is CapitalSource (CSE) with a ratio of 5. This is followed by American Express (AXP) at 2.8 and Alliance Data (ADS) at 2.6. Capital One Financial (COF) is at 1.8 and Fannie Mae comes in at 1.1.
Insofar as Return on Equity (ROE) is concerned, ADS is in the middle of the group with a ROE of 17.4%. Topping this group is Fannie Mae at 43.7%, American Express at 33.4%, then Alliance Data at 17.4%, Capital One Financial at 15.7% and CapitalSource (CSE) coming in at 14.2%.
Extracting some additional information from Yahoo, we can see that there are 80.11 million shares outstanding with 64.89 million that float. As of 9/12/06, there were 4.22 million shares out short representing 5.4% of the float or 5.8 trading days of volume. Using my "3 day rule" for the short ratio, this 5.8 days of short interest appears significant. Indeed, today's share move higher might well represent, at least in part, some of the short-sellers scrambline to limit their losses by purchasing shares of their pre-sold stocks. No cash dividend is paid and no stock splits are reported on Yahoo.
6. What does the chart look like?
If we review a "Point & Figure" chart on ADS from StockCharts.com, we can see a really gorgeous chart with the stock, which was trading between $14 and $21 in late 2002, moving to the $48 level in December, 2004, before pulling back to a $32 level. The stock moved higher since then and appears to be on the upswing as I write.
7. Summary: What do I think about this stock?
Let's take a look at a few of the points I reviewed in this post. First of all the stock moved strongly higher today on the back of an outstanding earnings report with both revenue and earnings increasing in the mid-30% range! The earnings exceeded expectations, and the company raised guidance for the 2006 full year and established strong 2007 earnings guidance.
The Morningstar.com report is also strong with a very steady record of growing revenue and earnings with a slowly increasing number of shares. Free cash flow, while a bit erratic, is strongly positive. Finally, the balance sheet is adequate with sufficient current assets to cover current liabilities. However, the company does have a sizeable long-term debt level.
Valuation-wise, the p/e isn't too rich and the PEG is great---just over 1.0. Both Price/Sales and ROE ratios are average and shouldn't keep the stock price back nor shall they cause great demand lifting shares. Helping keep the stock moving higher is a significant level of short interest. Finally, the stock chart looks strong with a steady increase in price the past three years.
In conclusion, I like this stock enough to have written it up virtually every year this blog has been in existence! In many ways, this stock exemplifies many of the factors that I find attractive in picking stocks. This stock deserves to be in the investing vocabulary of this blog!
Thanks so much for stopping by and visiting. If you have any comments or questions please feel free to leave them on the blog or email me at bobsadviceforstocks@lycos.com. Also, be sure and visit my Stock Picks Podcast Site!
Bob
Monday, 16 October 2006
Angeion Corp. (ANGN)
CLICK HERE FOR MY PODCAST ON ANGEION! Hello Friends! Thanks so much for stopping by and visiting my blog, Stock Picks Bob's Advice! As always, please remember that I am an amateur investor, so please remember to consult with your professional investment advisors prior to making any investment decisions based on information on this website.
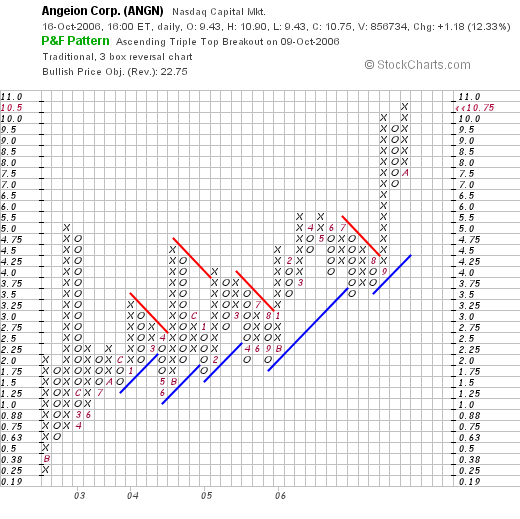
 This afternoon, while looking through the list of top % gainers on the NASDAQ I came across Angeion (ANGN) which appears to fit most of the criteria that I use to pick a stock for this blog. I do not own any shares of Angeion nor do I have any options on this stock. ANGN closed at $10.75, up $1.18 or 12.33% on the day. Let's take a closer look at this stock and I shall show you why I think it deserves a spot here!
1. What exactly does this company do?
 According to the Yahoo "Profile" on Angeion, this company
"...through its subsidiary, Medical Graphics Corporation, engages in the development, manufacture, and marketing of noninvasive cardio-respiratory diagnostic systems used in the management and improvement of cardio-respiratory health."
and
"It also sells health and fitness products through health and fitness clubs, personal training studios, weight loss centers, and other retail outlets."
2. Was there any news to explain today's move higher?
I did not see any news from Yahoo or on the Company's website to explain any interest in the stock today.
3. How did the company do in the latest reported quarter?
On September 11, 2006, Angeion reported third quarter 2006 results. For the quarter ended July 31, 2006, revenue came in at $8.8 million, up 45.2% over the same quarter in 2005. Net income came in at $655,000 or $.17/diluted share compared with a net loss of $(268,000) or $(.07)/diluted share last year.
4. What about longer-term financial results?
Reviewing the Morningstar.com "5-Yr Restated" financials on ANGN, except for a dip between 2000 and 2001 when revenue dropped from $17.1 million to $16.7 million, the company has been steadily growing its revenue with $24 million reported in 2005 and $30 million in the trailing twelve months (TTM).
Earnings have improved from a loss of $(1.86)/share in 2001 down to a loss of $(.25)/share in 2005. The company turned profitable in the TTM with $.41/share reported. The company has kept its 4 million shares outstanding stable from 2001 to the latest report.
Free cash flow, which has been negative at $(1) million in 2003-2005, turned positive with $2 million reported in the TTM.
Insofar as the balance sheet is concerned, this appears solid to me with $2.5 million in cash and $11.9 million in other current assets. When compared to the $6.1 million in current liabilities, this yields a current ratio of 2.36. In addition, the company has $1.1 million in long-term liabilities which could easily be covered by the $14.4 million in total current assets.
5. How about some valuation numbers on this stock?
Examining the Yahoo "Key Statistics" on ANGN, we find that this is a tiny stock with a market capitalization of only $39.02 million. Generally, stocks with market caps under $50 million are considered Nano-Cap stocks. The trailing p/e appears to be a reasonable 26.41. No forward p/e and no PEG ratio is found on the Yahoo site. Probably because the company is too small to have many analysts following the stock.
Reviewing the Fidelity.com eresearch website, we can see that Angeion is in the "Medical Instruments/Supplies" industrial group. Within this group, Angeion appears very reasonably valued with the lowest Price/Sales ratio in the group at 0.1. Leading this group is Boston Scientific (BSX) at 2.9, followed by Baxter International (BAX) at 1.4, Becton Dickinson (BDX) and Cytyc (CYTC) at 1.0, and Stryker (SYK) at 0.6. Angeion is at the bottom of the list at 0.1.
Insofar as profitability is concerned, as measured by return on equity (ROE), Angeion looks less impressive with a ROE of 10.2%. Leading this group is Becton Dickinson at 20.4%, Cytyc at 20.1%, Stryker at 19.9%, Baxter at 19.7% and Angeion at 10.2%. At the bottom of the group is Boston Scientific with a ROE of (55.7)%.
Finishing up with Yahoo, we find that the company has only 3.63 million shares outstanding with 3.61 million that float. As of 9/12/06, there were only 168,170 shares out short, representing 4.70% of the float or 0.7 trading days of volume (the short ratio). No dividend is paid and no stock splits are reported.
6. What does the chart look like?
Reviewing the Angeion "Point & Figure" chart from StockCharts.com, we can see what appears to be a very strong chart with the company climbing $.25/share in July, 2002, to the recent level of $4.00 in September, 2006. The company's stock broke out to the upside, more than doubling to its current level of $10.75. The chart looks surprisingly strong to me!
7. Summary: What do I think about this stock?
Let's review some of the things I discussed in this entry. First of all, the company had a very nice move higher today. It is just barely over $10 so price-wise it is near my limit of purchaseable stocks. The last quarter was strong with steady revenue and earnings growth. Perhaps more significantly, the company completed its steady stream of improving results, finally moving from a loss to a profitable position. Looking back over the past several years, the company has steadily been growing its revenue and improving its earnings results. The company also has reduced its negative free cash flow and turned positive. The balance sheet is solid.
Valuation-wise, the p/e is just in the mid-20's. The Price/Sales ratio is the lowest in its group at 0.1. And the ROE is fair...which isn't bad considering the company is just turning profitable. Finally the chart looks very strong with steady price improvement over the past four years.
Frankly, except for the fact that this is a company with a market cap under $50 million, I like this stock just fine. If I were in the market to be buying a stock, this is the kind of company I would be buying. I suspect that the company may well show price volatility, and after its huge recent upswing may be at risk for a correction. Just a thought I guess :).
Thanks again for stopping by and visiting! If you have any comments or questions, please feel free to email me at bobsadviceforstocks@lycos.com. Please also feel free to visit my Stock Picks Podcast Site where I discuss many of the same stocks I write about here on the blog.
Bob
Posted by bobsadviceforstocks at 9:43 PM CDT
|
Post Comment |
Permalink
Updated: Monday, 16 October 2006 10:38 PM CDT
Sunday, 15 October 2006
A Reader Writes "...where do I find the page that has your methods/goals/strategies....?"
Hello Friends! Thanks so much for stopping by and visiting my blog, Stock Picks Bob's Advice! As always please remember that I am an amateur investor, so please remember to consult with your professional investment advisors prior to making any investment decisions based on information on this website.
This weekend I received two emails about my strategy. For those of you who have read many of my previous entries, some of what I am going to write may be redundant, but for the rest of you I hope that what I am commenting on here is relevant and may answer some of your own questions.
First of all, Doug D. wrote:
"Bob,
I am a LTL (long time lurker) on Jubak's Refugee site and have seen some of your posts. I went to your site to check it out and it looks pretty good. The question I have is where do I find the page that has your methods/goals/strategies for your stock picking, selling and over all portfolio management. I seem to remember somewhere on the refugee site (a long time ago) you posted it and now I can't seem to find it. Anyway if you could show me where to find it that would be great. Thank you and keep up the good work. Doug"
Then I had one other letter from Keith, who followed up on an earlier question with this email:
"Bob
Have a few more questions for you.
1. How far down the % gainers list do you go to find a stock?
2. If you have a good sell therefore giving you a buy signal...do you buy a new stock immediately or wait for an excellent stock to show up instead of settling for a good one.
3. Have you tracked the % of winners vs losers? I try to tell my group to expect losses. I tell them that you can live with 40% winners if you average 25+% on your winners.
Thanks
Keith"
Instead of pointing you two to other entries in my blog (which I also would have to locate), let me try to answer both of you directly.
Doug, let me try to answer your questions first. My goal for my investments and my portfolio is to develop a way of selecting a group of "quality" investments that will outperform the market. I want to sell my losing stocks quickly and completely and sell my gaining stocks slowly and partially. Furthermore, I want my portfolio to respond automatically to market conditions. That is when my portfolio is doing poorly as evidenced by sales on "bad news" I want to be shifting my investments from equities to cash; conversely, when sales are happening on "good news" I want to expand my exposure to equities from cash. I have set myself up with the holding parameters of a minimum of 6 positions and a maximum of 25. I consider 12 positions to be a "neutral" posture, 6 conservative, and 25 aggressively invested.
First of all on how I screen stocks for my "quality" considerations. I do this manually, and not necessarily every trading day. The stocks that I identify I refer to as my "vocabulary" of my investing language. They are the "words" that will make up my investing world so to speak.
I start with the lists of top % gainers. I generally will examine the NASDAQ list first, then the NYSE and occasionally the AMEX list. Generally, I prefer to pick stocks that are at least or near to $10/share. My screens include looking at the latest quarter results. I insist that both earnings and revenue are growing and profitable. After that I use the Morningstar.com "5-Yr Restated" financials. I want to see at least three years of positive revenue and earnings growth, the company needs to be free cash flow positive, and have a balance sheet with at least as much current assets as current liabilities. (A current ratio of at least 1). I prefer seeing a company with a stable or only slowly-growing number of shares outstanding. In addition, a dividend is a plus to me (although not required) and if the company does pay a dividend, if they can actually be increasing the dividend on some regular basis, I think that's great!
My analysis generally follows up with some basic 'valuation' issues. I don't really rule out too many stocks on this basis. But if I can find reasonable valuation numbers, this enhances my interest in the company. I look at the p/e and PEG...preferring a company with a PEG between 1.0 and 1.5. I check the company's Price/Sales and Return on Equity relative to other companies in the same industrial group. I look at the number of shares outstanding and the short interest, enjoying the prospect of a great company with lots of shares out short. For me that means more than three days of short interest.
Finally, I take a look at a "Point & Figure" graph. I am not a technician. For me, I just want to see that the company appears to be moving higher at least in the short-term. I like seeing charts with steady increases in stock price.
These are my quality stocks. Quality for me is about consistency and predictability of good results. It is not really about the particular product or service. It isn't how much I like what they make but rather how they have been performing on a fundamental basis.
Let me touch on a little of my "signals" from my own portfolio. I believe my thinking is an extrapolation of William O'Neil's CANSLIM discussion in "How to Make Money in Stocks". He pointed out that one can assess the "M" in CANSLIM by observing one's own portfolio. I generally came to understand that while it was important to limit losses with an 8% loss after an initial purchase, one of the worst things in the world that I could do would be to compound my losses in a lousy Market by continuing to reinvest the proceeds and subsequently repeating that 8% loss on a different investment.
Thus, I observed, if it was wise to "sit on one's proverbial hands" after a sale at a loss, I needed to have an additional "signal" to take action. To invest additional funds. Since I was using my own portfolio as an indicator to not reinvest funds; why not use my own portfolio to generate a signal to buy a new position? To basically shift money from cash into equities?
I combined this with the thought that if I needed to sell my losing stocks quickly and completely, didn't it make sense to take a little bit of the profits off the table as they occurred to prevent watching stocks move higher then declining without taking any profits? After initially selling 1/4 of my remaining positions as the stocks appreciated to 30, 60, 90, and 120% levels.....thinking that selling 1/4 after a 1/3 gain....sort of 1/4 x 4/3 = 3/3....taking off just my profits....I realized that my positions were dwindling after I had several sales. Working mathematically, I tried out some different % to sell....and came up with 1/6th of remaining positions after the same 30, 60, 90, and 120% appreciation targets. After four such sales, I felt strongly that I needed to increase the intervals...since the stocks had essentially doubled, I made the intervals 60%....and sold 1/6th at 180, 240, 300, and 360%.....then by 90% intervals x 4, etc.
However, I needed to refine my selling strategy on the downside. After an initial purchase, like O'Neil, I like to sell everything if it hits an 8% loss. Using O'Neil again, trying to avoid turning a gain into a loss, I sell at break-even if I have sold once at a 30% gain. After that, I try to sell if the stock declines to 50% of the highest appreciation-sale point. That is, if I have sold portions of a stock three times with the highest sale at a 90% appreciation point, I will give the stock a little leeway to a 45% gain before selling ALL remaining shares. On all of these sales on declines, I sell the entire position. On good-news sales, they are all 1/6 th of remaining positions.
I reserve the right to sell on some fundamental bad news. Recently I unloaded my entire position of Healthways (HWAY) after the company missed earnings and revenue targets. I do not stick my head in the sand when bad things happen; maybe I should ignore them and just rely on the stock price movement, however, I still leave myself that out.
Finally, I use these sales as signals to either sit on my hands or start looking for an investable company to add a new position. Assuming a neutral portfolio posture of 12 positions (or half of whatever your particular maximum is), I drop down to a minimum of 1/2 of 1/2 or 1/4 of my maximum....which in this case works out to a minimum of 6 positions. Since my strategy depends on the actions of the stocks that I actually own, I shall replace positions that are sold on bad news in the particular case that I am at the minimum number of holdings. Conversely, if I am at the maximum number of positions...which for me I have set at 25, and one of them hits an appreciation target for a "good news" signal, I will not add a new position. I will instead add to the cash position as I am already at the maximum number of holdings.
I suspect that this system will lag the market, as currently I am at 10 positions....closer to my minimum than maximum, and am waiting for a stock to hit a sale at an appreciation target before adding another position. But time will tell if this is the case or if actually my posture is appropriate to market conditions.
Now for some of Keith's questions....how far down I go on the % gainers list? I go down as far as my particular list allows....even down to the #50...I believe there are 50 positions on the list. Often, if I find more than one stock in my review, I write up as many as I feel...or have time...to review.
Good question on the good-news sale. If I sell a portion on good news and start looking for a new stock, I limit myself to the top % gainers list THAT DAY. If I see an old name that I like....sort of one of my 'words' from my vocabulary so to speak....then I might purchase that stock if it still met my criteria. If there weren't any attractive stocks I might wait until the next day. However, my own attitude is to buy another stock as soon as possible. I joke about that "nickel burning a hole in my pocket." But whether it is the best strategy, it is the strategy that I have employed.
I haven't tracked my % gainers over losers. I think it will be pretty good. In fact, if anyone is interested, all of the entries are there for review. I do review them a week at a time....but it would be interesting to go back to 2003 and review those stocks as well.....
I hope that my answers provide you with the understanding about my approach that you both were looking for. When I say that I am an amateur, I really am serious! My biggest strategy is to focus on winners and part with poorly performing stocks as soon as possible. I consider this a sort of "natural selection" of stocks with my strongest stocks staying in my portfolio and the rest being dropped by the wayside.
Let me know if either of you or anyone else has other comments or questions. If you do, leave them on the blog or email me at bobsadviceforstocks@lycos.com.
Have a great week trading!
Bob
"Looking Back One Year" A review of stock picks from the week of June 13, 2005
Hello Friends! Thanks so much for stopping by and visiting my blog, Stock Picks Bob's Advice! As always, please remember that I am an amateur investor, so please remember to consult with your professional investment advisors prior to making any investment decisions based on information on this website.
The weekend is almost over, and I haven't done my review yet....so let's get right to the point! If you haven't read one of these posts, let me explain that I like to check on the stocks I have been writing about and I have been going back about a year and reviewing all of the stocks presented on this blog during that particular week. This review assumes a "buy and hold" strategy for investing. In practice, I advocate and employ a disciplined portfolio management system selling losing stocks quickly and completely, and gaining stocks slowly and partially. Using a different portfolio strategy would certainly affect one's investment performance.
 On June 13, 2005, I posted SRA International (SRX) on Stock Picks when it was trading at $34.74. SRA closed at $31.10 on October 13, 2006, for a loss of $(3.64) or (10.5)% since posting.
On August 2, 2006, SRA reported 4th quarter 2006 results. Revenue for the quarter ended June 30, 2006, increased 23% to $297.2 million from $241.1 million. Net income for the quarter came in at $17.4 million, up from $15.9 million the prior year, diluted EPS came in at $.30/share up from $.28/share in 2005.
 On June 14, 2005, I posted Diodes (DIOD) on Stock Picks when it was trading at $33.30. DIOD had a 3:2 stock split on December 1, 2005. Thus, my effective stock pick price was actually $22.20. DIOD closed at $43.90 on October 13, 2006, for a pick price gain of $21.24 or 96.5% since posting.
On August 2, 2006, Diodes reported 2nd quarter 2006 results. Revenue for the quarter increased 63.5% to $82.7 million. Net income increased from $7.7 million to $11.4 million, a more than 60% increase, and diluted eps increased from $.32/share to $.41/share.
 On June 15, 2005, I posted Landauer (LDR) on Stock Picks when it was trading at $52.90. Landauer closed at $51.70 on October 13, 2006, for a loss of $(1.20) or (2.3)% since posting.
On July 26, 2006, LDR reported 3rd quarter 2006 results. Revenue for the quarter came in at $19.6 million, up 8% over the $18.2 million for the same period in the year earlier period. Earnings per diluted share came in at $.56/share, up 12% from the $.50/diluted share the prior year.

On June 16, 2005, I posted Progress Software (PRGS) on Stock Picks when it was trading at $30.33. PRGS closed at $25.90 on October 13, 2006 for a loss of $(4.43) or (14.6)% since posting.
On September 19, 2006, Progress reported 3rd quarter results. Revenue for the quarter ended August 31, 2006, increased 12% to $111.4 million from $99.5 in the same period a year earlier. However, due to accounting problems due to stock ooptions, the company withheld earnings and expected to book costs of $20 to $30 million from 1995 to February, 2006. With the earnings still not reported, I am forced to give this company the proverbial "thumbs-down"!
 On June 16, 2005, I posted Alliance Data Systems on Stock Picks when the stock was trading at $39.00/share. ADS closed at $56.35 on October 13, 2006, for a gain of $17.35 or 44.5% since posting.
On July 19, 2006, ADS announced 2nd quarter 2006 results. Revenue for the quarter ended June 30, 2006, increased 32% to $490.5 million, from $370.6 million in the same quarter in 2005. Net income grew 30% to $44.8 million from $34.4 million the prior year. Per diluted share, this worked out to a 38% increase to $.55/diluted share vs $.40/diluted share the prior year. The company also raised guidance on both revenue and earnings adding to the postive impact of this report.
So how did I do that week in June a little over a year ago?
Actually, it was a mixed result with three stocks losing ground and two stocks moving strongly higher. The average change for the five stocks was an average gain of 22.72%!
Thanks so much for stopping by and visiting! If you have any comments or questions, please feel free to drop me a line at bobsadviceforstocks@lycos.com. I read all of the email I get, and I try to respond to as many as possible. If you get a chance, please drop by and visit my Stock Picks Podcast Site where I discuss many of the same stocks and questions I write about here on the blog!
Bob
Thursday, 12 October 2006
Regal-Beloit (RBC)
Hello Friends! Thanks so much for stopping by and visiting my blog, Stock Picks Bob's Advice! As always, please remember that I am an amateur investor, so please remember to consult with your professional investment advisors prior to making any investment decisions based on information on this website.
In case someone hasn't noticed, this blog is NOT about "getting rich quick". It isn't about any kind of gimmicks or short-cuts. What I am trying to do is simply to help you think about investments. To learn to 'look under the hood' so to speak. To ask questions. To check earnings reports, same-store sales, free cash flow, PEG ratios and Price/Sales ratios. In other words, to do your homework. It is my strong belief that if I can find a group of stocks with what I call quality characteristics that I will stand half a chance to have a portfolio that will perform respectfully relative to the market and other standards. We shall all have losing stocks and gaining stocks. But I want to know why any particular stock is in my portfolio at all. I hope that my evaluations help you address this same question!
 This afternoon, after a great day in the market, I was convinced that I would be able to find another stock to discuss on this blog. As I do when I am looking for new stocks, I scan through the lists of top % gainers. In this particular case I was reviewing the list of top % gainers on the NYSE when I came across Regal-Beloit (RBC) which closed at $47.18, up $2.33 or 5.20% on the day. Why did I pick this stock when there are so many other stocks I could have chosen? In fact, I did look at a number of other stocks but nothing seemed to work as well for me as this company. Let me explain.
 In the first place, I do not own any shares of this company nor do I have any options. I am proud of the fact that this is another great Wisconsin company. O.K., so I am loyal to my state. But there are several of these midwestern firms that I like, including Manitowoc Co., Oshkosh Truck, and Johnson Controls. Let's add Regal-Beloit to this list as well.
What exactly does this firm do?
According to the Yahoo "Profile" on RBC, the company
"...engages in the manufacture and supply of electrical and mechanical motion control products principally in North America, Europe, and Asia. It operates in two segments, Electrical and Mechanical. The Electrical segment offers various products, including a line of alternate and direct current commercial and industrial electric motors; heating, ventilation, and air conditioning motors; and electric generators and controls, capacitors, and electrical connecting devices."
Is there anything in the news to explain today's move?
No. I don't see anything particularly pertinent to move this stock today. I think that this stock probably moved together with all of the other stocks in the market. In addition, the company is a part of the S&P 600 SmallCap Index and the S&P 1500 Super Comp Indices, so perhaps in any institutions were buying the index, well this stock got bought up as well. That is about my best guess.
How did they do in the latest reported quarter?
On July 27, 2006, Regal-Beloit reported 2nd quarter 2006 results. For the quarter ended July 1, 2006, net sales increased 18% to $435.3 million from $368.8 million in the second quarter of 2005. Net income grew an impressive 80.6% to $33.3 million, up from 418.4 million in the same period in 2005. Diluted earnings per share climbed 59.7% to $.99/share, up from $.62/share in the same quarter in 2005. Clearly, this was a fantastic report.
If you are a regular reader of this blog, you will know that one of the key determinants of an earnings report, in regards to its effect on the 'market' is what the company did relative to the expectations of analysts who follow this stock. As reported, analysts polled by Thomson Financial had been expecting earnings of $.95/share on revenue of $436 million. So the company beat the expectations on earnings and came in a hair shy of the revenue figures expected.
The second part of an earnings report is the question of guidance. This again is an expectations game. In other words, the company is helping analysts out with how the future is going to turn out. When a company raises guidance it acts to raise expectations for earnings which acts to increase the price that investors or institutions are willing to pay for a stocks. This is probably related to a 'recalculation' of what is called the net present value of an investment. While not an exact analogy, the rethinking of future earnings streams to investors and stockholders results in a recalculation of the current price that a company is worth.
In this particular case, RBC did raise guidance in this report, forecasting third-quarter earnings in the range of $.78 to $.84/share. Analysts apparently had been expecting Regal-Beloit to earn $.67/share in the next quarter.
What about longer-term financial results?
Part of my evaluation of a stock is the review of results over the past several years. I am not seeking a quick turn-around or value investment. I am searching for what I call 'high-quality' companies. I define quality as a consistency in results, allowing a possible extrapolation of trends into the future with some reliability.
Reviewing the Morningstar.com "5-Yr Restated" financials on RBC, we find that revenue actually dropped from $664 million in 2001 to $605 million in 2002. However, since 2002, the company has grown steadily and has even seemingly accelerated that growth. Regal-Beloit reported $757 million in revenue in 2004, $1.43 billion in 2005 and $1.56 billion in the trailing twelve months (TTM).
Earnings have also been a bit erratic, increasing from $.93/share in 2001 to $1.01 in 2002, flat at $1.00 in 2003, then increasing strongly to $1.22 in 2004, $2.25 in 2005 and $2.93 in the TTM.
The company does pay a dividend: $.48/share in 2001 to 2004, then increased to $.51/share in 2005 and $.53/share in the TTM.
On a negative note, the company has been increasing its float with 21 million shares reported in 2001, increasing to 30 million by 2005 and 31 million in the trailing twelve months. Basically the company's shares are up 50% while earnings have been able to more than double and revenue has also climbed more than 100%. So while I prefer to see minimal increase in shares, as long as earnings and revenue grow quicker, then it doesn't appear to be very significant to me.
Free cash flow has also been positive and strong with $41 million in 2003, $22 million in 2004, increasing to $84 million in 2005 and the TTM.
Looking at the balance sheet from Morningstar.com, we find what appears to be a solid report with $24.6 million in cash and $532.8 million in other current assets. This total of $557.4 million, when compared with the $274 million in current liabilities yields a current ratio of 2.03. In general, current ratios over 2.0 are considered 'healthy'. In addition, RBC has $441.6 million in long-term liabilities.
How about some valuation numbers for this stock?
Examining the numbers on Yahoo "Key Statistics" for Regal-Beloit, we find that this is a mid-cap stock with a market capitalization of only $1.46 billion. The trailing p/e is a reasonable 16, with a forward p/e (fye 31-Dec-07) estimated at 13.37. The PEG is reported at 1.17 (5 yr expected).
Checking the Fidelity.com eresearch website for some additional comparative figures, we find that RBC is in the "Industrial Electrical Equipment" industrial group. The company is a good value insofar as the Price/Sales ratio is concerned. The most expensive in the group is Rockwell Automation (ROK) with a ratio of 2, followed by GE at 1.1, Eaton (ETN) at 0.5 and the most reasonable in the group are Regal-Beloit (RBC)O at 0.4 and Energizer Holdings (ENR) at 0.4.
Checking on profitability, as measured by ROE (Return on Equity), we find that unfortunately RBC is at the bottom by this measurement. Leading this group is Energizer at 74.5%, Rockwell at 34.9%, Eaton at 22.1%, GE at 17.6% and RBC at 14.5%.
Going back to Yahoo, the company has 30.87 million shares outstanding, with 28.35 million that float. As of 9/12/06, there were 1.97 million shares out short representing a significant 9.2 trading days of volume (or 6.60% of the float). Any time the short ratio climbs over 3 days, I believe this is a significant factor that can lend support to a stock price in light of good news. We may well have been seeing a bit of a squeeze of the shorts as the entire market moved higher.
As noted, the company pays an anticipated dividend of $.56/share yielding 1.3%. The company last split its stock, per Yaho, on August 15, 1994 when the stock split 2:1.
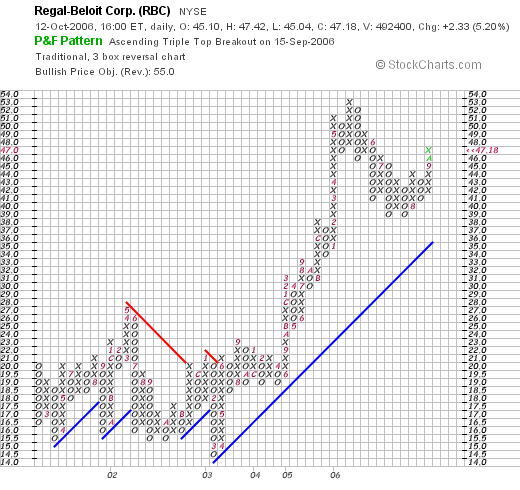
What does the chart look like?
If we review the "Point & Figure" chart on Regal-Beloit from StockCharts.com, we can see that the stock really went nowhere between 2001 and into June, 2003. Sometime in June, 2005, the stock broke out above $21 and has been moving higher since. The chart looks strong to me and not over-extended.
Summary: What do I think about this stock?
Let's review a few points on this stock. No particular news that I can see resulted in a nice move higher today. Perhaps the relatively large number of short-sellers got squeezed. I don't know for sure. The latest quarter was phenomenal with the company essentially beating expectations for earnings and raising guidance.
The last several years have been excellent for RBC, with revenue growing extremely strongly, earnings increasing solidly, and the company even pays a dividend which has been increased the past couple of years. The company has been increasing its float a tad quicker than I would prefer to observe. Free cash flow is positive and growing and the balance sheet appears solid with a current ratio over 2.
Valuation-wise, the p/e appears reasonable in the mid-teens, the forward p/e is even lower and the PEG is just a tad over 1.1. The Price/Sales is cheap, but the ROE is the weakest in its group. One thing that may be supporting this stock is the strong short interest with over 9 days of short interest outstanding. Finally, the chart looks solid. There really isn't much I don't like about this stock come to think. But then again, I don't have a buy signal, so I am still sitting on my hands even if the overall market is starting to move higher. But if I were buying....well this is the kind of stock I might be adding to my portfolio!
Thanks once again for taking the time to visit! If you have any comments or questions, please feel free to leave them on the blog or email me at bobsadviceforstocks@lycos.com.
Bob
Wednesday, 11 October 2006
A Reader Writes "....I was wondering if you could help me...?"
Hello Friends! Thanks so much for stopping by and visiting my blog, Stock Picks Bob's Advice! As always please remember that I am an amateur investor, so please remember to consult with your professional investment advisors priot to making any investment decisions based on information on this website.
As I do with each blog entry, I encourage you to drop me a line with your comments and questions at bobsadviceforstocks@lycos.com. And I mean it! I enjoy hearing from readers and try to answer and comment on as many of the emails as possible.
Earlier today, I saw that Eric P. had written me a note with a few comments and questions:
"Hey Bob!
Well, I am sort of new to your website, but I believe it has been a great resource to me to help research and learn stocks. Though recently I have been looking at this one Escala Group Inc. (ESCL), and I was wondering if you could help me try to figure out if this would be a good purchase or not. Also, I have been looking through your website, and I was wondering do you have an actually blog or article of how you research your stocks or how you filter through so many stocks? And do you have any tips to help me in my searches!
Thanks so much, and keep up the great work!
Eric"
First of all, thanks so much for writing. I cannot tell you whether ESCL would be a good purchase or not for you. I don't know your particular situation and I am not really qualified to do that. However, I can tell you a little about how the stock looks from my perspective.
I cannot go into my usual detail, but let's check it out. A couple of points, first of all Escala Group (ESCL) is a tiny company with a stock price significantly under $10. I try like crazy to avoid these stocks. With my tight 8% loss limit, a $5 stock can only drop $.40 before hitting a sale. And these little companies are quite volatile.
Furthermore, the company just a few days ago, on October 2, 2006, received notification from the NASDAQ that it risked delisting as it was late in filing its annual report for its year ended June 30, 2006. Apparently, Escala is investigating the Company's dealings with Afinsa Bienes Tangibles, S.A. "its majority shareholder". For me, this is much too much smoke occluding my view of the company's results. This is not a company that I would be interested in pursuing at this time on this blog.
It is true, on Escala's behalf, that the company does have a terrific Morningstar.com "5-Yr Restated" financials page. They do have a record of rapid growth recently both in terms of revenue, reported earnings, free cash flow, and a good balance sheet. Thus, if some of the questions on the results, delisting issues, are cleared up, this stock may well turn out to be a great investment! However, for me, that's a lot of ifs and buts. A bit too speculative for me both in terms of the share price, and the dark clouds overhanging the financial results.
Regarding your question of a blog on my strategy, I have done this on several occasions. Recently, I wrote up my strategy on November 21, 2005, I also had some additional comments on November 4, 2005. You also might enjoy my comments on June 17, 2005. Also check out comments on June 2, 2004. Also visit my Stock Picks Podcast Site and look through my topics to find my Investment Strategy Podcast.
In general, I write about my strategy throughout my many entries. Read a few and I think you will catch on!
How do I filter stocks? I hate to say it, but I do it manually. I literally do it like I say I do. I check the top % gainers list and look through it to see what stocks are over $10. Then I check Morningstar, the latest quarter, etc. Read my posts and I think it will be obvious.
Thanks so much for writing! Please let me know if I have answered your questions adequately. If not or if you or anyone else has questions or comments, please feel to enter them right here on the blog or email me at bobsadviceforstocks@lycos.com.
Bob
Newer | Latest | Older


