Stock Picks Bob's Advice
Monday, 5 March 2007
VCA Antech (WOOF) "Trading Transparency"
Hello Friends! Thanks so much for stopping by and visiting my blog, Stock Picks Bob's Advice! As always, please remember that I am an amateur investor, so please remember to consult with your professional investment advisors prior to making any investment decisions based on information on this website.
A few moments ago, as I have been commenting about here on the blog, my VCA Antech (WOOF) passed an (8)% loss position, and I sold my 180 shares, that I recently purchased, at $35.88. I had purchased these shares on February 22, 2007, at a cost basis per share of $39.21. With this sale, this represented a loss of $(3.33) or (8.5)% since purchase. I don't care how much I like this stock---a lot---rules are rules. And out the shares went. Especially with my heavy margin, I cannot afford to bend my trading rules and need to raise cash when stocks hit their sale points on the downside.
Fortunately, this is the first sale at a loss in this correction. Another recent purchase Harris (HRS) is also flirting with a sale and if it hits that 8% level, out it will go! As is my strategy, since this is a sale on "bad news", this does not entitle me to buy a replacement stock but requires, since I am above my minimum of 6 positions (now at 16) to 'sit on my hands' and use the money to either add to my cash position (or in my case to pay down some of the margin!).
Thanks again for visiting! If you have any comments or questions, please feel free to leave them on the blog or email me at bobsadviceforstocks@lycos.com. If you get a chance, be sure and visit my Stock Picks Podcast Website!
Bob
Saturday, 3 March 2007
"Looking Back One Year" A review of stock picks from the week of October 17, 2005

Hello Friends! Thanks so much for stopping by and visiting my blog, Stock Picks Bob's Advice! As always, please remember that I am an amateur investor, so please remember to consult with your professional investment advisers prior to making any investment decisions based on information on this website.
One of the tasks I assign myself each weekend is to review past stock picks. I want to find out if these picks would have been successful if I had actually purchased them (I only pick a few of the many stocks discussed on this blog to actually purchase for my own Trading Account.) This review assumes a "buy and hold" strategy. In fact, I practice and advocate something quite different--a strategy that involves selling losing stocks quickly and completely and gaining stocks partially and slowly. This difference in strategies would certainly affect the performance evaluation. I have been using the 'buy and hold' evaluation assumption simply for the ease in evaluating past stock picks.
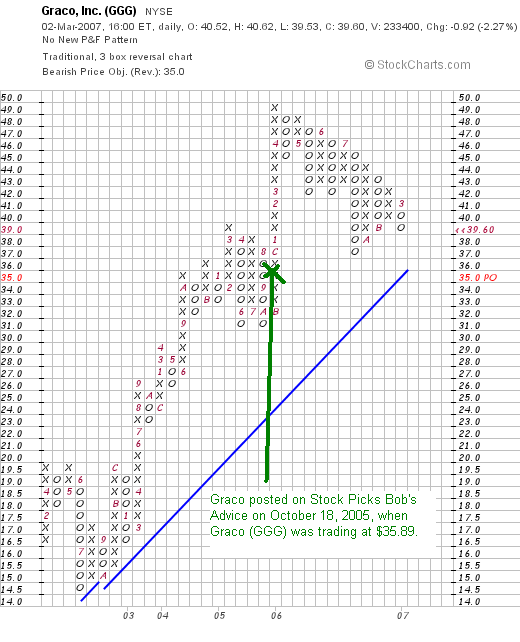
 On October 18, 2005, I posted Graco (GGG) on Stock Picks Bob's Advice when the stock was trading at $35.89. Graco closed at $39.60 on March 2, 2007, for a gain of $3.71 or 10.3% since posting.
 On January 29, 2007, Graco reported 4th quarter 2006 results. For the quarter ended December 29, 2006, net sales increased 10% to $203.4 million. Net earnings increased to $35.6 million from $32.3 million last year, and diluted earnings per share grew to $.52/share, up from $.46/share last year.
The company met analysts' expectations of $.52/share, but came in a bit light of expectations on revenue of $205.8 million.
 On October 18, 2005, I posted Pharmaceutical Product Development on Stock Picks Bob's Advice when the stock was trading at $62.26 as a "revisit". The first time I had written up PPDI, was on October 16, 2003, when the stock was trading at $29.16. I do not currently hold any shares or options on this stock. PPDI underwent a 2:1 split on March 1, 2006, making the latest pick price effectively $31.13. In a strange coincidence (?), PPDI closed at $31.13 on March 2, 2007, unchanged, from the prior post a bit more than a year ago.
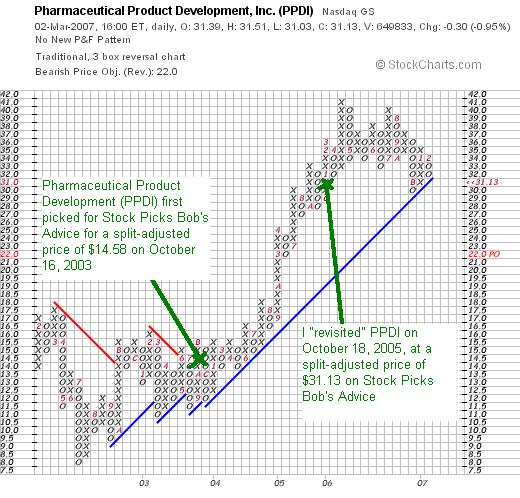
On February 5, 2007, PPDI reported 4th quarter 2006 results. Net revenue came in at $327.0 million for the quarter ended December 31, 2006, a 19.1% increase over net revenue of $274.6 million for the same quarter in 2005. Net income increased sharply to $41.6 million from $30.5 million in the same period last year. On a diluted eps basis, this came in at $.35/share, up from $.26/share last year.
The company beat expectations in the latest quarter which according to Thomson Financial, analysts had been expecting profit of $.33/share on revenue of $299.6 million.
 On October 19, 2005, I posted The Cheesecake Factory (CAKE) on Stock Picks Bob's Advice when it was trading at $34.88. CAKE closed at $26.68 on March 2, 2007, showing a decrease of $(8.20) or (23.5)% since posting.
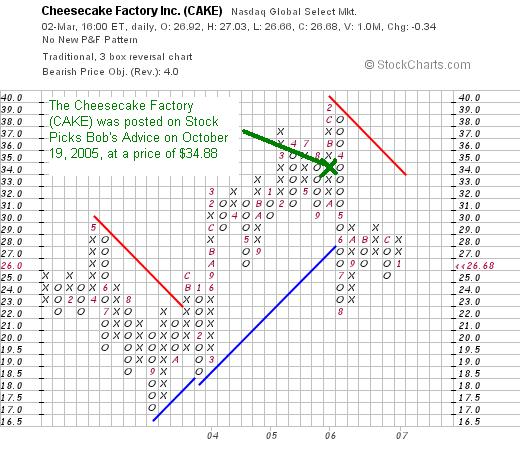
 On February 6, 2007, The Cheesecake Factory reported 4th quarter 2006 results. For the quarter ended January 2, 2007, revenue came in at $360.7 million, an 18% increase from the fourth quarter of 2005 when revenue was $328.6 million. Net income, however, dropped to $20.4 million in this year's fourth quarter compared with $22.6 million in last year's 4th quarter. On a per share diluted basis this worked out to $.26/share this year, down from $.28/share last year.
 On October 21, 2005, I posted SanDisk on Stock Picks Bob's Advice when it was trading at $56.45/share. SanDisk (SNDK) closed at $37.84/share on March 2, 2007, for a decrease of $(18.61) or (33.0)% since posting.
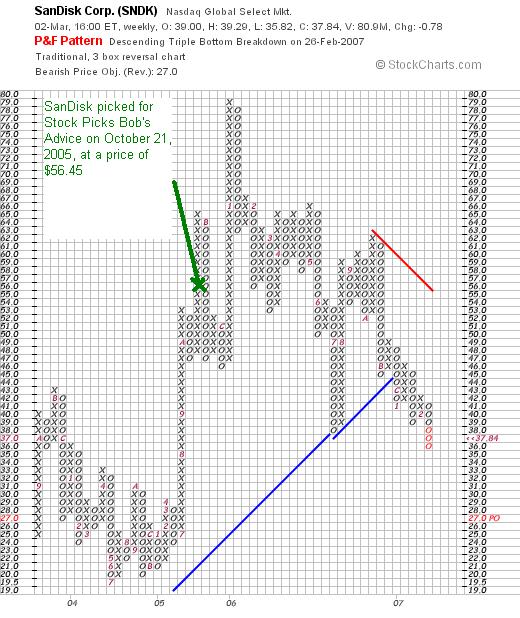
On January 30, 2007, SanDisk (SNDK) reported 4th quarter 2006 results. For the quarter ended December 31, 2006, revenue climbed 55% to $1.164 billion, compared with $750.6 million in the year-ago same quarter. Net income however, dropped to a loss of $(35.1) million, compared with an income of $133.9 million last year. On a diluted per share basis this worked out to a loss of $(.17)/share, compared with an income last year of $.68/share.
So how did I do with these four picks from that week in October, 2005? Mediocre in a word! In fact, the overall performance for these stocks, assuming an equal dollar purchase of each and a buy and hold strategy, works out to an average loss of (11.55)% on these stocks. It was certainly a difficult week for me picking stocks! Just goes to show that I am quite capable of picking stocks that lose money, and that it is imperative to have a strategy to limit losses to enhance your overall returns.
Thanks so much for stopping by! If you have any comments or questions, please feel free to leave them on the blog or email me at bobsadviceforstocks@lycos.com. If you get a chance, be sure and stop by and visit my Stock Picks Podcast Website where you can get a chance to listen to me discuss many of the same stocks I write about on the blog.
Have a great week trading everyone!
Bob
Posted by bobsadviceforstocks at 10:12 PM CST
|
Post Comment |
Permalink
Updated: Sunday, 4 March 2007 8:09 PM CST
Friday, 2 March 2007
Superior Energy Services (SPN)
Hello Friends! Thanks so much for stopping by and visiting my blog, Stock Picks Bob's Advice! As always, please remember that I am an amateur investor, so please remember to consult with your professional investment advisors prior to making any investment decisions based on information on this website.
 While this bear market correction continues, I still want to use each trading day to identify stocks that are 'high quality' companies which fit into my own trading strategy. While not in the market to be buying anything, and actually close to the sale point on a few stocks on the downside, I plan on continuing to expand my 'vocabulary' of investable companies, so that when the opportunity should arise, I shall be more literate in the investing world and ready to act in a knowledgeable fashion.
Looking through the list of top % gainers on the NYSE this afternoon, I came across Superior Energy Services (SPN), which closed at $32.72, up $1.47 or 4.70% on the day. I do not own any shares nor do I have any options on this company. I do believe that it meets many of the factors I use in selecting stocks and wanted to briefly share it with all of you.
What exactly does this company do?
 According to the Yahoo "Profile" on Superior, the company
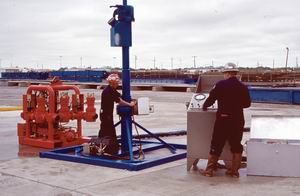
"...provides oilfield services and equipment focusing on serving the drilling and production-related needs of oil and gas companies primarily in the United States. It operates through five segments: Well Intervention Services, Rental Tools, Marine Services, Other Oilfield Services, and Oil and Gas Operations."
How did they do in the latest quarter?
Just this past Monday, on February 26, 2007, the company reported 4th quarter 2006 results. For the quarter ended December 31, 2006, revenue almost doubled at $319 million compared with $188 million in the same period last year (last year was negatively impacted by Katrina). Net income came in at $62.2 million, up again almost 300% from net income of $16.2 million, or $.76/share up again almost 300% from $.20/diluted share in the same period in 2005.
The company beat expectations, according to Thomson Financial, of earnings of $.71/share on revenue of $298 million.
In addition, the company raised guidance on the upcoming first quarter, announcing an expected increase of 90% from the year ago quarter. With last year's first quarter coming in at $.40/share, this would work out to $.76/share expected. Currently analysts are predicting earnings of $.73/share on revenue of $326.4 million in the first quarter of 2007.
How about longer-term results?
Examining the Morningstar.com "5-Yr Restated" financials on SPN, we can see that while revenue dipped from $449.0 million in 2001 to $443.1 million in 2002, it subsequently steadily increased to $735.3 million in 2005 and $962.7 million in the trailing twelve months (TTM). Earnings also dipped from $.77/share in 2001 to $.30/share in 2002. However, since 2002 earnings have steadily increased to $.85/share in 2005 and $1.75 in the TTM. The company has held its outstanding shares fairly stable, increasing by about 15% from 69 million to 80 million between 2001 and the TTM. In the same period, earnings were up over 100% and revenue also doubled.
Free cash flow has been positive but erratic over the past few years with $50 million in 2003, and $8 million in the TTM.
The balance sheet looks strong with $111.9 million in cash and $344.3 million in other current asssets giving the company a total of $456.2 million in total current assets, which when compared to the $253.8 million in current liabilities yields a current ratio of 1.80.
How about some valuation numbers?
Checking Yahoo "Key Statistics" on Superior Energy Services, we find that this is a mid cap stock with a market capitalization of $2.61 billion. The trailing p/e is a very reasonable 14.13, with a forward p/e (fye 31-Dec-08) estimated at a dirt cheap 8.45. The PEG, (5 yr expected) is estimated at 0.23, which again is a screaming buy, with a reasonable PEG being priced between 1.0 and 1.5 from my experience.
Referring to the Fidelity.com eresearch website, we find that the Price/Sales (TTM) is also reasonable when compared to similar companies coming in at 2.28 when the industry average is higher at 3.05.
In terms of profitability, the Return on Equity (TTM) is nearly at the average with SPN coming in at 29.59%, compared to an industry average essentially the same of 29.99%.
Finishing up with Yahoo, we find that there are 29.83 million shares outstanding with 79.23 million that float. As of 1/9/07, there were 2.37 million shares out short representing 3% of the float or 2.1 trading days of volume. No dividend is paid, and no stock splits are reported on Yahoo.
What does the price chart look like?
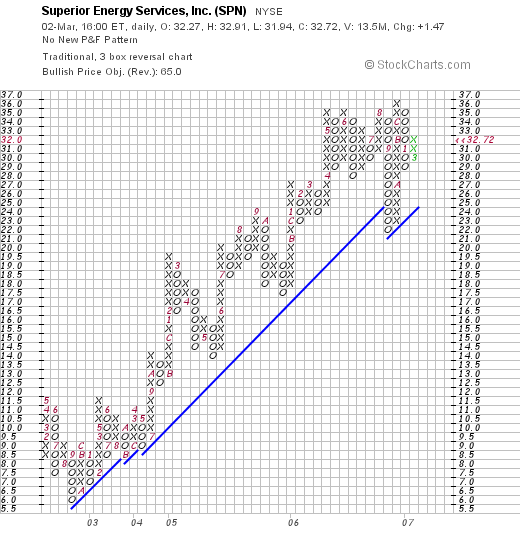
Looking at a "Point & Figure" chart on Superior (SPN) from StockCharts.com, we see that this stock has actually very steadily been increasing its share price from a low of $6/share in September, 2002, to a high of $36 in September, 2006. the stock is currently near its high at $32.72.
Summary: What do I think?
Well, I am not a big fan of commodity-driven stocks and this company certainly is subject to the effects of the oil market. However, in light of the fabulous earnings, its recent inclusion in the S&P Midcap 400, the steadiness of its earnings and revenue growth, and the cheapness in terms of p/e, PEG, and even Price/sales, this appears to be a relatively lower risk investment than might be expected. If I were buying a stock, I might well buy shares of this one. Of course, instead of buying anything, I am anxiously awaiting the next drop in the market when I shall probably start to unload shares instead. But that is another discussion entirely!
Thanks so much for stopping by and visiting! If you have any comments or questions, please feel free to leave them right in the blog or email me at bobsadviceforstocks@lycos.com. Also, be sure and visit my Stock Picks Podcast Site where I discuss many of the same stocks I write about on the weblog.
Bob
Thursday, 1 March 2007
It All Comes Back to Iraq.
Those of you who know me better know that I also have a political hat that I sometimes wear. As we face this market correction, I do think that we should ask whether there is something basically wrong with our government management of the American economy in the face of a questionable foreign policy. We can argue whether America needed to be involved in Iraq. Whether thst policy was implemented in an appropriate fashion.
But of greater concern, is my question whether it was responsible for this Administration to pursue a policy of tax cuts during a time of growth in expenditures. This pursuit of lower taxes without any regard to fiscal responsibility and reducing deficits, a policy that had been successfully pursued under the previous President Clinton, has resulted in reliance on the Federal Reserve which is supposed to manipulate money supply and inter-bank loan rates to control inflation.
Our deficit in America is now being held more and more by investors offshore and our economic future is more and more dependent on the success of economies in places such as China and other countries that hold more and more of our dollar-based Treasury notes and obligations.
The dollar has suffered as more have been 'printed', with the dollar dropping against foreign currencies. Yet we have not acted to reduce our dependence on foreign oil, we have not required more fuel efficiency from our vehicles, we have not made the needed investments in alternative fuels, we have not made Kyoto a goal, but have continued to increase our addiction on oil produced in areas of the world that are growing hostile to our own interests. Our trade deficits have grown simultaneous with our fiscal deficit.
So when we hear about how China can affect our own market, let us not examine this in a vacuum. Let us realize that we have been misled by our politicians who depended on our own greed to allow them to fail to make the hard decisions to restore fiscal responsibility and instead promise us never-ending 'tax cuts'. This fuzzy-math economics is coming home to roost.
And when we get out to drive in our Suburbans, Tahoes, and heavy-duty pick-ups, gloating about how we can buy gas cheaper than they do in Europe where high prices has moved drivers to efficient vehicles, let us be aware that our inability to encourage our leaders to make the hard decisions is costing us hard right here at home.
O.K., enough of the politics. But don't you just get sick when you see futures down more than 100 points before the market opens!
Wishing you all well. I shall try to reduce my political ranting here and try to stick to stocks. But let me know if it is ok with all of you to intersperse these stock market discussions with occasional political subjects. Whether you agree with me or not, I encourage you to respond to what I say and you are welcome to join in the discussion.
Bob
Wednesday, 28 February 2007
Deckers Outdoor (DECK)
Hello Friends! Thanks so much for stopping by and visiting my blog, Stock Picks Bob's Advice! As always, please remember that I am an amateur investor, so please remember to consult with your professional investment advisers prior to making any investment decisions based on information on this website.
 This morning I noticed that Deckers Outdoor Cp (DECK) was on the list of top % gainers on the NASDAQ. It has some interesting features that make it suitable for this blog. However, as the day went on, other stocks started outperforming DECK and it didn't make the final list of top gainers. The stock, however, still deserves a review! It closed today at $65.20, up $3.75 or 6.10% on the day. I do own 95 shares of DECK in a managed retirement account that I have assigned management responsibility to my own advisers.
Let's take a look at this company and I shall share with you why I am so enthusiastic about the stock!
What exactly does this company do?
According to the Yahoo "Profile" on Deckers, the company
 "...engages in the design, production, and brand management of footwear for men, women, and children in the United States. Its products include slides, sport sandals, thongs, amphibious footwear, trail running shoes, hiking boots, rugged closed-toe footwear, sheepskin boots and slippers, and other casual footwear. The company provides its products under Teva, Simple, and UGG brand names."
How did they do in the latest quarter?
What drove the stock higher today, as is often the case on stocks discussed on this blog, was the announcement of 4th quarter 2006 results yesterday after the close of trading yesterday. For the quarter ended December 31, 2006, net sales increased 36.7% to $124.4 million from $91.0 million. Net income came in at $23.5 million, up almost 100% from $12.1 million reported in the same period in 2005. Diluted earnings per share increased 93.6% to $1.82 from $.94/share last year.
The company blew away analyst expectations of a profit of $1.31/share on revenue of $110.7 million. The company announced 1st quarter 2007 guidance with earnings and revenue expected to increase 15% over the same quarter in 2006.
How about longer-term financial results?
Reviewing the Morningstar.com "5-Yr Restated" financials on DECK, we find that the company has shown recent rapid growth in revenue from $91.5 million in 2001 to $264.8 million in 2005 and $271.0 million in the trailing twelve months (TTM). Earnings, initially erratic, dipped from $.17/share in 2001 to a loss of $(.75)/share in 2002. However, since then they have turned profitable and increased quickly to $.77/share in 2003, $2.48/share in 2005 and $2.42/share in the TTM. Normally, I would be avoiding a stock with a recent dip in earnings. However, in light of the spectacular latest quarterly report, this doesn't appear to be a significant drop-off in earnings growth.
The company has been increasing its shares somewhat from 9 million in 2001 to 13 million in the TTM. This less than a 50% dilution in shares comes alongside essentially a 200% increase in revenue and a more than 1000% increase in earnings. This is an acceptable dilution imho.
Free cash flow is positive and increasing recently with $17 million reported in 2003, $11 million in 2004, then growing to $26 million in 2005 and $37 million in the TTM. The balance sheet looks solid with $45.3 million in cash, enough to easily cover the $26.3 million in current liabilities and the $4.3 million in long-term liabilities combined with literally millions left over! Calculating the 'current ratio', we find a combined $155 million in current assets, which when divided by the $26.3 million in current liabilities yields a strong 5.89.
What about some valuation numbers on this stock?
Looking at Yahoo "Key Statistics" on DECK, we can see that this is a small cap stock with a market capitalization of only $819.04 million. The trailing p/e is a reasonable (imho) 26.91, with a forward p/e (fye 31-Dec-07) estimated at 20.96. With the rapid growth anticipated, the PEG (5 yr expected) comes in at an acceptable 1.43.
Using the Fidelity.com eresearch website, we find that DECK has a Price/Sales (TTM) ratio of 2.53 compared to an industry average of 2.61. The company also has a fairly average Return on Equity (ROE) (TTM) of 21.28%, compared to the industry average of 21.59%.
Finishing up with Yahoo, we find that there are 12.56 million shares outstanding with 10.97 million that float. As of 1/9/07, there were 1.71 million shares out short representing 14.8% of the float. This may also be calculated as 7 trading days of volume (the short ratio). Since this is in excess of my own arbitrary '3 day rule' for short interest, this appears to be a significant short interest level and may well be fueling the price rise today on the back of good news. No dividend is paid and no stock split is reported on Yahoo.
What does the chart look like?
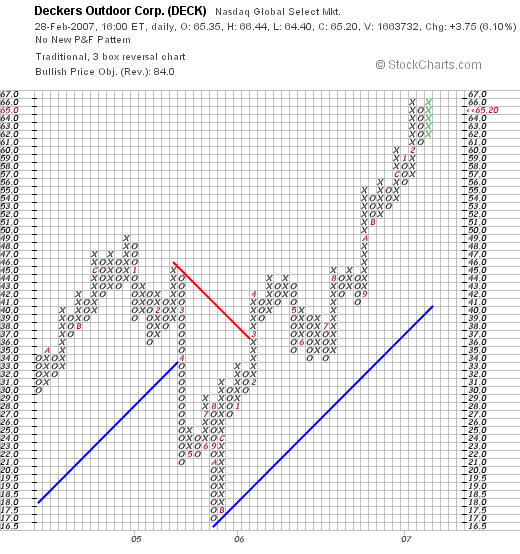
Examining a "Point & Figure" chart on Deckers Outdoor (DECK) from StockCharts.com, we can review the price appreciation from $30 in late 2004 to $49 before a sharp correction down to $17 in October, 2005. Since late 2005, the stock has been moving steadily and sharply higher closing today near its high at $65.20.
Summary: What do I think?
Well I do actually own some shares of DECK, although this holding is not part of my trading portfolio which I manage, so take that into consideration. But let's review some of the things of interest. First of all, the stock moved strongly higher today on a fabulous earnings report which blew away the estimates on both revenue and earnings. They have been growing revenue strongly the past several years along with earnings. Free cash flow has been positive and growing and the balance sheet appears to be rock solid.
Valuation-wise, the p/e isn't bad and the PEG is under 1.5. The Price/Sales and ROE figures are fairly average for DECK's industrial group. There are lots of shares out short which may well be fueling the additional stock increase with the terrific earnings report. Finally, the graph looks strong.
There are a good number of reasons why I like this stock and have included it here on the blog! Now of course, I would buy a stock like this if I had the 'permission' to add a position. Unfortunately, I am only close to a sale of one of my holdings (WOOF) which would result in me 'sitting on my hands' and not going shopping so to speak. In any case, this is a stock that is now in my vocabulary, and I hope yours as well!
Thanks again for visiting! If you have any comments or questions, please feel free to leave them on the blog or email me at bobsadviceforstocks@lycos.com. If you get a chance, please feel free to visit my Stock Picks Podcast Website, where I discuss many of the same stocks I write about here on this weblog. Wishing you all a successful week trading.
Bob
Tuesday, 27 February 2007
A Reader Writes "I'd just like to get your opinion on this market...."
Hello Friends! Thanks so much for stopping by and visiting my blog, Stock Picks Bob's Advice! As always, please remember that I am an amateur investor, so please remember to consult with your professional investment advisers prior to making any investment decisions based on information on this website.
 I did what all investors did today. I watched in rather a state of disbelief as many of my gains were diminished by the relentless selling on Wall Street. Thus, with this perspective, I would like to share with you a letter from a loyal reader, William S. who writes for my views on the market melt-down:
"Hi Bob,
I'd just like to get your opinion on this market that is falling today. Even though fortunately none of my holdings are going into losses from my buy points, I am still watching plenty of nice gains vanish in a day that have been working for weeks or months, which is very frustrating. Does a day like this cause you to do any extra selling to lock in more gains than you might not otherwise, or do you just take it and keep a longer term view assuming you believe in your stocks and the companies behind them (which of course can be two different things).
Hope all is well...
Bill"
Thanks so much for writing Bill. I believe, as I responded, that you were writing to me just as I was writing my previous entry. Let me try to more directly respond to your inquiry.
I too watched many nice gains either vanish or diminish as the selling developed. Do I respond with any 'extra selling'. I didn't. Maybe I should have, but that isn't my strategy.
You are absolutely right about the stocks and companies being two different things. In the long run, the best companies shall have the best stocks to own. That is my ultimate belief.
So what do I do when things are melting down? I watch my portfolio, and if any of my stocks hit sale points, I sell. Thus far, nothing needed a sale. I have several now that are in small loss positions, and I wouldn't be surprised if my VCA Antech (WOOF) which is showing a bit more than a (5)% loss hits that (8)% loss limit tomorrow if the selling persists. If so, I shall unload shares.
Is this the best way to deal with a precipitous correction? Probably not. But I don't know that I can do any better. I don't know when a correction is done or just beginning. I don't know what the market will do next week or next month.
When I do have gains, you know that I am quick to take some of the profit off the table. It is my concern about events like today that drives me to keep hedging my bet you could say. And when stocks start losing money, then I am quick to sell them completely. I am trying very hard to avoid losses.
But I believe that the companies that I own are the right companies to be shareholders in. That doesn't mean I shall blindly hold on to them. No, I shall continue to stick to my trading rules. If I need to liquidate half of my stocks tomorrow morning, then that is what I shall do. But I personally use my own trading rules to guide my own actions. It is less stressful (?) to have a plan of action than to fret about when to pull a plug or to (?) start nibbling on dividend stocks as I heard Jim Cramer talk about tonight.
I will not be buying on weakness. The old problem of 'catching a falling knife' holds true. But I do not plan on panic either. Maybe it is wiser to panic (?), but it is better imho to face a chaotic market with reason than with rash decisions. Is this the best approach? Will my own approach even remain profitable in the face of a ferocious correction?
I guess that is what this blog is all about. It is not that I have all the answers. Or even the best approach. I am just trying to find an approach that will work for me. I have tried to anticipate market actions and to plan on my response each time. Thus far it is working. Let's see how it works tomorrow.
Good-luck my friend! Figure out your own 'rules' and apply them. You will not win every time against the market. But each time you face a difficult market environment, you shall be wiser if you are able to assess why what you did worked or why it was unsuccessful. I shall keep you posted.
Bob
On Dealing with Market Declines.
Hello Friends! Thanks so much for stopping by and visiting my blog, Stock Picks Bob's Advice! As always, please remember that I am an amateur investor, so please remember to consult with your professional investment advisors prior to making any investment decisions based on information on this website.
Market declines and sell-offs are painful if you are sitting in long positions instead of being the short-seller hoping for such corrections. I have a long list, as I am sure you do as well, of stocks that are moving in multi-percentage drops today.
As part of what I do to manage my portfolio, I have a disciplined strategy for selling stocks that either hit an 8% loss after a first purchase (unfortunately WOOF is close), or selling at 'break-even' if I have sold a partial position after a single appreciation target has reached. Otherwise, if I have sold more than one time, my sale point remains at 50% of my highest partial appreciation target. That is, if I have sold a stock four times (at 30, 60, 90 and 120% points), then I plan on selling all remaining shares if the stock should retrace to a 60% gain point.
I discuss this because if you do not have any plan on dealing with market corrections, then you will not know when you wish to sell and will need to basically 'shoot from the hip' and take your best shot at a strategy. You may well do better than I do with my idiosyncratic approach. I am afraid that my strategy is slow to react, but then again, I try to avoid being whipsawed in my holdings.
Rest assured that my own portfolio is hitting the skids hard today. I am seeing many of my paper gains deteriorate, but it is the combination of disciplined selling of stocks, both when times are good and when times are bad, that I am banking on for long-term success.
In order to respond to market influences, if any of my stocks do hit sales on the downside, then I shall be selling those shares and "sitting on my hands" with the proceeds to avoid compounding my losses by reinvesting at the wrong time. This process of avoiding re-investing will tend to move my portfolio from equities towards cash automatically in the face of market declines. The reverse should also be true.
Good-luck! I hope I shall not need to post any sales today, but I shall be ready to part with even my favorite of recent stocks if the price moves dictate that action.
Bob
Saturday, 24 February 2007
Agree Realty (ADC) "Long-Term Review #5"

Hello Friends! Thanks so much for stopping by and visiting my blog, Stock Picks Bob's Advice! As always, please remember that I am an amateur investor, so please remember to consult with your professional investment advisers prior to making any investment decisions based on information on this website.
As of today, I now have 1,400 entries in this blog! To say that it is becoming unwieldy would be to underestimate the problem! Recently, to try to add to the value of this website, and to find out how some of the really longer-duration stock picks have turned out, I have been trying to go literally into the earliest posts on stocks, reviewing them in order. About three weeks ago, I reviewed AMN Healthcare (AHS), which was first posted on May 15, 2003. Let's take a look at Agree Realty (ADC) which I posted on Stock Picks Bob's Advice on May 16, 2003. On that date I wrote:
"May 16, 2003 Agree Realty Corporation (ADC)
It is 1:13 Central Time here in Wisconsin and the market is fighting back to even. Unfortunately hit my 8% stop in my own portfolio and went ahead and sold my BBA shares (Bombay). Since I am in margin, went ahead and applied the proceeds to my margin account....will wait for a 40 or 50% gainer to sell a little and add a position.
Interestingly, looking through the biggest percentage gainers, we have come across a REIT. These are the Real Estate Investment Trust type companies that own properties such as apartment buildings and retail/office space. This company reported the first quarter results on April 22nd, with a 15.5% increase in net income and a 13.8% increase in revenues and declared a $.48 dividend as well. The company yields a nice 8.57% (!!) dividend as well. I do not own any shares and do not plan at this time on acquiring any. (you know how the portfolio rules go....around here).
Agree is trading as I write at $23.41/share up $1.00 on the day (a 4.46% rise). Stock by the way has a p/e of 11.04 and a market cap (tiny) of $104.9 million. There are ONLY 4.48 Million shares outstanding and of these only 3.90 Million 'float'..
Looking at Morningstar, we see a nice trend with 19.7 Million in revenue in 1998, 21.9 million in 1999, 23.7 million in 2000, 24.7 million in 2001, and 25.8 million in 2002. Not meteoric, but consistent. Looking at the last quarter revenue of just over 7 million, we can anticipate, if things hold true...a 28 million revenue in 2003. Not too shabby.
I don't like the small float on this one and thus the lack of attention the street pays....but with an 8.5% dividend, when money funds are generating about 0.9%....what the heck! This stock is worth a shot...but hang onto the 8% stop loss if you choose to invest. Good luck! And have a great weekend!
Bob"
Let's take a closer look at this stock pick, again assuming a "buy and hold" approach to this stock and find out how the fundamental information may have changed since that entry almost four years (!) ago.
 First of all, Agree Realty (ADC) closed at $34.62 on February 23, 2007, for an appreciation of $11.21 or 47.9% since posting. I do not, and in fact have never, had any shares of this company, nor do I own any options.
How did they do in the latest quarter?
On October 31, 2006, Agree reported 3rd quarter 2006 results. For the quarter ended September 30, 2006, funds from operations (as the report relates) came in at $4.90 million, vs. funds from operations in the same quarter in 2005 of $4.95 million. Diluted funds per share were $.59 vs. $.59 in the same period last year. Net income was $3.4 million or $.44/diluted share, compared with $3.5 million or $.45/diluted share the prior year. Total revenues did increase 5.4% to $8.1 million, compared with total revenues of $7.7 million in the 3rd quarter of 2005. Thus while revenue did increase modestly year-over-year, earnings were flat to mildly lower this year.
What does the Morningstar.com report look like?
As is the case with REIT's, the Morningstar.com data is incomplete. We do know that revenue has increased steadily from $22 million in 2001 to $32 million in 2005, an approximately 50% increase in revenue. Earnings have increased modestly from $1.83 to $2.14 between 2001 and 2005, but have shown a dip of a penny to $2.13/share in the TTM, likely explained by that $.44/share vs $.45/share the prior year noted in the above discussion on latest earnings. Dividends have been boosted slightly from $1.84/share to $1.96/share from 2001 to 2005. Also of note, is the 60% increase in outstanding shares from 5 million in 2003 to 7 million in 2005 and 8 million in the TTM. Free cash flow and balance-sheet figures aren't reported on Morningstar. (But I believe that this is due to the type of company rather than anything else.....probably why I avoid stocks with gaps like this currently).
What does the chart look like?
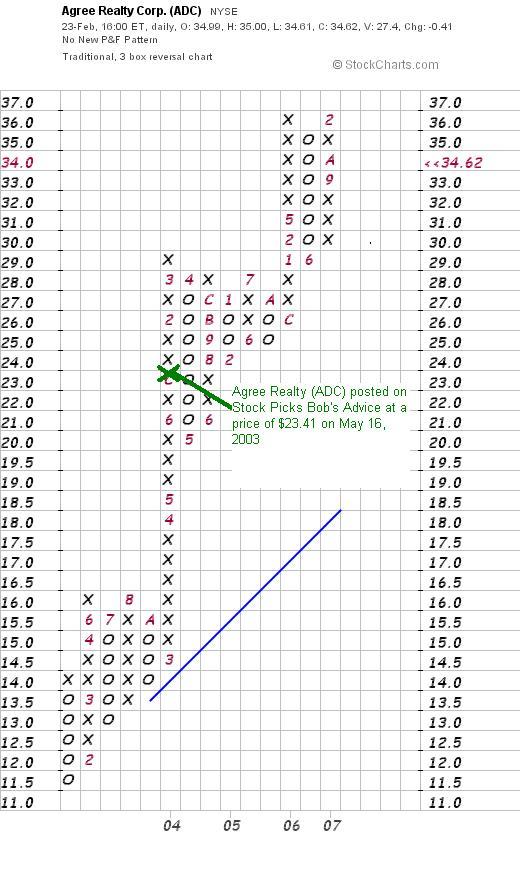
If we take a look at a "Point and Figure" Chart on Agree Realty (ADC) from StockCharts.com, we can actually see what appears to be a still-strong picture of a steadily appreciating price performance for this REIT.
Summary: What do I think?
Well this is an interesting stock, but not one that I would be writing up today! I now depend more on Morningstar.com figures and insist on increasing revenue, increasing earnings, and information on the balance sheet and free cash flow. But the stock did do well after posting!
Thanks again for visiting! If you have any comments or questions, please feel free to leave them on the blog, or email me at bobsadviceforstocks@lycos.com. Have a great weekend everyone!
Bob
Posted by bobsadviceforstocks at 3:48 PM CST
|
Post Comment |
Permalink
Updated: Saturday, 24 February 2007 3:49 PM CST
"Looking Back One Year" A review of stock picks from the week of October 10, 2005
Hello Friends! Thanks so much for stopping by and visiting my blog, Stock Picks Bob's Advice! As always, please remember that I am an amateur investor, so please remember to always consult with your professional investment advisers prior to making any investment decisions based on information on this website.
One of the jobs I like to do on weekends is to review past stock picks in as organized a fashion as possible. This "Weekend Review" started a couple of years ago, when I realized I needed to start examining past stock selections to find out how they all turned out. These reviews assume a "buy and hold" strategy. In practice, if you follow this blog on a regular basis, you will know that I employ my own idiosyncratic disciplined portfolio management system in which I sell my losing stocks quickly and completely and sell my gaining stocks slowly and partially at targeted appreciation levels.
But for the sake of this blog and the ease of reviewing past stock picks, I assume a strategy of buying equal $ amounts of each stock 'picked' and I assume I held onto those positions regardless of the price change. The difference between this strategy and what I actually employ and advocate in my blog would certainly affect actual performance.
 During the week of October 10, 2005, I actually only 'picked' one stock for the blog, although I note that I had several discussions with readers about other stocks that week. Johnson Controls (JCI) is a stock that both my wife and my son have shares in, but I do not own any shares in my own "trading portfolio". This is one of my 'great Wisconsin firms' that I have written about on the blog. But of course I am proud of manufacturing companies from my adopted home state.
On October 12, 2005, I "revisited" Johnson Controls when the stock was trading at $63.60. I actually first wrote up Johnson Controls (JCI) on July 9, 2004, almost three years ago when the stock was trading at $53.24. Johnson Controls closed at $97.81 on February 23, 2007, for a gain of $34.21 or 53.8% since posting last year. More recently, I "revisited" Johnson Controls on Stock Picks Bob's Advice on December 20, 2006, when the stock was trading at $86.50.
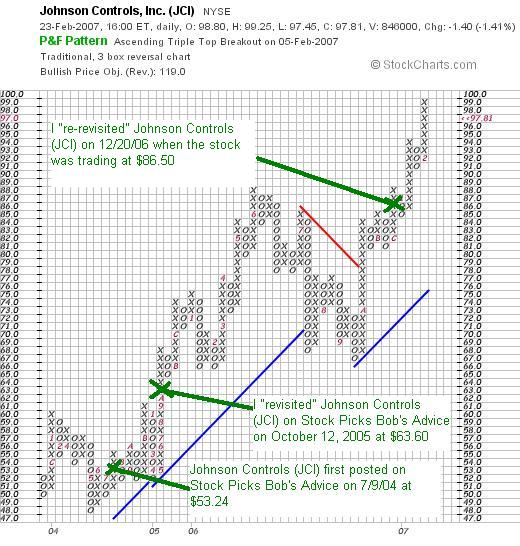
On January 19, 2007, Johnson Controls (JCI) reported 1st quarter 2007 results. Sales for the quarter ended December 31, 2006, rose 9% to $8.2 billion from $7.5 billion in the prior year. However, net income dipped to $162 million or $.82/diluted share, down from $165 million or $.85/diluted share in the same period the prior year. No matter how much I like JCI, and no matter how well this stock has performed on this blog, the earnings report gets a 'thumbs-down' whenever it shows a decrease in either revenue or earnings on this blog.
So how did I do with this single stock pick from that week in October, 2005? Terrific! It showed an appreciation of 53.8% since posting in October, 2005.
Thanks so much for visiting! If you have any comments or questions, please feel free to leave them on the blog or email me at bobsadviceforstocks@lycos.com. If you get a chance, be sure and drop by and visit my Stock Picks Podcast Website where I discuss some of the stocks I write about here on the blog.
Bob
Posted by bobsadviceforstocks at 11:05 AM CST
|
Post Comment |
Permalink
Updated: Saturday, 24 February 2007 2:21 PM CST
Universal Electronics (UEIC)
Hello Friends! Thanks so much for stopping by and visiting my blog, Stock Picks Bob's Advice! As always, please remember that I am an amateur investor, so please remember to consult with your professional investment advisers prior to making any investment decisions based on information on this website.
 As I promised yesterday, let's take a closer look at Universal Electronics (UEIC) that I added to my own trading portfolio after my partial sale of Bolt (BTJ). UEIC closed at $27.89, up $5.35 or 23.74% on the day. This stock easily made the list of top % gainers on the NASDAQ. As I just indicated, this particular stock is a stock that I now am an owner of, so please take that into consideration as well.
What exactly does this company do?
According to the Yahoo "Profile" on Universal Electronics, the company
 "...provides preprogrammed wireless control products and audio-video accessories for home entertainment systems, as well as software designed to enable consumers to wirelessly connect, control, and interact with a home environment. The company's family of preprogrammed wireless control products includes touch screen remote controls, wireless keyboards, game controllers, antennas, and various audio/video accessories, as well as custom and customizable microcontrollers that include its library of infrared remote (IR) codes, proprietary software, and digital media control software."
How did they do in the latest quarter?
It was the announcement of 4th quarter 2006 earnings and 2007 guidance after the close of trading Thursday that drove the stock higher Friday. Net sales for the quarter came in at $69.7 million, an increase of $20.4 million or 41.4% over sales of $49.3 million in the same period in 2005. Net income for the quarter was $5.4 million or $.37/share, compared to $3.5 million or $.25/diluted share, approximately a 50% increase year over year.
This $.37/share exceeded expectations of $.32/share according to analysts following the stock. The company also raised guidance for 2007 to earnings of $1.13 to $1.23/share. This was ahead of 'Wall Street estimates' of $1.09/share. From my own perspective, the combination of strong revenue increases with earnings growth which exceed expectations and having the company raise guidance in the same announcement is often associated with a price increase in equities.
How about longer-term financial results?
Reviewing the Morningstar.com "5-Yr Restated" financials on UEIC, we can see that except for a dip in revenue between 2001 and 2002 when revenue dropped from $119 million to $104 million, the company has been steadily increasing revenue up to $181 million in 2005 and $202 million in the trailing twelve months (TTM).
Earnings which also dipped from $.78/share in 2001 to $.42/share in 2002, have subsequently steadily increased to $.69/share in 2005 and $.77/share in the TTM. No dividends are paid and the outstanding shares have remained steady at 14 million in 2001 and 14 million in the TTM.
Free cash flow, which dropped from $17 million in 2003 to $1 million in 2004, increased to $11 million in 2005 and $14 million in the TTM.
The balance sheet, as presented on Morningstar, appears very solid with $58.8 million in cash, which alone can easily cover both the $47.0 million in current liabilities and the negligible $100,000 in long-term liabilities. Calculating the current ratio, we get a total of $137.4 million in total current assets which when compared to the $47.0 million in current liabilities yields a current ratio of 2.92. Generally ratios over 1.25 are considered 'healthy'.
How about some valuation numbers?
Checking the Yahoo "Key Statistics" on Universal Electronics, we can see that this is a small cap stock with a market capitalization of only $390.49 million. The trailing p/e is a moderate 34.22, with a forward p/e (fye 31-Dec-07) estimated at 25.82. With the rapid growth, the PEG ratio (5 yr expected) is estimated at 1.24. This is well within my 1.0 to 1.5 range that I view as a reasonable PEG.
According to the Fidelity.com eresearch website, UEIC has a Price/Sales (TTM) ratio of 1.63 with an industry average of 1.22. The company also has a return on equity (TTM) of 11.14% close to the industry average of 11.65%. At least by both of these valuations, we find that the company is selling at a slight premium to its peers in the same industrial group.
Finishing up with Yahoo, we see that there are 14 million shares outstanding with only 13.86 million that float. Of these shares that float, there were 428,400 shares out short as of 1/9/07. This represents 11.4 trading days of volume (short ratio) due to the low average volume of 65,686 shares. This significant short interest may well have 'squeezed' the short-sellers yesterday causing the sharp price increase as short-sellers, I suspect, were scrambling to exit their positions by buying back shares that they had previously sold to close out their speculation on a price drop.
As I noted, no dividends are reported on Yahoo, and the last stock split reported was a 2:1 split in February, 2000.
What does the chart look like?
Taking a look at the "Point and Figure" Chart on Universal Electronics, actually for the first time as I write this up, I am struck by what appears to be a classical William O'Neil "Cup and Handle" configuration.
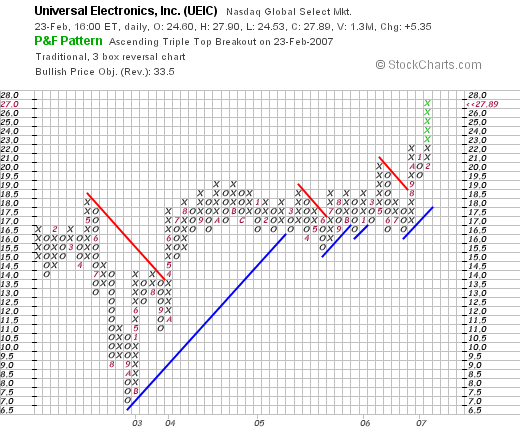
Now I am not a technician, and I don't put a huge amount of weight into stock price patterns, but I remember reading about cups and handles when reading How to Make Money in Stocks...and even this is a Point and Figure Chart, this certainly has that characteristic, of a dip, a long period of consolidation, then a break-out on the upside.
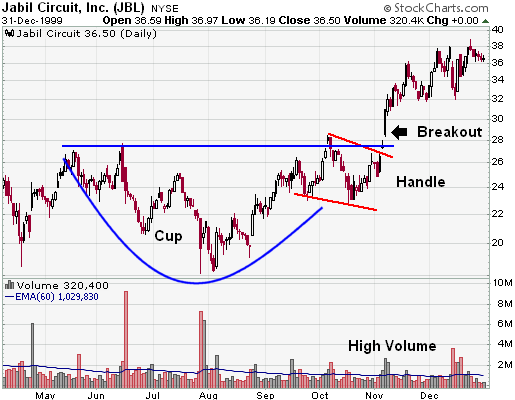
This is an illustration of a Point and Handle from StockCharts.com:
In any case, whether the stock is truly a "cup and handle" or not, the chart appears encouraging because the stock is just now moving higher after a long period of moving sideways. It certainly doesn't appear over-extended.
Summary: What do I think?
To summarize, I liked this stock enough to buy some shares :). The stock moved strongly higher yesterday, likely as shorts were squeezed. They announced great earnings results, exceeded estimates, and raised guidance. The Morningstar.com looks nice with several years of revenue and earnings growth without increasing the stock float. Free cash appears positive and growing, and the balance sheet is solid. Valuation-wise the p/e is a tad rich but the PEG suggests reasonable valuation. The Price/Sales and the ROE are a bit under their peers but with the strong growth, a premium might well be worth it. Finally, the chart looks solid.
I had that nickel in my pocket for about 15 minutes, lol, and I spent it. Now I got myself a remote control stock :). Hope it works out great!
Thanks so much for stopping by and visiting! As always, if you have any comments or questions, please feel free to leave them on the blog or email me at bobsadviceforstocks@lycos.com. If you get a chance, feel free to visit my Stock Picks Podcast Website where I discuss some of the many stocks I write about here on the blog.
Bob
Newer | Latest | Older


