Stock Picks Bob's Advice
Tuesday, 26 February 2008
"Trading Portfolio Update" February 26, 2008
Hello Friends! Thanks so much for stopping by and visiting my blog, Stock Picks Bob's Advice! As always, please remember that I am an amateur investor, so please remember to consult with your professional investment advisers prior to making any investment decisions based on information on this website.
It has been a couple of months since I reported my Trading Portfolio. In fact, I last reviewed my portfolio on December 30, 2007. Since I am participating with Covestor, you can visit my Covestor Page where you can review daily updates of my trading portfolio including performance, holdings, and comments. However, Covestor calculates performance since my signing-up for this service (June 12, 2007), and since many of my holdings and investment experience predate that time, it may be helpful to review my performance since purchase of those stocks acquired prior to participating with Covestor.
This review is the status of my account as of the close today, February 26, 2008. The holdings are listed in the alphabetic order of their symbols (as is done by Fidelity), followed by the number of shares, date of purchase, price of purchase, latest price (2/26/08), and percentage unrealized gain or (unrealized loss).
Copart (CPRT), 210 shares, 9/27/07, $33.73, $39.95, 18.45%
Covance (CVD), 102 shares, 4/9/07, $62.61, $86.24, 37.74%
IHS Inc (IHS), 140 shares, 10/1/07, $58.53, $64.59, 10.36%
Morningstar (MORN), 103 shares, 11/22/05, $32.57, $66.80, 105.07%
ResMed (RMD), 150 shares, 2/4/05, $29.87, $41.60, 39.28%
Silicom (SILC), 350 shares, 1/28/08, $13.67, $15.61, 14.19%
Meridian Bioscience (VIVO), 171 shares, $7.42, $35.12, 373.38%
Currently I am down to 7 positions, with my minimum number of positions being 5 and my maximum 20. My market value of my securities is $50,818.00, and I have an additional $619.03 in money market funds. In other words, with the decline, my margin has been paid off and I have a small balance. This is improved from the $(28,707.47) in margin reported two months ago which at that time made for an equity percentage of 68.30%.
As of February 26, 2008, I had a net of $1,653.77 in realized gains consisting of $(1,629.73) in short-term losses and $3,283.50 in long-term gains in 2008. As of February 26, 2008, my stocks had a total of $15,266.17 in unrealized gains.
As of this date, I have had $23.94 in total income and have paid $(221.13) in margin interest in 2008.
2008 has already been a challenging year for me. You will see that none of my stocks are showing losses, I have realized net gains for this year, and my system of responding to the market is automatically working as my total number of positions is down to 7.
I shall be waiting for either another sale signal or a signal to be adding a new position on a partial sale on good news. Until then,
Yours in investing,
Bob
Monday, 25 February 2008
Zebra Technologies (ZBRA)
Hello Friends! Thanks so much for stopping by and visiting my blog, Stock Picks Bob's Advice! As always, please remember that I am an amateur investor, so please remember to consult with your professional investment advisers prior to making any investment decisions based on information on this website.
There has been rather 'slim pickings' around these parts both for blog entries and investment ideas. In fact the market tone has been rather dismal as in a reverse-Midas situation, everything I look at investment-wise has been turning from gold into something else. So with a bit of trepidation, I would like to share with you a stock that appears to well deserve a place on this website.
ZEBRA TECHNOLOGIES (ZBRA) IS RATED A BUY
 Let me share with you some of the things that led me to this decision. I do not currently own any shares nor do I have any options in this stock. Zebra (ZBRA) came to my attention today when it made the list of top % gainers on the NASDAQ. As I write, ZBRA is trading at $33.10, up $3.72 or 12.66% on the day.
First of all, what exactly does ZBRA do?
According to the Yahoo "Profile" on ZBRA, the company
 "...engages in the design, manufacture, and distribution of specialty printing devices that print variable information on demand at the point of issuance. Its printers are used to produce bar code labels, passive RFID smart labels and tags, card laminates, thermal transfer ribbons, receipts, wristbands and tags, plastic cards, and photographs."
And how did they do in the latest quarter?
Early this morning, Zebra Technologies announced 4th quarter 2007 results. For the quarter ended December 31, 2007, net sales came in at $233.6 million, up 11.3% from sales of $209.9 million in the same period the prior year. Net income was $30.8 million or $.45/diluted share, up from $21.4 million or $.30/diluted share last year.
The company beat expectations on both earnings and revenue. Analysts polled by Thomson Financial had predicted earnings of $.43/share on $226 million of revenue. The company also raised guidance on revenue in the 1st quarter of 2008, and confirmed guidance on earnings expectations.
This solid earnings report was enough to push the stock sharply higher today in trading.
What about longer-term results?
Reviewing the Morningstar.com "5-Yr Restated" financials on Zebra, we can see that revenue has continued its uninterrupted growth from $475.6 million in 2002 to $844.6 million in the trailing twelve months (TTM). Earnings have been more erratic with steady growth from $.95/share in 2002 to $1.59/share in 2004. However, earnings dipped to $1.47/share in 2005 and $1.00/share in 2006 and have only now rebounded to $1.45/share in the TTM. Outstanding shares are very stable at 70 million in 2002 and 70 million in the TTM.
Free cash flow is positive and growing with $100 million in 2004, $69 million in 2006 and $137 million in the TTM. The balance sheet is solid with $33 million in cash and $504 million in other current assets. Compared to the $93.3 million in current liabilities, this yields a current ratio over 5! The company has a very small amount of long-term liabilities listed at $12.3 million.
What about some valuation numbers?
Reviewing Yahoo "Key Statistics" on ZBRA, we find that this company is a mid cap stock with a market capitalization of $2.26 billion. The trailing p/e is very reasonable at 22.88. No PEG is reported.
According to the Fidelity.com eresearch website, the company has a Price/Sales (TTM) ratio of 2.39, well above the industry average of 0.82. Also per Fidelity, the Return on Equity (TTM) is below the industry average at 11.00%, with the industry average reported at 16.34%.
Finishing up with Yahoo, there are 68.02 million outstanding shares with 64.70 million that float. As of 12/26/07, there were 2.98 million shares out short representing 4.5 trading days of volume (the 'short ratio'). No dividends are paid and the last stock split was a 3:2 split on August 26, 2004.
What does the chart look like?
Reviewing the 'point & figure' chart on Zebra from StockCharts.com, we can see that this stock has an awful chart! The stock peaked at $62/share back in September, 2004, only to start a stepwise descent down to a recent low of $28 in January, 2008. The stock has been rebounding today, and on a technical basis, would like to see the stock trading above $41 before feeling like the downward trend may have been broken.

Summary: What do I think?
Well, I like this stock. But with a couple of exceptions, the stock is a good pick. First of all, they had a great quarterly report. They beat expectations and raised guidance. I would like to see them do that again the next quarter as well! Longer-term, they have gotten 'off the track' the last couple of years and appear to be turning things around. It may be a bit early to predict whether this 'fix' is working. Valuation-wise, the Price/Sales is a tad rich and the Return on Equity, a tad anemic. Finally, the chart looks pretty awful. But certainly not over-valued.
This is certainly not a typical CANSLIM pick. This is more of a GARP pick with the stock showing much better value in association with a recent strong growth record. It would be nice to see another quarter of solid earnings and revenue growth beating expectations. But like a reverse 'cockroach theory', when you see one good result like this, I do not think it would be surprising to see another in the future!
Thanks again for visiting! If you have any comments or questions, please feel free to leave them on the blog or email me at bobsadviceforstocks@lycos.com. If you get a chance, be sure and visit my Covestor Page to follow my actual holdings, my SocialPicks Page to monitor my many stock picks, and my Podcast Page where you can listen to or download some of my 'radio shows' where I discuss some of the many stocks I have been writing about!
Yours in investing,
Bob
Sunday, 24 February 2008
"Looking Back One Year" A review of stock picks from the week of August 7, 2006

Hello Friends! Thanks so much for stopping by and visiting my blog, Stock Picks Bob's Advice! As always, please remember that I am an amateur investor, so please remember to consult with your professional investment advisers prior to making any investment decisions based on information on this website.
It is the weekend and I wanted to get to a review this evening before I get behind in these reviews another week! As I have pointed out previously, these reviews assume a buy and hold strategy for investing. In actual practice, I employ an 'active portfolio management' approach, seeking to limit losses by selling losing investments quickly and seeking to preserve gains by targeted and partial sales of appreciating stocks. Certainly, the difference in strategy will affect overall performance, but for the ease of evaluation, I have chosen to continue to assume a 'buy and hold' approach for these reviews.
 On August 8, 2006, I posted inVentiv Health (VTIV) on Stock Picks when the stock was trading at $29.88/share. VTIV closed at $31.00 on February 22, 2008 for a gain of $1.12 or 3.7% since posting.
On November 7, 2007, inVentiv announced 3rd quarter 2007 results. For the quarter, total revenues climbed 29% to $254.9 million compared to $197.8 million in the same quarter the prior year. GAAP income from continuing operations increased 38% to $14.1 million from $10.2 million the prior year. Adjusted diluted eps climbed 26% to $.43/share from $.34/share the prior year.
Reviewing the Morningstar.com "5-Yr Restated" financials, we can see that while revenue growth is intact, earnings dipped the latest twelve months to $1.31/share from $1.70/share in 2006. Free cash flow, while also positive, dipped to $32 million in the TTM from $79 million in 2006. The balance sheet remains solid.
Reviewing the 'point & figure' chart on VTIV from StockCharts.com, we can see that the price broke down in November, 2007, when the stock dipped from $42 down to $28/share. The stock is still 'struggling' and does not appear to be respecting the blue 'support line'.
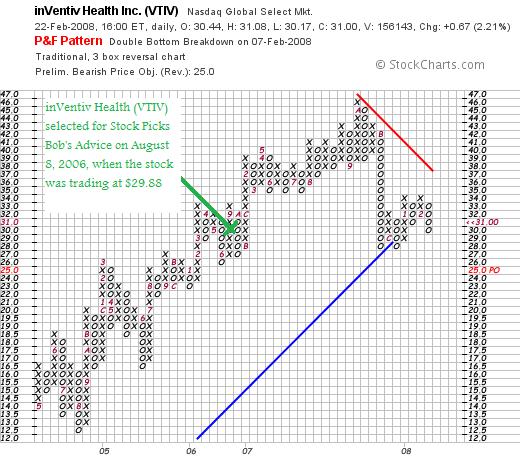
With the satisfactory latest quarter, but with 12 month earnings lagging the prior year and the relatively weak chart,
INVENTIV HEALTH (VTIV) IS RATED A HOLD

On August 12, 2006, I posted Kohl's (KSS) on Stock Picks Bob's Advice when the stock was trading at $60.76/share. KSS closed at $45.05 on February 22, 2008, for a loss of $(15.71)/share or (25.9)%.
On February 7, 2008, Kohl's announced January same-store sales results and reported a decline of (8.3)% from the year-earlier period. Overall sales declined (20.4)% from last year. With the disappointing sales results, the company announced that the quarter's results "to be at the low end of our guidance of $1.30 to $1.34 per diluted share."
On November 15, 2007, Kohl's (KSS) reported 3rd quarter results. For the quarter ended November 3, 2007, earnings came in at $.61/share down from $.68/share last year. Net income was $194.0 million down from $224.5 million. Sales for the quarter did increase to $3.8 billion from $3.7 billion the prior year.
Reviewing the Morningstar.com "5-Yr Restated" financials, we can see that revenue growth remains intact, earnins growth is solid and the total shares are quite stable. Unfortunately, free cash flow which was a solid $1.96 billion in the black for 2007 has turned negative at $(427) million in the trailing twelve months. The balance sheet remains solid.
Looking at the 'point & figure' chart on Kohl's from StockCharts.com, we can see that the stock turned lower in July, 2007, when it broke through support at $70 and has dipped as low as $38 before recently struggling higher to its current level still below the red 'resistance line'.
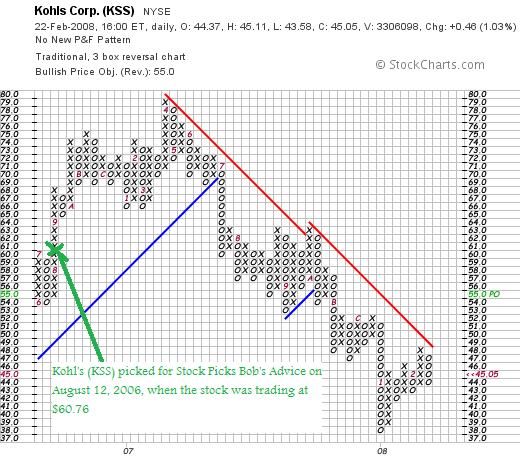
As much as I 'like the store', with the negative same-store-sales results, the recent lowering of guidance from the company, and the very weak price chart,
KOHL'S (KSS) IS RATED A SELL
So how did I do with these two stocks? Really pretty mediocre. inVentiv (VTIV) showed a gain of 3.7% since being 'picked' on the blog and Kohl's (KSS) had a loss of (25.9)% for an average loss of (11.1)% since posting.
Thanks again for stopping by and visiting! If you have any comments or questions, please feel free to leave them on the blog or email me at bobsadviceforstocks@lycos.com. If you get a chance, be sure and visit my Covestor Page where you can see how all of the stocks that I actually own in my trading portfolio are performing, or visit my SocialPicks page where my stock picks from the last year and a half or so are evaluated and monitored.
If you still have some time, be sure and stop by my Podcast Page where you can listen to me discuss some of the many stocks I write up here on the blog! Wishing you all a happy and healthy week ahead!
Yours in Investing!
Bob
Posted by bobsadviceforstocks at 7:52 PM CST
|
Post Comment |
Permalink
Updated: Sunday, 24 February 2008 8:52 PM CST
Saturday, 16 February 2008
Managing A Portfolio in a Rational Fashion
As cross-posted on Trading Goddess
There has been a lot of discussion on this website about how to handle your investments in a difficult trading environment.
Should we identify stocks that are of good value, and then buy more when they decline making their value even more compelling? Should we chase price momentum, buying the hottest solar stock or Chinese 'stock du jour'? Should we set our horizons 10 to 15 years ahead and then 'batten the hatches' as the perfect storm sweeps over us? Or should we just try to time the market and bail when it appears the sky is falling?
As I write about frequently on my blog and occasionally on this website, I believe that we should probably think about our planned strategy for our portfolios before we ever buy any stocks or other investments.
I know that I have spent an awful lot of time thinking about my own responses to the market and what I should be doing in response to the widest range of events.
We can probably all agree that the long-term prospects of the stock market are excellent. We have all heard the statistics of the return for equities being somewhere between 6.5% and 11% long-term. And we all know what missing the 'best days' of the year does to the market timer. So how does the amateur individual investor respond to and plan to manage his or her investments long term?
I try to be able to maintain my investments long-term. And yet, I also want to be prepared for the outlier events. We all need to be capable of dealing with the compelling bull markets as well as the devastating bear disasters a la 1929.
It isn't adequate to say 'I am a long-term investor' and I don't need to pay attention to the impending financial turbulence.
But how do we deal with this? How do we respond to as well as anticipate market action? How do we preserve our capital during market corrections while being able to maximize our exposure to equities during market bull runs?
After many years of investing (I actually purchased my first stock as a 13 year old back in 1967), I have come to believe that a strategy is possible to accomplish this if you are willing to be disciplined and observant of your own stocks and of the market overall.
First of all, try to identify a universe of stocks that you believe are 'investable'. I have my own criteria of consistent revenue growth, earnings growth, free cash flow, stable shares, and a solid balance sheet. But my criteria may not be yours. You might develop a list of stocks that exhibit good value, that exercise responsible stewardship of the earth, or whatever your particular preference might be. It doesn't really matter. But stay consistent.
Next of all, decide what the size of portfolio would be ideal for you. I initially settled on 25 different stocks. Currently I have switched to a 20 position portfolio as a maximum number of stocks I wish to own. It doesn't matter what the size will be. But pick your maximum and stick to it.
Now bear with me as I go through this strategy. It makes sense to me and I think you will understand my thinking as we review this.
Let us assume that our investment posture will vary with our 'exposure' to stocks. That being fully invested is ideal in a strong market (20 positions). And being minimally invested is best in a weak investment environment (5 positions). And I vary my investment exposure based on the market's effects on my own holdings. That is when my own portfolio is acting 'healthy' I am moving from cash towards equities and when my own portfolio is acting 'ill' I shift from equities towards cash.
I do not guess anything. I simply 'listen' to my own holdings.
O.K. you are getting skeptical. Stocks don't 'talk' you are telling me. I have to smile. Of course they don't talk. But their actions speak volumes if you are prepared to observe the behavior of your own stocks.
How do I do that? I can almost hear you guys chuckling over your coffee today.
Here is the strategy. Sell your declining stocks aggressively to preserve your equity and sell your gaining stocks slowly and partially as they appreciate. After each sale at a gain, move up your stop under the advancing stock to work to preserve your gains. And use these sales, either on the upside or downside, as signals to tell you to move into or out of equities.
By this way, you are listening and hearing what your own stocks are telling you about the market.
At the extremes I ignore these signals. When I am at my minimum of 5 positions, I don't 'sit on my hands' on a sale of stock as I do otherwise, but instead look for a new position to keep me at at least 5 stocks. At 20 positions, after a sale at a gain, instead of looking for a new stock to buy, I plan on keeping the proceeds in the account and build cash.
There is no doubt that there are better methods of managing your portfolio.
But doesn't it just make sense to you? Regardless of how you decide to pick the stocks within your portfolio, managing them in some logical method seems to make intuitive sense.
It does to me.
Bob
Tuesday, 12 February 2008
Curtiss-Wright (CW) "Revisiting a Stock Pick"
Hello Friends! Thanks so much for stopping by and visiting my blog, Stock Picks Bob's Advice! As always, please remember that I am an amateur investor, so please remember to consult with your professional investment advisers prior to making any investment decisions based on information on this website.
 Looking through the top % gainers on the NYSE today I came across an old favorite of mine, Curtiss-Wright (CW) that closed at $43.86, up $2.83 or 6.90% on the day. I do not own any shares nor do I have any options on this stock. I say "old favorite" because I first wrote up CW on this blog 3 1/2 years ago, back on June 14, 2004, when the stock was trading at $49.46. Adjusted for a 2:1 stock split on April 24, 2006, my 'pick price' works out to $24.73. With the stock closing at $43.86, this represents a gain of $19.13 or 77.4% since posting.
Let's take another look at this stock and I will show you why
CURTISS-WRIGHT (CW) IS RATED A BUY
First of all,
What exactly does this company do?
 According to the Yahoo "Profile" on Curtiss-Wright, the company
"...engages in the design, manufacture, and overhauling of products for motion control and flow control applications worldwide. It operates through three segments: Flow Control, Motion Control, and Metal Treatment."
How did they do in the latest quarter?
It was the announcement of fourth quarter 2007 results after the close Monday that drove the stock higher on Tuesday (today). Net sales climbed 32% to $497.7 million from $378.2 million in the same quarter last year. Net earnings increased 43% to $38.3 million or $.85/diluted share, up from $26.8 million or $.60/diluted share last year.
Importantly, the company beat expectations according to analysts polled by Thomson Financial for profit of $.76/share. Going forward the company provided earnings guidance below expectations for 2008--expecting profit of $2.55 to $2.65/share, while analysts according to Thomson Financial were expecting earnings of $2.72/share. However, revenue guidance provided by the company of $1.83 to $1.85 billion is somewhat ahead of analysts expectations of $1.83 billion. So the report was a combination of 'good and bad news'.
What about longer-term?
Reviewing the Morningstar.com "5-Yr Restated" financials on CW, we can see the steady progression in revenue, the steady increase in earnings, and also the steady growth in dividends while the outstanding shares remains quite stable.
Free cash flow has been postive and growing and the balance sheet appears solid.
And what about some valuation numbers?
Looking at Yahoo "Key Statistics" on CW, we can see that the market cap is $1.95 billion making it a larger sized mid-cap stock. The trailing p/e is 21.17 with a forward p/e of only 14.01 (fye 31-Dec-08), yielding a PEG of only 0.86.
Utilizing the Fidelity.com eresearch website, we can see that CW has a Price/Sales (TTM) of only 1.14, compared to the industry average of 1.37. At least according to the Return on Equity ratio, the company is not quite as profitable as its peers, with a ROE (TTM) ratio of 12.32%, compared to the industry average of 28.34%.
Finishing up with Yahoo, we find that there are 44.47 million shares outstanding with 44.36 million of them that float. Of these, 3.33 million are out short representing 16.6 days of volume (the short ratio). Well above my own '3 day rule' for short interest significance, we could very well be witnessing a short squeeze with the fairly impressive earnings report.
As noted, the company pays a dividend of $.32/share yielding 0.8%. The last stock split, also noted above, was on April 24, 2006, when the stock split 2:1.
What about the chart?
Taking a look at a 'point & figure' chart on CW from StockCharts.com, we can see that the stock has been a fairly strong performer at least since August, 2001, when the stock was trading at $10. The stock recently bounced off support at $40 to move higher once again. The chart looks very strong in light of the overall market weakness.

Summary: What do I think?
Well I like Curtiss-Wright and would have done well buying shares back in 2004. I still don't own any.
The company reported a great quarterly report. They have been doing well the past five years. The only weak spot was a little bit of weakness expressed in guidance for earnings going forward. Otherwise, this is a very pretty picture.
Thanks so much for visiting! If you have any comments or questions, please feel free to leave them on the blog or email me at bobsadviceforstocks@lycos.com.
If you get a chance, be sure and visit my Covestor Page where my actual trading account is reviewed, my SocialPicks page where my recent stock picks are reviewed, and my Podcast page where I have posted some shows on my stocks discussed over the past few years.
Bob
Sunday, 10 February 2008
"Looking Back One Year" A review of stock picks from the week of July 31, 2006
Hello Friends! Thanks so much for stopping by and visiting my blog, Stock Picks Bob's Advice! As always, please remember that I am an amateur investor, so please remember to consult with your professional investment advisers prior to making any investment decisions based on information on this website.
I would like to apologize for missing the review last weekend. Family business took me out of town, and a review wasn't in the cards. So we are another week behind on these things. Instead of looking back one year, we shall soon need to talk about looking back two years instead!
Anyhow, these reviews are an important part of my blogging on this website. It really isn't enough just to pick a stock without reviewing what happened at some future date with that stock pick. Some of them do well; others decline in value. It is my goal to continue to refine my 'picking' ability as well as my understanding about investing by examining and re-examining the stock picks and the criteria employed here to select them.
These reviews assume a "buy and hold" approach to investing. I use this assumption for these reviews simply because it is the easiest way to evaluate performance. In reality, I advocate and employ a disciplined investment approach that requires me to sell my losing stocks quickly and completely and sell my gaining stocks slowly and partially.
I found a good comment about Dan Sullivan, the founder of The Chartist, a well-regarded investment letter, who advocates an investment philosophy that isn't far from my own:
"For both his stock market and fund services, Dan is cognizant that the greatest value of his approach is its strict adherence to a time-test and proven discipline. He notes, “We do not make predictions or pretend to have a crystal ball. Instead, we let the market be our guide. When we buy, we rely on the price action of the market to let us know if we are right or wrong. If we are wrong, we simply get out of the market and wait for a more a more opportune time.”
Dan continues, “The reason that thousands of intelligent people have had poor results in the market can be directly attributed to their ability to deploy a patient, disciplined strategy in which losses are cut short before they come unmanageable. Conversely, when they have a winning stock they are too quick to sell. We do it just the opposite in that we are quick to sell off our losers and we part with our winners very slowly. It only takes one stock with gains of 300% to more than make up for a host of small losses.”
Certainly, this insistence on limiting losses to small levels and taking small gains at appreciation targets affects the overall performance of any investment and would of course affect even the results of this review.
In any case, let's take a look at the stocks 'picked' on this blog a year or so ago. Two weeks ago I reviewed the stock picks from the week of July 24, 2006. Let's go ahead a week and look at the week of July 31, 2006.
 On August 3, 2006, I picked Christopher & Banks (CBK) for Stock Picks Bob's Advice when the stock was trading at $29.44. CBK closed at $10.90 on February 8, 2008, for a loss of $(18.54) or (62.9)% since posting.
On December 27, 2007, CBK reported 3rd quarter 2008 results. Sales for the quarter increased to $160.0 million from $139.3 million the prior year. Same stores for the quarter increased 9% over the same quarter in the prior year. Net income for the quarter increased to $10.2 million or $.29/diluted share from $9.2 million or $.24/share the prior year.
As good as this earnings report was, the company lowered guidance for the upcoming quarter and year in the same report:
"The Company currently anticipates fourth quarter earnings per diluted share to be in the range of $0.02 to $0.05. The Company’s updated guidance reflects the expectation for flat to a low single digit decline in same-store sales in the fourth quarter. This compares to fourth quarter of fiscal 2007 earnings per diluted share of $0.05. For the year, the Company estimates earnings per diluted share to be in the range of $0.72 to $0.75, compared to $0.89 per share last year.
In addition, the Company announced that, based on sales to date and its projections for the balance of the month, fiscal December same-store sales are anticipated to decline 1 to 2%."
More recently, the company cut guidance further to suggest an upcoming loss in the 4th quarter:
"Christopher & Banks said it expects to post a loss of 5 cents to 7 cents per share, compared with its previous prediction of a profit of 2 cents to 5 cents per share.
Analysts polled by Thomson Financial expected a profit of 3 cents per share for the quarter ending in February.
The retailer also said it posted a greater January same-store sales decrease than Wall Street expected."
These lowered guidance announcements, poor same-store-sales results, and continued guidance reduction has resulted in a very weak stock price performance. As seen by this 'point & figure' chart from StockCharts.com:
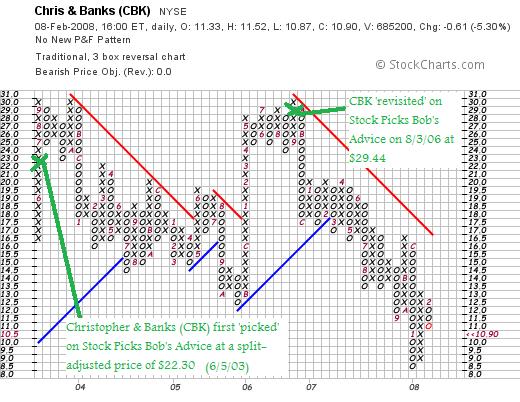
Reviewing the Morningstar.com "5-Yr Restated" financials, we can see that most everything is intact, except for the dip in earnings.
However, with the week earnings guidance, the declining same-store sales, and the anticipated quarterly loss,
CHRISTOPHER & BANKS (CBK) IS RATED A SELL

On August 4, 2006, I posted Anaren (ANEN) on Stock Picks Bob's Advice when the stock was trading at $19.22.
ANEN closed at $13.73 on February 8, 2008, for a loss of $(5.49) or (28.6)% since posting.
On January 29, 2008, Anaren reported 2nd quarter 2008 results. Revenue came in at $32.4 million, up 6.7% from last year's results. Net income, however, came in at $2.6 million or $.17/diluted share, down from $3.8 million or $.21/diluted share reported last year.
Except for the dip in earnings the latest twelve months, the Morningstar.com "5-Yr Restated" financials page is intact.
Taking a look at the 'point & figure' chart from StockCharts.com, we can see that the stock 'rolled over' way back in December, 2006, when the stock dipped below $19.00. Since that time, the stock has been fighting against resistance and has traded steadily lower.
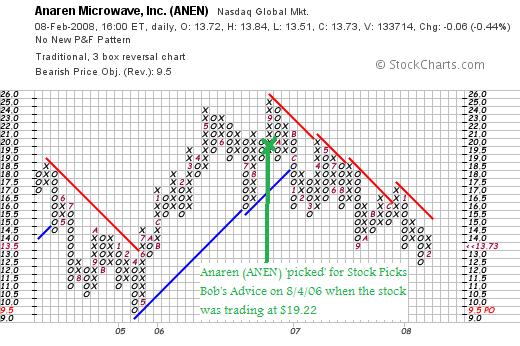
With the relatively weak quarterly report, the very weak-appearing stock chart, even with the relatively strong Morningstar report,
ANAREN (ANEN) IS RATED A SELL
So how did I do with these two picks from 2006? In a word, lousy. Christopher & Banks (CBK) dropped (62.9)% since posting and Anaren (ANEN) declined (28.6)% since being listed here. (You can clearly see the utility of employing stop losses to avoid large losses like this if these two stocks were actuallly purchased and just blindly held! The average loss for these two was a loss of (45.75)%.
Thanks again for visiting! These results once again show that there is nothing 'magical' about what I write and that you all need to exercise tremendous discipline in limiting losses and preserving gains.
If you have any comments or questions, please feel free to leave them on the blog or email me at bobsadviceforstocks@lycos.com.
If you get a chance, be sure and drop by my Covestor Site where my Trading Portfolio is monitored and reviewed, my SocialPicks page where many of my recent stock picks are evaluated, and my Podcast Page where you can listen to me discuss some of the many stocks I write about on the blog.
Consider participating on Prosper.com where I have been exploring the possibility of person-to-person online lending! Be sure and read all of the fine print and understand the risks of loss associated with this type of lending.
Wishing all of you a happy and healthy and financially successful week!
Bob
My Prosper.com Account Update
 Hello Friends! Thanks so much for stopping by and visiting my blog, Stock Picks Bob's Advice! As always, please remember that I am an amateur investor, so please remember to consult with your professional investment advisers prior to making any investment decisions based on information on this website.
I have a lot of great nephews and nieces and cousins and aunts and uncles in my family! I try to learn a lot from them. And share with them my thoughts on stocks and investments as well.
As I wrote elsewhere, my nephew Ryan introduced me to the Prosper.com website. As a sort of diversification of my assets, I have been dabbling in this 'person-to-person' loan site where unsecured loans up to $25,000 are offered to prospective lenders. Certainly, in these difficult economic times, there are very significant risks associated with participating in these loans which can include the total loss of the funds lent out. However, with returns on savings accounts in the low single-digit range, opportunities to invest funds in higher-interest-rate paying ventures may be worth the risk which should be well-understood before participating.
Before I write up my own review of my own activity, I would like to share with you what I have found about Prosper.com:
 As reported in a great article on Prosper:
"Prosper's users lend money to and borrow money from other people on the site at what the company says are better interest rates than those available through traditional financial institutions and without some of the risk that comes from typical person-to-person loans.
"We looked at eBay and said, 'Why can't we do this for money?' " said Chris Larsen, Prosper's chief executive.
Mr. Larsen, who founded and led E-Loan, an online lender that was bought last year for $300 million by Popular Inc., says Prosper could save borrowers and lenders money because it was a leaner operation than traditional financial institutions. He noted that consumers make, at most, about 4 percent on their savings accounts, which banks then lend to credit card customers at 14 percent or more.
"That's just a huge spread," Mr. Larsen said. "We think if you allow people to participate directly, it's a more efficient marketplace. People can make a better return on their deposits, which then become the source of credit to others."
On Prosper.com, prospective borrowers register with the site and allow the company to review their credit history. Then borrowers post a loan request of up to $25,000, along with an upper limit for the amount of interest they are willing to pay. Loans are not secured by collateral and are paid off over three years at a fixed rate, with no prepayment penalty.
Lenders essentially deposit their money with Prosper — which holds it in an interest-bearing account with Wells Fargo— and either review the loan requests individually or fill out a form permitting Prosper to allocate money to borrowers who meet certain criteria.
Chief among those criteria is the borrower's rating from the credit reporting bureau Experian, but borrowers can also join or create groups with defined interests or characteristics that, they hope, will make them more attractive to some lenders."
In a more recent article on Prosper, the risks and pointers on lending on this site were emphasized:
"While borrowers need to present themselves in the best light, lenders' priority is caution.
WEIGH THE RISKS. Interest rates on a peer-to-peer loan vary depending on the borrower's credit but they can go well above 20 percent. The more risky the borrower the higher the interest rate you can charge.
But you also accept a greater chance of never seeing your money again. The average default rate at Prosper, for example, is 4.7 percent overall. But, adds Chris Larsen, the firm's chief executive, "that varies greatly with credit grade."
DIVERSIFY YOUR INVESTMENT. Minimize the risk to yourself by divvying up your cash among several borrowers, not just one. At the Lending Club your money must be split up among a minimum of 25 borrowers.
CALCULATE FEES. In addition to studying a borrower's risk and diversifying your investment you need to consider fees. In general, providers deduct up to 1 percent from the monthly payment you receive.
If all of this sounds familiar, it should: Lending money to your peers requires just as much consideration as buying stocks and bonds.
"Many lenders have altruistic motives. They want to help someone get out of a payday loan cycle or start a business," Bruene said. "But if someone walks away from your loan it suddenly doesn't feel so good.""
I cannot emphasize the need to understand the risks involved in such lending. Indeed, the risks are really still undetermined as Prosper.com has been operating for less than three years. Just passing its second birthday, Prosper.com opened to the public on February 5, 2006.
Currently, I am depositing $50 to my Prosper.com account twice/month. In addition, I have added other $50 deposits to the account to bring it up to its current status. This is the current status of my Prosper.com account as of February 10, 2008.
Statistics:
Cash balance: $7.05
Value of Loans: $2,323.55
Payments in transit: $20.24
Winning Bids: $102.47
Winning Bids Pending Review: $65.00
Total Account Value: $2,518.31
Active Loan Summary:
Active Loans: 44
Current: 43
Late: 1 (more than 15 days, less than 30 days).
Principal loaned: $2,413.00
Payments received: $160.74
Value of loans: $2,323.55
Average Interest Rate: 15.86%
Daily Interest Accrual: $1.00
Lending Performance:
Net income (interest + fees) $49.20
Net defaults $0.00
Net gain/loss: $49.20
My first loan was written on 9/20/07 for $50.00. As my loan portfolio has grown, I have increased the size of my loans to $65.00. I have chosen to utilize Prosper.com "portfolio plans" to assist me in picking loans to lend. Currently, I have chosen to bias my loans to higher-rated borrowers. I have set up my maximum at $6,000 for "conservative" loans, $2,000 for "balanced" loans, $1,000 for "moderate" loans, and $340 for "aggressive loans. This way, the loans are automatically bid on eBay style, without me perusing each of the loan descriptions. However, manually going through these loans before bidding is certainly an option.
Anyhow, that's the update. I have planned on updating my Prosper.com plans and results here on this blog. I am not sure whether this lending effort will even be profitable. Especially with the economy showing weakness, I am very concerned about the risks involved. So be careful!
If you do sign up on Prosper.com with these links, you should receive $25.00 as an incentive to write your first loan and I shall also receive $25.00 as a referral fee. Full disclosure: thus far about half a dozen people have signed up on Prosper.com through my website, and I have earned a total of $25 in referral fees.
Thanks again for visiting! If you get a chance, be sure and visit my Covestor Page where my actual Trading Portfolio is reviewed and analyzed, my SociaPicks Page where my most recent stock picks are monitored, and my Podcast Page where you can listen to me do a radio show on some of the many stocks I write about here on the blog!
Have a great week trading everyone!
Bob
Posted by bobsadviceforstocks at 2:47 PM CST
|
Post Comment |
Permalink
Updated: Sunday, 10 February 2008 2:50 PM CST
Friday, 8 February 2008
Gardner Denver (GDI) "Revisiting a Stock Pick"
Hello Friends! Thanks so much for stopping by and visiting my blog, Stock Picks Bob's Advice! As always, please remember that I am an amateur investor, so please remember to consult with your professional investment advisers prior to making any investment decisions based on information on this website.
 I have been writing a lot about different trades and the like that I have personally been implementing. As a nice change, I wanted to write today about a stock that made the list of top % gainers, a stock that I have written up previously, and still fits my 'criteria' for inclusion on this blog.
 Gardner Denver closed today at $35.20, up $2.83 or 8.74% on the day. I do not own any shares nor do I have any options on this stock. This stock is an 'old favorite' of mine, which I first wrote up on Stock Picks Bob's Advice on February 7, 2006, when the stock was trading at $58.68/share. Adjusting for a 2:1 stock split, the stock was picked at a price of $29.34. Thus the stock has appreciated $5.86 or 20.0% since posting.
Briefly, GDI reported a strong 4th quarter 2007 report yesterday after the close of trading. Revenues climbed 16%, net income was up 71% and diluted earnings per share were ahead by 69% from the year earlier fourth quarter. Just as importantly, the company beat expectations on both earnings and revenue results, and then went ahead and raised guidance for 2008. These are the kind of results I look for, and clearly, there were other investors interested in these numbers which drove the stock higher today.
The Morningstar.com "5-Yr Restated" financials are solid. The company has increased the total shares from 32 million to 53 million from 2002 to 2006 but during the same period, revenue was up over 200% and earnings climbed over 200% as well. The rest of the report looks great.
Certainly the 'point & figure' chart on GDI from StockCharts.com shows the effects of the difficult stock trading environment with the stock price pulling back from its recent move higher. Just 'eye-balling' the chart, it appears that GDI would need to trade north of $41 before convincingly breaking out from the appearance that the chart has 'rolled over' after peaking at $46 in July, 2007.
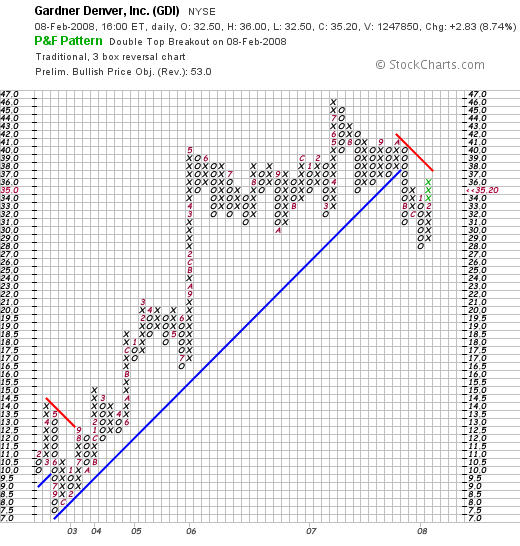
This is a very interesting stock with great prospects and cheap valuation. Valuation-wise, per Yahoo "Key Statistics", the company sports a p/e of 10.63 and a PEG of only 0.44. Thus,
GARDNER DENVER (GDI) IS RATED A BUY
Thanks so much for stopping by and visiting my blog! If you have any comments or questions, please feel free to leave them on the website or email me at bobsadviceforstocks@lycos.com. If you get a chance, be sure and visit my Covestor website where all of my actual holdings are reviewed, my SocialPicks website where my recent stock picks are monitored, and my Podcast Page where you can download programs in which I discuss many of the same stocks I write about here on this blog.
Regards to all of my friends! Wishing you a great weekend!
Bob
Wednesday, 6 February 2008
Interactive Intelligence (ININ) "Trading Transparency"
Hello Friends! Thanks so much for stopping by and visiting my blog, Stock Picks Bob's Advice! As always, please remember that I am an amateur investor, so please remember to consult with your professional investment advisers prior to making any investment decisions based on information on this website.
Earlier today I sold my remaining 350 shares of ININ at $15.80. These shares were the remaining shares of one of my 'trades' and thus, my 'trading rules' for this position meant that they were to be sold at break-even if the stock price should decline to that level. As per my previous comments, I am not sure that I shall continue to do any of these trades at all, but this has been my strategy for these purchases of stock.
My shares of ININ were purchased 1/31/08 at a cost basis of $15.76/share. Thus at $15.80, the stock had come down to break-even, and I chose to sell my remaining shares. Interactive Intelligence closed today at $15.51, down $(.72) or (4.44)% on the day. Thus the sale at $15.80 worked out to be a reasonable move imho.
With this sale, my account is now down to 7 positions, above my minimum of 5 and well below my maximum of 20. Furthermore, my margin balance has been eliminated and I actually have a small credit balance in my account.
Some additional thoughts on Interactive Intelligence (ININ):
On January 30, 2008, they reported strong 4th quarter 2007 results. The Morningstar.com "5-Yr Restated" financials are intact. However, the technicals are weak. As the "point & figure" chart from StockCharts.com shows, the company broke down this January after it broke through support at the $22 level.
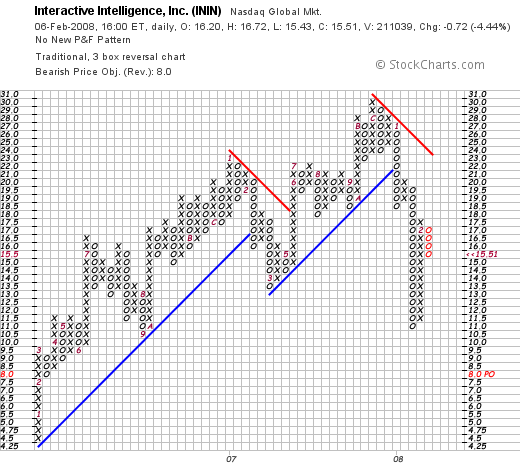
With the strong earnings report, the solid Morningstar.com evaluation, but the weak price chart, as well as my own sale of shares, the best I could do is
INTERACTIVE INTELLIGENCE (ININ) IS RATED A HOLD
Thanks so much for stopping by and visiting! If you have any comments or questions, please feel free to leave them right on the website, or email me at bobsadviceforstocks@lycos.com.
If you get a chance, be sure and visit my Covestor Page where my actual Trading Portfolio is evaluated, my SocialPicks Page where all of my recent stock picks are summarized, and my Podcast Page, where you can listen to me discuss some of the many stocks I have writeen up here on the blog.
Have a great rest-of-the-week!
Bob
Tuesday, 5 February 2008
Synchronoss Technologies (SNCR) "Trading Transparency"
Hello Friends! Thanks so much for stopping by and visiting my blog, Stock Picks Bob's Advice! As always, please remember that I am an amateur investor, so please remember to consult with your professional investment advisers prior to making any investment decisions based on information on this website.
I was traveling today and didn't realize what an awful market it was. I am sure that many of you took losses. I know that I did. And it really makes me want to consider my effort at "trading" beyond my investment strategy. In many ways it undermines my efforts at 'listening' to my portfolio. My stocks are talking to me loud and clear. And yet I try to deny their message. I did so again Monday.
I purchased 1200 shares of SNCR at $24.99 yesterday morning. And almost immediately the stock turned lower and I sold 600 shares at $24.20, 600 shares at $24.69. I was smart enough to sell my shares but I wasn't smart enough to avoid buying any.
What to do about 'trading'. I suspect it really doesn't fit at all into my strategy. Perhaps when I get a signal to buy something, it would be ok to buy an 'oversized' position and sell off a greater portion initially. Perhaps. But I am not sure about that.
I do know that my excuse for adding positions like Silicom and Interactive Intelligence--both great stocks which also got slammed today, probably shouldn't be in my portfolio. I shouldn't have a back-door entry to my portfolio via trades. I have to make up my mind whether I am an investor or trader.
I shall work on my discipline. That is why I blog. So that I can share with you the struggles that this amateur goes through each trading day. Struggles that I am sure you work with as well. Trading rules give us the structure to maintain that discipline. But will-power is also required to follow through with these plans.
Wish me luck.
Bob
Newer | Latest | Older


