Stock Picks Bob's Advice
Saturday, 17 May 2008
Happy Birthday to Me! Guess Who's 5?
Hello Friends! Thanks so much for stopping by and visiting my blog, Stock Picks Bob's Advice! As always, please remember that I am an amateur investor, so please remember to consult with your professional investment advisers prior to making any investment decisions based on information on this website.
 It is hard to believe that I am now five years old here on this blog. In fact, I wanted to share this button with you!
On May 12, 2003, I wrote this entry:
"May 12, 2003
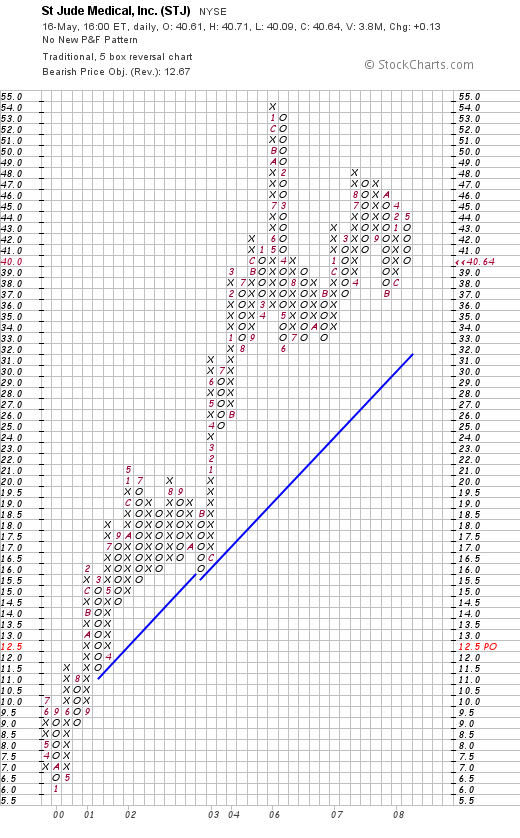
St Jude Medical
This is one I picked up today. STJ is the stock symbol. I do not as I write and publish this own any shares. Am thinking about suggesting this to my stock club. Company had a great day today with a nice move on the upside. Last Quarter was good and the past five years have been steady growth. Closed at $55.30 up $2.92. So the daily momentum helped it make the list.
Posted by bobsadviceforstocks at 6:01 PM CDT"
And the rest as they say is history.
By the way, St Jude closed 5/16/08 at $40.64. Adjusted for a 2:1 stock split November 23, 2004, my pick price was $55.30/2 = $27.65, thus this stock pick had a gain of $12.99 or 47.0% since posting.
So how do I still think about this stock? Well, let's check a few of the usual things I like to examine...but let's do this briefly :).
On April 18, 2008, STJ reported a solid 1st quarter 2008 report. They beat expectations and raised guidance. Perfect! Their 5-Yr Restated Financials on Morningstar are still gorgeous.
Finally, even the 'point & figure' chart from StockCharts.com looks solid when we take a long-term view that goes back to before 2003.
And NO, I don't own any shares or options on this stock. But it is still a great holding for this blog don't you think?
Thus,
ST JUDE (STJ) IS RATED A BUY
So now with 1,813 entries (!), and passing 200,000 visitors total, my blog is starting to show its age maybe just a little :). This is still a 'one-man' amateur operation and I get only 157 visitors daily...but thanks to all of you who make the trek and visit. You all are welcome to a piece of the birthday cake and maybe a party favor or two.

If you have any comments or questions, please feel free to leave them on the blog or email me at bobsadviceforstocks@lycos.com.
Here's to another five years of blogging!
Yours in investing,
Bob
Wednesday, 14 May 2008
Chase (CCF) "Revisiting a Stock Pick"
Hello Friends! Thanks so much for stopping by and visiting my blog, Stock Picks Bob's Advice! As always, please remember that I am an amateur investor, so please remember to consult with your professional investment advisers prior to making any investment decisions based on information on this website.
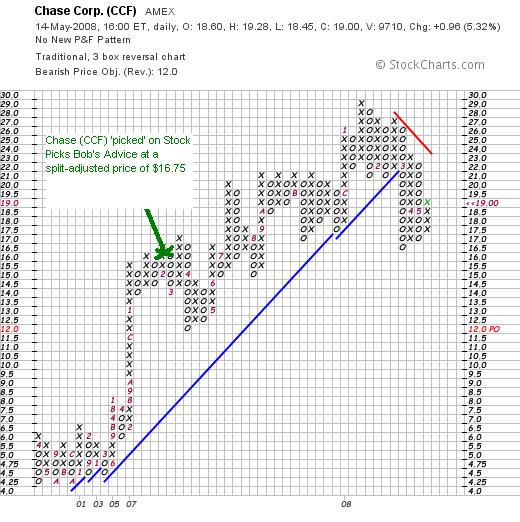
 Looking through the list of top % gainers on the AMEX this afternoon, I saw that Chase (CCF) had just made the list, closing at $19.00, up $.96 or 5.32% on the day. I do not own any shares or options on this stock but my Stock Club does own some shares.
This entry is called a "revisit" because I have reviewed Chase previously. On February 6, 2007, I examined this stock and found it worth of inclusion on this blog. At that time the stock was trading at a split-adjusted price of $33.49/2 = $16.75. With the $19 close, this represents a gain of $2.25 or 13.4% since posting.
I still like this stock and thus,
CHASE CORPORATION (CCF) IS RATED A BUY
I would like to briefly review some of the facts surrounding this company that have led me to this assessment and re-emphasize the philosophy behind my thinking.
According to the Yahoo "Profile" on Chase (CCF), the company
"...engages in the manufacture of specialty tapes, laminates, sealants, and coatings, as well as in the provision of electronic manufacturing services worldwide. It operates through two segments, Specialized Manufacturing and Electronic Manufacturing Services."
Chase, on April 8, 2008, announced 2nd quarter 2008 results. For the quarter ended February 29, 2008, revenues came in at $28.2 million a 3% increase from the $27.5 million reported in the year earlier same period. Net income worked out to $1.87 million, up 36% from the $1.37 million reported last year or $.22/share, up from $.16/share the prior year.
While I might prefer to see a stronger revenue increase, for me I am satisfied that revenue did grow and that earnings were able to increase even more. One of the cornerstones of my investment 'picks' and my general philosophy is that the consistent results of a growing company producing ever-improved financial results will result in a stock that also consistently appreciates in price over time.
But one quarter of good results is not enough to sell me on a stock. It is the consistent reporting of results--which for me I can identify utilizing Morningstar.com. Indeed, if we check the Morningstar.com "5-Yr Restated" financials, we can see several things that I like about the company. First of all the steady increase in revenue (although the company is certainly quite small), from $74.6 million in 2003 to $127.5 million in 2007 and $132 million in the trailing twelve months (TTM).
Earnings, after a dip from $.63/share in 2003 to $.58/share in 2004, have steadily increased to $1.22 million in 2007 and $1.37/share in the TTM.
Another interesting observation is that this small company even pays a dividend---and not only that has been fairly regularly increasing that pay-out from $.14/share in 2003 to $.20/share in 2007 and $.25/share in the TTM. I do not require dividends to 'endorse' a stock--but it certainly is an added 'plus' for me! To also have a company that regularly increases its dividend is a corporate action that suggests a certain confidence in the company's prospects and financial strength.
If we examine the outstanding shares, we can also see that Chase (CCF) has been quite conservative with issuing shares. In fact, 8 million shares are reported in 2003 and four years later, the company still reports only 8 million shares. In contrast, you can view the Morningstar.com "5-Yr Financials" on Sirius, not a favorite of mine, that has increased its shares from 827 million in 2003 to 1.47 billion in the trailing twelve months. I do not know if CCF will be a better investment that SIRI tomorrow, next week, or next year. I am just using this example to explain my attempt to identify what I call a 'quality' investment, that for me includes a certain reluctance on the part of management to issue an excessive amount of new shares.
Insofar as 'free cash flow' is concerned, I want to see creation of 'free cash' instead of a cash burn rate that was so common during the dot com bubble. For Chase, they generated $3 million in cash flow in 2005, increased it to $9 million in 2006, $11 million in 2007 and $12 million in the TTM. Perfect.
And the balance sheet. Again, I am not a genius, but at least on these tables I want to see more assets than liabilities. Sort of like having more cash in the bank than bills to pay :). Don't we all want that sort of balance sheet?
In Chase's case, they are reported by Morningstar to have $1 million in cash and $37 million in other current assets. This total of $38 million in current assets (things that can be easily converted into cash within the next 12 months), easily covers both the $16.1 million in current liabilities (with a current ratio of 2.375---a healthy ratio from my perspective) and the $10.9 million in long-term liabilities combined.
In terms of valuation, I am also always looking for a 'good deal'! That doesn't mean I am a value investor, but that value plays an important part in any investment decision. In fact, I would describe my own philosophy as eclectic, that is utilizing all of the information I can find to make that decision.
An easy place to find valuation numbers on stocks is right at Yahoo Finance. If we review the "Key Statistics" on Chase (CCF) from Yahoo, we can see that first of all this is a very small capitalization stock with a market cap of $157.95 million. The most common ratio used by value investors is traditionally the p/e ratio. In this particular case, Chase is what I would call 'dirt cheap' with a p/e of 13.92. The forward p/e (based on estimated earnings for the fye 31-Aug-09) is even better at 11.88. Since there aren't any analysts willing to estimate 5-yr results, we don't have a PEG with is the ratio comparing the p/e to the 5-yr growth rate anticipated.
I have been looking at a few other 'value' numbers, including the Price/Sales ratio. Back in 2005 Paul Sturm, from Smart Money wrote a great article on the utility of the Price/Sales ratio in comparing one company to another. A great article, I refer to it often on this blog.
Like so many other numbers, this one is relatively useless in isolation. That is, the value of this ratio is in its relation to other companies in the same industry. That is the relative valuation of a stock can be evaluated by comparing 'apples to apples'. Thus, checking the Fidelity.com eresearch website, we can see that Chase (CCF) has a Price/Sales ratio (TTM) of 1.13, compared to the industry average value of 7.49.
In terms of profitability, examining the Return on Equity (TTM), we find that Chase comes up a bit 'light' with a ROE (TTM) of 20.84% compared to the industry average of 31.29%. So in this particular number, we find a little less of an impressive result.
Returning to Yahoo, there are 8.31 million shares outstanding (a small company!) with 5.96 million that float. That being said, there is a significant number of shares out short, which for me means a current ratio greater than 3 days. Yahoo reports 75,080 shares out short as of 4/25/08, representing 4.5 trading days of volume.
Regarding the dividend, the company pays a forward annual dividend of $.25/share yielding 1.3%. The last stock split was a 2:1 split back on June 28, 2007.
Insofar as a chart, I am not much of a technical analyst. I don't talk much about moving averages. But with point and figure charting, I do take a look at 'support' and 'resistance' lines.
If we review the 'point & figure' chart on Chase (CCF) from StockCharts.com, we can see that the stock has indeed shown some weakness dipping from $29 in January, 2008, to a low of $16.50 in March, 2008. Since that time it has been 'fighting-back' so-to-speak, but frankly, I would like to see this stock get above $24 before starting to call the 'all clear'.
In summary, I still like Chase (CCF). I am not prepared to buy any shares but shall keep it on my own 'watch list' which isn't really a list at all, but the accumulated names of stocks I write about here on this blog :).
I hope that my rambling once again helped explain what I believe makes a good stock good and what might be helpful to look for. Of course, this is only my 'amateur' perspective, but I think it all makes sense. At least to me!
If you have any comments or questions, please feel free to leave them on the blog or email me at bobsadviceforstocks@lycos.com. If you get a chance, be sure and visit my Covestor Page, where my actual trading portfolio is monitored. Also stop by and check out my SocialPicks Page where all of my stock picks are followed. And if you still have some time :), be sure and visit my Podcast Page where you can download some mp3's for your enjoyment on some of the many stocks I write about here on the web.
Have a great Thursday everyone!
Yours in investing,
Bob
Sunday, 11 May 2008
"Trading Portfolio Update" May 11, 2008
Hello Friends! Thanks so much for stopping by and visiting my blog, Stock Picks Bob's Advice! As always, please remember that I am an amateur investor, so please remember to consult with your professional investment advisers prior to making any investment decisions based on information on this website!

I wanted to share with all of you this beautiful photograph from In The Headlights called "Water Colors". As Riannan writes, the photo "..put me in a calm state immediately. There is a Zen beauty and serenity to them that I find very pleasing."
But what does this have to do with my portfolio?---I can almost hear all of you asking that question. My point is that my activity since my last Portfolio Update on April 6, 2008 has been nil. It is not that there haven't been opportunities for selling or trading. It is just like the comments about patience from Nonin Chowaney at the Nebraska Zen Center, who quotes from Lao Tzu:
"Do you have the patience to wait
till your mud settles and the water is clear?
Can you remain unmoving
till the right action arises by itself?
The Master doesn't seek fulfillment,
but not seeking, not expecting,
is present, and can welcome all things."
I am far from any kind of expert at things Zen, but the idea of waiting patiently for the right time to act seems apropos to me.
In other words, my actions in the market are directed by my own holdings. My sales generally have been made when prices dictate a sale, and my purchases are directed by other portfolio-initiated 'signals'. And sitting calmly, avoiding the temptation of 'trades' and activity, my portfolio is working well to direct me to action or not.
Since I have been associated with the Covestor website, you can now visit my Covestor page and monitor my performance at least since I joined Covestor (June 12, 2007). However, this website, while now including my blog entries on my Covestor Blog, does not monitor the performance of many of my purchases preceding my participation in Covestor. Thus the utility of these reviews.
As a change on this review, I would like to post some charts of each of my six holdings and show the points at which I plan on selling shares, which for me includes plans for both sales on the upside as well as downside sales.
The holdings are listed in alphabetic order of their symbols, followed by the number of shares, date of purchase, price of purchase (cost basis), latest price (5/9/08), and percentage unrealized gain or (unrealized loss).
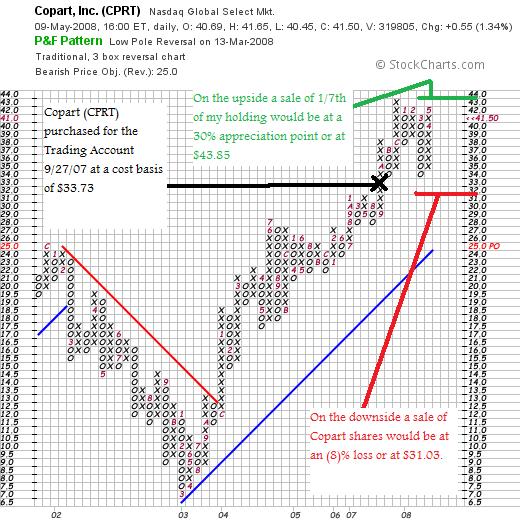
Copart (CPRT), 210 shares, 9/27/07, $33.73, $41.50, 23.04%
I have not had any sales of Copart on the upside or downside, and thus, my downside sale would be an (8)% loss or .92 x $33.73 = $31.03, or on the upside, I plan on selling 1/7th of my holding (30 shares) should the stock reach a 30% appreciation point (my first target for a sale). This would work out to 1.3 x $33.73 = $43.85.
Thus, the 'point & figure' chart on Copart from StockCharts.com:
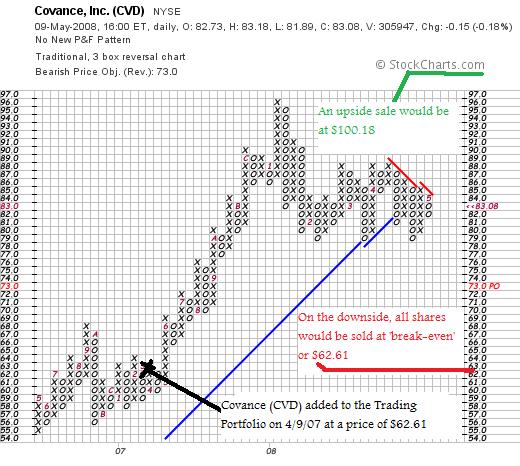
Covance (CVD, 102 shares, 4/9/07, $62.61, $83.08, 32.69%.
I have sold shares of Covance once on 10/25/07, thus, on the downside my sale point is moved up to 'break-even' or $62.61. On the upside, my next partial sale would be at a 60% appreciation target, which works out to 1.6 x $62.61 = $100.18. At that point, I would plan on selling 1/7th of my remaining shares or 102/7= 14 shares. Of course, on the downside, my plan is to sell all shares should the stock decline to that level.
Let's take a look at the 'point & figure' chart on Covance from StockCharts.com (recall I am just posting the purchase point, the upside sale and the downside sale points on these charts.)
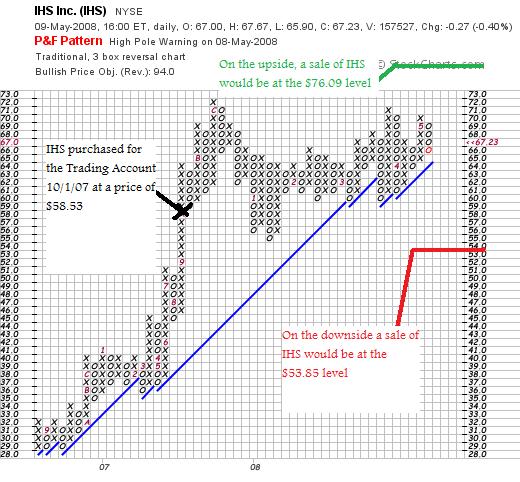
IHS (IHS), 140 shares, 10/1/07, $58.53, $67.23, 14.87%.
I have not sold any shares of IHS so my loss limit would be at 92% of the purchase price or .92 x $58.53 = $53.85. On the upside, my first sale of 1/7th of my holding or 20 shares would be at the 30% appreciation level which works out to 1.3 x $58.53 = $76.09. Thus, the 'point & figure' chart on IHS from StockCharts.com showing these points on the graph:
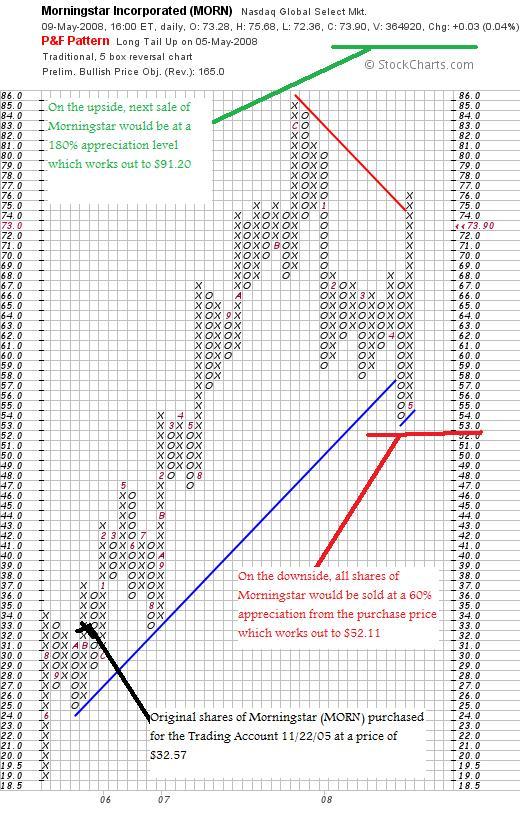
Morningstar (MORN), 103 shares, 11/22/05, $32.57, $73.90, 126.86%
Since purchasing Morningstar shares in 2005, I have sold portions of this holding four times: at 30%, 60%, 90%, and 120% levels. On the upside, my next sale of 1/7th of my holding or 103/7= 14 shares, would be at a 180% appreciation level or 2.80 x $32.57 = $91.20. On the downside, at 1/2 of the highest appreciation sale point or at 120%/2 = 60% appreciation level, all of my shares would be sold. This works out to 1.6 x $32.57 = $52.11. If we look at the 'point & figure' chart on Morningstar from StockCharts.com, we can see these points graphed:
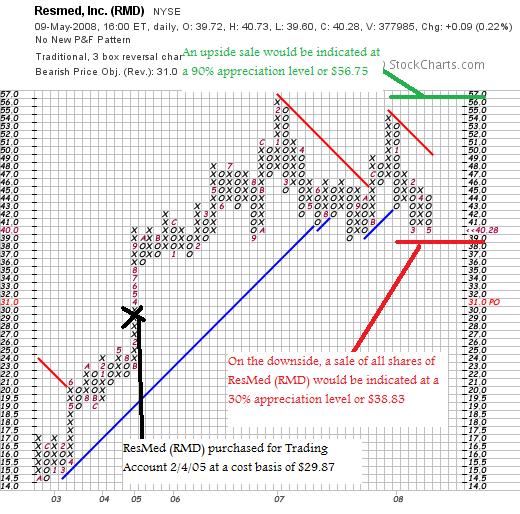
ResMed (RMD) 150 shares, 2/4/05, $29.87, $40.28, 34.86%.
I have sold portions of ResMed twice, at 30% and 60% appreciation levels. Thus, on the downside all shares of ResMed should be sold at 1/2 of 60% or back to the 30% appreciation level. This works out to a sale at 1.3 x $29.87 = $38.83. On the upside, the next sale would be 1/7th of my holding or 150/7 = 21 shares at 1.9 x $29.87 = $56.75. Reviewing the 'point & figure' chart on ResMed from StockCharts.com we can identify these points:
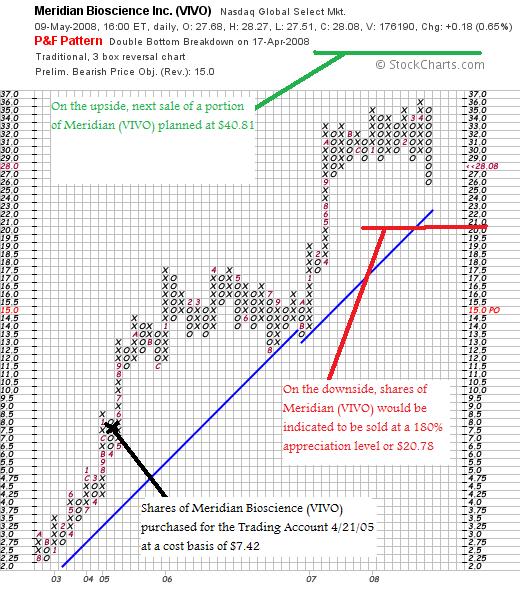
Meridian Bioscience (VIVO), 171 shares, 4/21/05, $7.42, $28.08, 278.49%.
VIVO is my most profitable stock having sold portions 8 times already, at 30, 60, 90, 120, 180, 240, 300, and 360% appreciation levels. Thus, on the upside, my next partial sale would be at a 450% appreciation level (!) which works out to 5.5 x $7.42 = $40.81, at which time I would plan on selling 1/7th of my shares or 171/7 = 24 shares. On the downside, at 1/2 of the highest appreciation sale recorded, this would work out to a 360%/2 or 180% appreciation level. Calculating this, we have 2.80 x $7.42 = $20.78.
Here is the 'point & figure' chart on Meridian (VIVO) from StockCharts.com showing these points:
Thus, I am still at 6 positions. As I have previously noted, my minimum for my portfolio is 5 positions with a maximum of 20.
The current market value of my securities (May 11, 2008) is $45,056.74, with $234.87 in the money market portion of the account.
As of 5/10/08, I had $(4,534.09) in realized net short-term losses, and $3,283.50 in realized net long-term gains, for a net of $(1,250.29) in realized losses in 2008. In 2008 I have paid a total of $(221.13) in margin interest and have total income of $53.82.
My account, as of 5/9/08, has $14,289.41 in unrealized gains.
Thanks again for stopping by! I hope the more detailed view of my positions and my current 'inactivity' is explained. Of course, I shall step up my trading activity as my own portfolio dictates. Meanwhile, I shall be trying to exercise the 'Zen' of trading patience!
If you have any comments or questions, please feel free to leave them on the blog or email me at bobsadviceforstocks@lycos.com.
Yours in investing,
Bob
Saturday, 10 May 2008
"Looking Back One Year" A review of stock picks from the week of October 16, 2006

Hello Friends! Thanks so much for stopping by and visiting my blog, Stock Picks Bob's Advice! As always, please remember that I am an amateur investor, so please remember to consult with your professional investment advisers prior to making any investment decisions based on information on this website.
It is the weekend and I really would like to get this review done. Last weekend one thing led to another and I never got one out for the blog. And now I am another week behind....so not really a look a 'year ago'...more like a year-and-a-half! In any case, let's get down to business and review the picks from the week of October 16, 2006. Two weeks ago, I reviewed the stock picks from the week of October 9, 2006, so let's see how the two selections from the following week turned out!
These reviews assume a buy and hold strategy for investing with equal dollar amounts assumed invested. In reality, I advocate and practice a disciplined portfolio strategy--selling declining stocks quickly and completely and selling appreciating stocks slowly and partially. This difference would of course affect performance and should be taken into consideration when considering these performance evaluations.
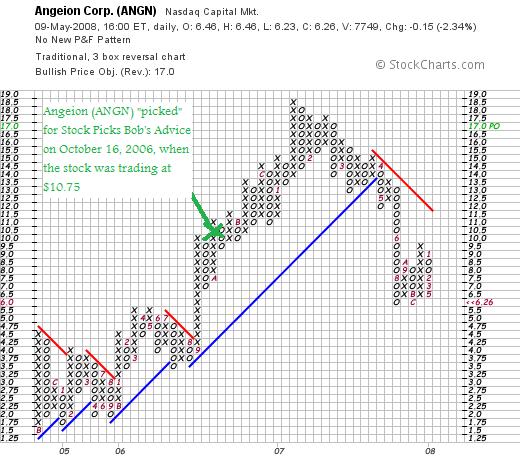
 On October 16, 2006, I posted Angeion (ANGN) on Stock Picks Bob's Advice when the stock was trading at $10.75/share. ANGN closed at $6.26 on May 9, 2008, for a loss of $(4.49) or (41.8)% since posting. I do not own any shares or options in Angeion.
On March 17, 2008, Angeion (ANGN) reported 1st quarter 2008 results. For the quarter ended January 31, 2008, the company reported revenue of $7.5 million and a net loss of $(675,000) or $(.17)/diluted share, compared to revenue of $10.6 million and income of $489,000 or $.12/diluted share last year.
With this poor quarterly pereformance,
ANGEION (ANGN) IS RATED A SELL
Looking at the Morningstar.com "5-Yr Restated" financials on Angeion, we can see that revenue growth peaked at $39 million in 2007 and has come in at $35 million in the trailing twelve months (TTM). Earnings peaked at $.38/share in 2006, dipped to $.24/share in 2007 and is at a loss of $(.05)/share in the TTM.
Free cash flow remains positive at $1 million. And the balance sheet remains solid.
Reviewing the 'point & figure' chart on Angeion from StockCharts.com, we can see that the stock peaked in January, 2007, at $18.50/share only to decline with an acceleration in the drop in April, 2007, when the stock broke through support at the $14.50 level. The stock is currently struggling to find a new level of support at the $6 level and has some 'work' to do to get above resistance and into new positive territory.
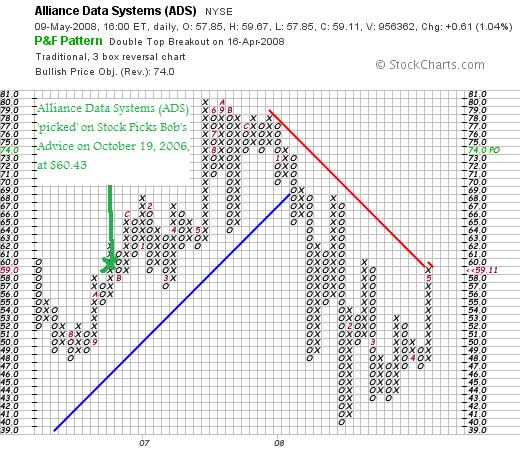
 On October 19, 2006, I posted Alliance Data Systems (ADS) on Stock Picks Bob's Advice when the stock was trading at $60.43. ADS closed at $59.11 on May 9, 2008, for a loss of $(1.32) or (2.2)% since posting. I do not own any shares nor do I own any options in Alliance Data Systems.
On April 23, 2008, Alliance Data Systems (ADS) reported 1st quarter 2008 results. For the quarter ended March 31, 2008, revenue increased 7% to $499.3 million vs. $466.3 million for the same quarter in 2007. Income dipped 3% to $62.7 million in the quarter vs. $64.7 million or $.78/share down from $.80/diluted share in the prior year. (These results were adversely affected by the one-time costs associated with the cancelled sale of the company to the Blackstone Group.)
Reviewing the Morningstar.com "5-Yr Restated" financials on ADS, we can see that revenue growth is intact, earnings have dipped in the trailing twelve months and 2007, shares are stable, free cash flow is solid, and the balance sheet appears adequate.
With most of the financial data intact,
ALLIANCE DATA SYSTEMS (ADS) IS RATED A HOLD
Let's take a look at the chart.
Reviewing the "point & figure" chart on Alliance from StockCharts.com, we can see the recent sharp decline in price performance from a peak at $80 in October, 2007, to a low of $40 in January, 2008. The stock is fighting back and recently broke through a resistance level but has a lot of 'work to do' to get back into a positive technical pattern (imho).
So how did I do with these two stock picks from the week of October 16, 2006? In a word, mediocre! Both declined in price from the selection price and had an average decline of (22)% since posting!
I do believe that these types of stock performance support my own belief in the need for disciplined management of holdings and that the 'buy and hold' proposition is far too risky for me!
Thank you again for dropping by! I hope you all have a great weekend. If you get a chance be sure and drop by my Covestor Page where you can monitor my own trading portfolio (which has been very stable for the past month or so), my SocialPicks Page where you can view my past stock picks and how they have been doing at least from early 2007, and my Podcast Page where you can listen and download mp3's that I have put together on some of the many stock picks on this blog!
If you have any comments or questions, please feel free to leave them on the blog or email me at bobsadviceforstocks@lycos.com.
Yours in investing,
Bob
Wednesday, 7 May 2008
Charles River Laboratories (CRL) "Revisiting a Stock Pick"
Hello Friends! Thanks so much for stopping by and visiting my blog, Stock Picks Bob's Advice! As always, please remember that I am an amateur investor, so please remember to consult with your professional investment advisers prior to making any investment decisions based on information on this website.
 I was looking through the list of top % gainers this afternoon and came across an 'old favorite' of mine, Charles River Laboratories (CRL) which closed strongly higher at $64.00/share, up $6.08 or 10.5% on the day.
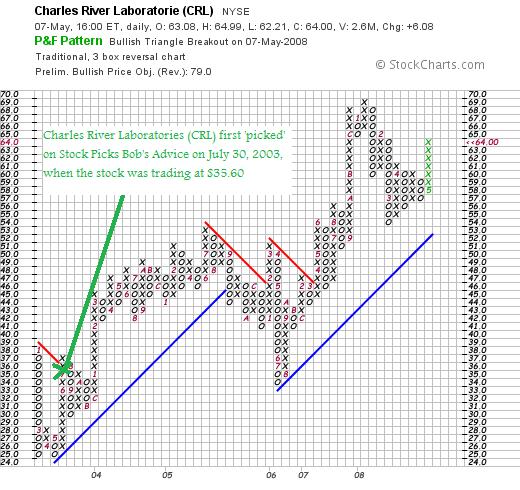
I use the term 'old favorite' because this was a prior stock pick of mine going all of the way back to July 30, 2003, when I 'picked' Charles River Laboratories for Stock Picks Bob's Advice when the stock was trading at $35.60. With the stock closing at $64.00, this represents a gain of $28.40 or 79.8% since posting this stock almost five years ago! I do not own any shares nor do I have any options on this stock.
Let's take a closer look at this company and I will explain why
CHARLES RIVER LABORATORIES (CRL) IS RATED A BUY
First of all,
What does this company do?
According to the Yahoo "Profile" on Charles River Laboratories, the company
 "...together with its subsidiaries, provides solutions that advance the drug discovery and development process, including research models and associated services, and outsourced preclinical services worldwide. The company operates in two segments, Research Models and Services (RMS) and Preclinical Services (PCS). The RMS segment involves in the commercial production and sale of research models, principally purpose-bred rats, mice, and other rodents for use by researchers. It also offers new and proprietary, disease-specific rat models used to find new treatments for diseases, such as diabetes, obesity, cardiovascular, and kidney disease. In addition, this segment provides research models services comprising transgenic services, research animal diagnostics, consulting and staffing services, and discovery services. Further, it provides vaccine support and in vitro technology products for the testing of medical devices and injectable drugs for endotoxin contamination. The PCS segment engages in the discovery and development of new drugs, devices, and therapies. It offers toxicology studies; pathology services; bioanalysis, pharmacokinetics, and drug metabolism services; discovery support; biopharmaceuticals services; and clinical services, including Phase I trials in healthy normal and special populations."
How about the latest quarterly result?
As is often the case, it was the announcement of 1st quarter 2008 results after the close of trading yesterday that drove the stock higher today, in spite of the overall week market tone. For the quarter, net sales increased 16% to $337.7 million from $291.2 million in the same quarter in 2007. Net income for the quarter came in at $45.2 million or $.64/diluted share, up from $36.8 million or $.54/diluted share during the same period in 2007. Non-GAAP results (what analysts estimate), amounted to a profit of $50.8 million or $.72/share, up from $43.2 million or $.64/share last year.
These results exceeded expectations of analysts polled by Thomson Financial, which were for a profit of $.69/share on $325.2 million in revenue. The company reaffirmed guidance in line with analysts' expectations for the balance of 2008.
How about longer-term results?
Reviewing the Morningstar.com "5-Yr Restated" financials on CRL, we can see the steady record of revenue growth from $599 million in 2003 to $1.23 billion in 2007. Earnings during this period have grown, albeit somewhat erratically, from $1.64/share in 2003 to $2.25/share in 2007 (after posting a loss of $(.80)/share in 2006).
The company does not pay any dividends and has maintained outstanding shares fairly stable with 54 million in 2003, and 67 million in 2007. Free cash flow has also been a bit irregular dropping from $122 million in 2005 to a negative $(6) million in 2006 before rebounding to $61 million in 2007.
The balance sheet appears strong with $225 million in cash and $382 million in other current assets reported on Morningstar.com, compared to $302.5 million in current liabilities and $642.5 million in long-term liabilities. This works out to a current ratio of 2.01.
What about some valuation numbers?
Looking at Yahoo "Key Statistics" on CRL, we can see that the company is a mid cap stock with a market capitalization of $4.36 billion. The trailing p/e is a moderate 28.5 with a forward p/e (fye 29-Dec-09) estimated at 18.93. The PEG ratio comes in at an acceptable 1.43.
Utilizing the Fidelity.com eresearch website, CRL has a Price/Sales (TTM) of 3.09, vs. an industry average of 6.69. In terms of profitability, CRL has a Return on Equity (TTM) of 9.06% compared to an industry average of 10.60%.
Finishing up with Yahoo, there are 68.18 million shares outstanding with 65.51 million that float. As of 4/10/08, there were 4.5 million shares out short representing 9.5 trading days of volume (well above my '3 day rule' for short interest significance.) No dividends and no stock splits are reported on Yahoo.
What does the chart look like?
Examining the 'point & figure' chart on CRL from StockCharts.com, we can see the fairly steady price appreciation, with the dip in 2006 correlated with the short-term drop in the company's prospects. The price has moved from $25/share in March, 2003, to a recent high of $69 in January, 2008. The stock has been trading above the support levels for the past two years but does not appear over-extended to me.
Summary: What do I think about this stock?
Avoiding the issues of 'animal rights', I like the stock and its performance. They reported a great quarter, beat expectations on both earnings and revenue and confirmed guidance. Valuation is reasonable with a PEG under 1.5 and a Price/Sales below the industry average. Return on Equity did come in a slight bit light.
After a dip in 2006, the company has rebounded in an impressive pattern of growth. I do believe the opportunities for theis company are great with the continued demand for new drugs and therapeutic interventions to improve all of our quality of life. Finally the chart looks strong as well.
Now, if I just had a signal to be buying some shares. Meanwhile, I shall continue to 'sit on my hands' in the face of this tumultuous market.
Thanks again for visiting! If you have any comments or questions, please feel free to leave them on the blog or email me at bobsadviceforstocks@lycos.com. If you get a chance, be sure and visit my Covestor Page where you can monitor my actual trading account, my SocialPicks Page where you can view my latest stock picks and the results of past stock market investment ideas. Also, visit my Stock Picks Podcast Page where you can download some mp3's on some of the many stocks I write about here on the blog.
Have a great 'rest-of-the-week' in traidng and investing!
Yours in investing,
Bob
Thursday, 1 May 2008
Heartland Payment Systems (HPY)
Hello Friends! Thanks so much for stopping by and visiting my blog, Stock Picks Bob's Advice! As always, please remember that I am an amateur investor, so please remember to consult with your professional investment advisers prior to making any investment decisions based on information on this website.
 I want to try once again to make this a brief entry. I used to be able to write up these stocks in a paragraph, and lately, I have been writing up long entries explaining a 'pick'.
Heartland Payment Systems (HPY) made the list of top % gainers on the NYSE today and is currently trading at $24.32, up $2.42 or 11.05% on the day. I do not own any shares nor do I have any options on this stock.
Let me briefly go through this stock and explain why
HEARTLAND PAYMENT SYSTEMS (HPY) IS RATED A BUY
 First of all, according to the Yahoo "Profile" on Heartland, the company
"...together with its subsidiaries, provides bank card payment processing services to merchants in the United States. Its services involve facilitating the exchange of information and funds between merchants and cardholders' financial institutions; and providing end-to-end electronic payment processing services to merchants, including merchant set-up and training, transaction authorization and electronic draft capture, clearing and settlement, merchant accounting, merchant assistance and support, and risk management. "
Regarding the latest quarter, it was the announcement of 1st quarter 2008 results today, prior to the opening of trading, that drove the stock higher. Total revenues for the quarter came in at $340 million, up 19.5% compared to the $284 million reported in the same year-earlier period.
Net income was $9.0 million, compared to $6.9 million last year and earnings/diluted share worked out to $.23/share, up from $.17/share last year.
The company beat expectations on the revenue and earnings side which, according to analysts polled by Thomson Financial, had been expected to come in at $.21/share on $333 million of revenue.
Longer-term, reviewing the Morningstar.com "5-yr Restated" on Heartland, we can see the steady revenue growth from $422 million in 2003 to $1.3 billion in 2007. Earnings growth has been less steady, dipping from $.62/share in 2003 to $.26/share in 2004, before rebounding steadily to $.90/share in 2007. The company initiated dividends in 2006 paying $.05/share, and increased that payment to $.25/share in 2007. Free cash flow has improved from a negative $(38) million in 2005 to $38 million in 2007.
The balance sheet appears solid with $36 million in cash and $163 million in other current assets which easily covers the $136 million in current liabilities as well as the $27.5 million in long-term liabilities reported on Morningstar.
Using Morningstar for a few Statistics, HYP has a p/e of 24.3 (industry average of 21.5), Price/Book of 4.9 (Industry average of 5.0) and a Price/Sales of 0.7 (Industry average of 3.2). The company is selling at 12.1x free cash flow, vs the industry average of 19.0 and yields 1.3% the same as the industry average.
The forward price/earnings is reported on Morningstar as 15.6 below the industry average of 18.5 and the company has a great PEG ratio of 0.7 vs the industry average of 1.3. The "PEG Payback" is 6.4 years, vs the industry average of 8.6 years.
Finally, Yahoo "Key Statistics" on HPY shows the company with 37.27 million shares outstanding with 21.88 million that float. There were 3.03 million shares out short as of 4/10/08, representing 11.2% of the float o4 a short ratio of 15 trading days. Using my own 3 day rule for short interest, this is quite significant and we may well be witnessing a bit of a squeeze today.
Taking a look at a 'point & figure' chart on Heartland (HPY) from StockCharts.com, we can see a rather uninspiring technical picture, with the stock gradually appreciating from the $18 level back in August, 2005, to a high of $32 in November, 2007. The stock sold off back to $19.50 in March, 2008, only to rally through April into today's price of $24.31. This is not a very strong chart, yet certainly the stock is not overextended either!
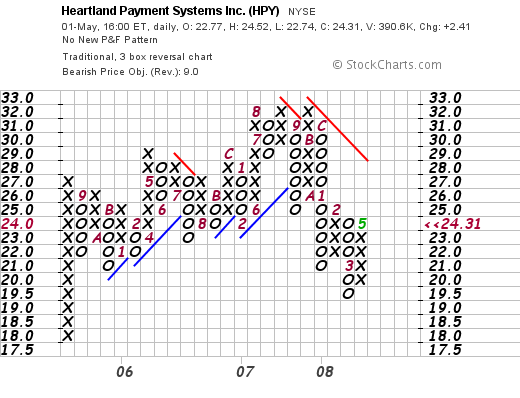
To summarize, I like this stock more than I like its chart. They reported a terrific quarter that beat expectations on both revenue and earnings. Their longer-term record is solid and the valuation figures are very attractive with a PEG well under 1.0 and other indices either at or below industry averages.
Anyhow, that's a wrap! I would like to try to keep things briefer around here yet get the information across. If you have any comments or questions, please feel free to leave them on the blog or email me at bobsadviceforstocks@lycos.com.
Yours in investing,
Bob
Posted by bobsadviceforstocks at 12:54 PM CDT
|
Post Comment |
Permalink
Updated: Thursday, 1 May 2008 12:55 PM CDT
Sunday, 27 April 2008
"Looking Back One Year" A review of stock picks from the week of October 9, 2006
Hello Friends! Thanks so much for stopping by and visiting my blog, Stock Picks Bob's Advice! As always, please remember that I am an amateur investor, so please remember to consult with your professional investment advisers prior to making any investment decisions based on information on this website.
It is Sunday, and although I do have about a million other things to be doing around the house, I wanted to try to get this review up so that I don't get another week behind!
As I have explained many times before, these reviews assume a buy and hold approach to investing. This means that my performance analysis assumes an investment of equal $'s into each of the stock picked that particular week and continued holding of that stock regardless of its price performance.
In practice, I advocate a disciplined investment strategy that requires me to sell stocks completely after targeted declines and sell portions of appreciating stocks at pre-determined appreciation targets. O.K. if that sounds too complicated you can listen to my podcast on this topic.
Last weekend I reviewed the picks from the week of October 2, 2006 from this blog. Going a week ahead, let's take a look at the three stocks picked during the week of October 9, 2006! Too keep these reviews as concise as possible, I shall try to examine 1) the price performance since selected, 2) the latest quarter result, 3) the Morningstar.com "5-Yr Restated" financials, and 4) the chart. I choose my "buy" and "hold" and "sell" ratings, based on these screens. I am also lately reluctant to rate anything a "sell" if the chart suggests that most of the damage has already done.
 On October 10, 2006, I posted Johnson Controls (JCI) on Stock Picks Bob's Advice when the stock was trading at $81.00. JCI had a 3:1 stock split on October 3, 2007, making my effective 'pick price' actually $27. Johnson Controls closed April 25, 2008, at $33.95, giving this pick a gain of $6.95 or 25.7% since posting. I do not own any shares or options of JCI, but my wife has some shares in her IRA and my stock club own shares currently
On April 16, 2008, Johnson Controls reported 2nd quarter 2008 results. For the quarter ended March 31, 2008, sales increased 11% to $9.4 billion from $8.5 billion last year. Net income came in at $289 million, up from $228 million last year. Diluted earnings per share grew to $.48/share from $.38/share. (Continuing operations earnings were $.48 vs. $.44/share last year).
This was a solid report that beat expectations. Analysts had expected $.47/share on revenue of $9.37 billion.
Review of the Morningstar.com "5-Yr Restated" financials on JCI shows continued steady revenue growth, earnings growth, dividend growth, stable shares outstanding increases, increasing free cash flow, and a satisfactory balance sheet.
Reviewing the 'point & figure' chart on JCI from StockCharts.com, we can see that while there has been some consolidation in the stock price from its recent high of $44/share, the stock appears quite strong and is trading well above the support line with recently demonstrating a series of higher lows.
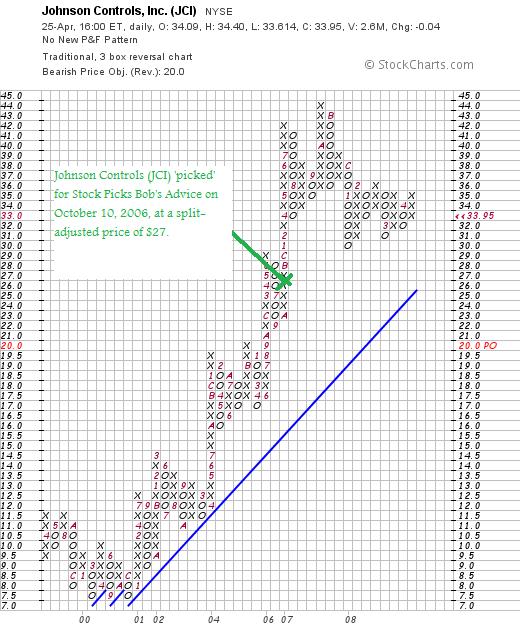
JOHNSON CONTROLS (JCI) IS RATED A BUY
 On October 11, 2006, I posted CVS Corp (CVS) on Stock Picks Bob's Advice when the stock was trading at $31.16/share. The following month, on November 2, 2006, CVS announced the pending acquisition of Caremark Rx Inc. in a $22.5 billion deal with the resulting company named CVS/Caremark (CVS). This acquisition was completed by March 23, 2007.
CVS Caremark (CVS) closed at $40.93 on April 25, 2008, giving this stock pick a gain of $9.77 or 31.4% since posting. I do not own any shares or options of this stock.
On January 31, 2008, CVS Caremark reported 4th quarter 2007 results. Revenue for the quarter increased 81% to $21.9 billion for the quarter ended December 29, 2007. This large increase was attributed to the Caremark purchase which closed in March, 2007. Earnings came in at $815 million or $.55/share, compared to $.417.2 million or $.49/share.
The company beat expectations by a penny as analysts polled by Thomson Financial had been expecting $.54/share. Within the report, the company noted that same-store sales increased 3.4% balanced evenly between pharmacy sales which increased 3.6% and front-end sales which grew 2.9%.
Looking at the Morningstar.com "5-Yr Restated" financials on CVS, we can see the large jump in sales in the last twelve months, the steady increase in earnings as well as dividends, but unfortunately there was a large increase in outstanding shares from 853 million in 2006 to 1.3 billion in 2007.
However, the company was able to increase per share amounts in spite of this increase and still post increasing free cash flow as well as show a satisfactory balance sheet with approximately $14 billion in current assets vs. $10.7 billion in current liabilities. The company does have $12.6 billion in long-term liabilities reported on Morningstar.
Examining the 'point & figure' chart on CVS from StockCharts.com, we can see that after declining between 2001 through 2002 from $31 to a low of $11 in late 2002, the company turned around and started moving steadily higher to a high of $42 in November, 2007. With the company trading at $40.93, the company is just about a dollar under its all-time high. The chart looks very strong to me.
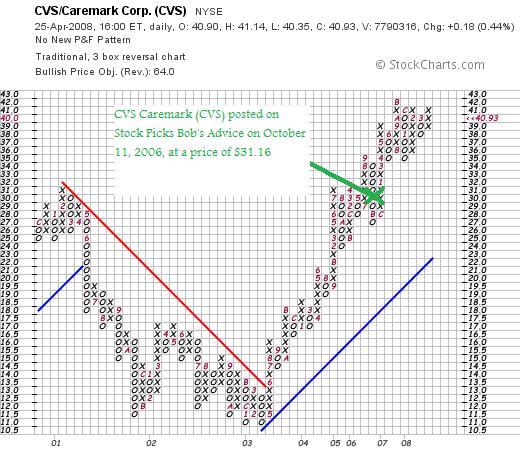
CVS CAREMARK (CVS) IS RATED A BUY
 On October 12, 2006, I posted Regal-Beloit (RBC) on Stock Picks Bob's Advice when it was trading at $47.18. RBC closed at $36.75 on April 25, 2008, for a loss of $(10.43) or (22.1)% since posting. I do not own any shares or options of this stock.
On February 6, 2008, Regal-Beloit (RBC) reported 4th quarter 2007 results for the quarter ended December 29, 2007. Net sales increased 29.5% to $474.7 million, from $366.6 million in the prior year same quarter. Diluted earnings per share increased 4.4% to $.71/share from $.68/share last year.
The company beat expectations on revenue which had been expected to come in at $461.2 million (the company reported $474.7 million) and met expectations of $.71/share according to analysts polled by Thomson Financial.
The company related that the residential market was difficult, likely reflecting the current slow-down in residential construction:
"The fourth quarter proved to be especially challenging. The combination of a weaker-than-expected fourth quarter residential heating, ventilating, and air conditioning (HVAC) market, the expected materials cost gap, and essentially no bottom line help from our new acquisitions, held back the margin and bottom line improvements that took place in our business," Chairman and Chief Executive Henry Knueppel said in a statement."
Looking longer-term, with the Morningstar.com "5-Yr Restated" financials on RBC, we can see an intact picture of steady revenue growth, steady earnings growth, steady dividend growth, relatively stable outstanding shares, increasing free cash flow, and a solid balance sheet with $730 million in current assets and $311.9 million in current liabilities. The company does have $692.3 million in long-term liabilities on the book reported by Morningstar.
Checking the 'point & figure' chart on Regal-Beloit (RBC), we can see the sell-off in shares starting in September, 2007, and continuing into 2008, although on the short-term, the company appears to have found some support in the $33 range with a series now of three consecutive higher lows short-term. I am not sure of the technical significance of the last observation. Certainly the stock has been under quite a bit of pressure and needs a lot of 'work' to get back on a bullish trend.
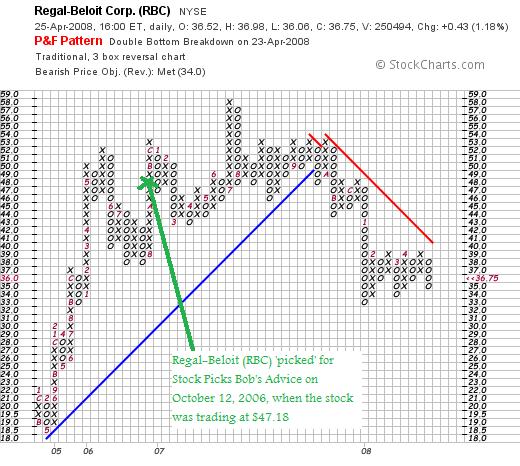
With the guarded performance the latest quarter, the continued weakness in housing and the economy, even though the company reported a good quarter, maintains a good Morningstar.com 5-Yr page, the chart looks discouraging. Thus,
REGAL-BELOIT (RBC) IS RATED A HOLD
So in summary, how did I do with these two stock picks? Well considering when I posted them and the difficult stock market since, well not that bad. Two showed gains and one a loss with an average of an 11.7% gain on these three stocks.
Thanks again for stopping by and visiting! If you have any comments or questions, please feel free to leave them on the blog or email me at bobsadviceforstocks@lycos.com.
If you are interested, please feel free to visit my Covestor Page where you can review the performance and holdings of my actual trading portfolio, my SocialPicks Page where you can view an analysis of my picks for the past year-and-a-half, and my Podcast Page where you can download some mp3's and listen to me discuss some of the many stocks reviewed on this blog!
With my warmest wishes to you all! Wishing you a week full of good health and financial success!
Yours in investing,
Bob
Friday, 25 April 2008
A NEW Podcast for Trimble (TRMB)!
Hello Friends! Thanks so much for stopping by and visiting my blog, Stock Picks Bob's Advice! As always, please remember that I am an amateur investor, so please remember to consult with our professional investment advisers prior to making any investment decisions based on information on this website.
I just wrote up Trimble (TRMB) on the blog.
Click HERE to listen to my podcast on Trimble!
Yours in investing!
Bob
Trimble Navigation (TRMB) "Revisiting a Stock Pick"
Hello Friends! Thanks so much for stopping by and visiting my blog, Stock Picks Bob's Advice! As always, please remember that I am an amateur investor, so please remember to consult with your professional investment advisers prior to making any investment decisions based on information on this website.
 The stock market has been acting a little bit healthier the last week or two. And it is nice to see 'our kind of stocks' moving higher and making the top % gainers list once more.
In fact, reviewing the list of top % gainers on the Nasdaq today, I noticed that Trimble Navigation (TRMB), an 'old favorite' of mine, had made the list closing at $34.71, up $6.58 or 23.39% on the day. I do not own any shares nor do I have any options on this stock.
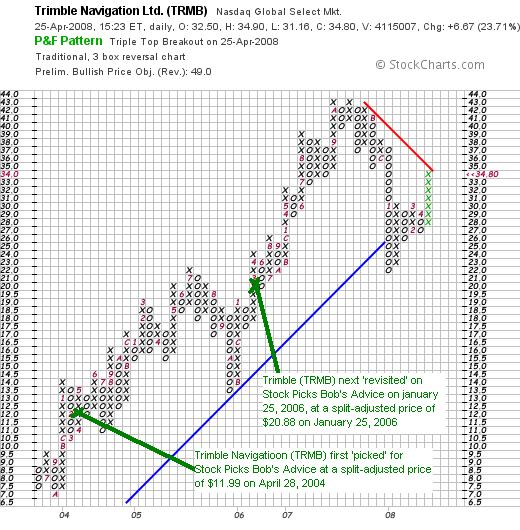
I say 'old favorite' because I first wrote up Trimble on Stock Picks Bob's Advice on April 28, 2004, when the stock was trading at $25.98, which adjusted for a 2:1 stock split on February 23, 2007, works out to a 'pick price' of $12.99. With TRMB closing at $34.72 today, this represents a gain of $21.73 or 167.3% since that original posting.
In addition to the write-up in 2004, I again visited Trimble (TRMB) on Stock Picks on January 25, 2006, when the stock was then trading at $41.76, which adjusted for the same 2:1 split in 2007, works out to a pick price of $20.88. Again, with the stock closing today at $34.72, this represents an appreciation of $13.84 or 66.3% since that pick!
So you can see that I didn't really want to hesitate about writing up this stock once again today!
Let's take a closer look at Trimble (TRMB) and I will explain why
TRIMBLE NAVIGATION (TRMB) IS RATED A BUY
 First of all,
What exactly do they do?
According to the Yahoo "Profile" on Trimble (TRMB), the company
"...provides advanced positioning product solutions to commercial and government users worldwide. It operates in four segments: Engineering and Construction, Field Solutions, Mobile Solutions, and Advanced Devices."
How did they do in the latest quarter?
Yesterday, after the close of trading, Trimble announced 1st quarter 2008 results. Revenue for the quarter ended March 28, 2008, came in at $355.3 million, up 24% over the revenue of $285.7 million in the first quarter of 2007.
Net income for the quarter was $40.1 million, up 40% compared to net income of $28.7 million in the same quarter last year. Diluted earnings per share worked out to $.32/share, up 35% from diluted eps of $.24/share in the first quarter of 2007.
Most importantly, the company beat expectations of $.35/share (they earned $.40/share excluding one-time items). Revenue had been expected to come in at $338.7 million and as noted above, they came in at $355.3 million.
To top off things, the company went ahead and raised guidance for 2nd quarter 2008. Analysts had been expecting revenue of $375.2 million and earnings of $.41/share. The company guided to revenue of $374 to $379 million in revenue and earnings between $.44 and $.46/share.
In my own idiosyncratic terminology, I like to call this a 'trifecta-plus' which for me means an earnings report of increasing earnings, greater revenue, that beats guidance and then the company raises guidance. Trimble delivered and the street responded in a very favorable fashion!
What about longer-term results?
Checking the Morningstar.com "5-Yr Restated" financials on TRMB, we can see that revenue has been steadily growing from $541 million in 2003 to $1.22 billion in 2007. During this period earnings have also been increasing from $.39/share to $.94/share. Outstanding shares have grown modestly from 100 million shares in 2003, they company increased the float by 24% to 124 million in 2007. During this same time, the sales increased more than 100% and earnings likewise increased greater than 100%. Thus, this is an acceptable dilution from my perspective.
Free cash flow the last several years has been positive and growing, increasing from $69 million in 2005 to $174 million in 2007. The balance sheet, as presented by Morningstar, appears solid. The company has $103 million in cash and another $453 million in other current assets. Comparing this to the $249.9 million in current liabilities yields a current ratio of 2.22.
What about some valuation numbers?
According to the Yahoo "Key Statistics" on Trimble (TRMB), the company is a mid cap stock with a market capitalization of $4.23 billion. The trailing p/e is a relatively rich 37.01, with a forward p/e of 20.41 (fye 28-Dec-09 estimated). Thus, with the rapid growth anticipated, the PEG comes in at a reasonable 1.12. (Reasonable for me is 1.0 to 1.5).
Referring to the Fidelity.com eresearch website, we can see that at least by the Price/Sales (TTM) ratio, TRMB is reasonably priced with a ratio of 2.77 compared to the industry average for Price/Sales (TTM) of 8.13. In terms of profitability, Fidelity reports TRMB with a Return on Equity (TTM) of 11.31, ahead of the industry average of 9.41%.
Yahoo reports that TRMB has 121.16 million shares outstanding with 120.19 million that float. As of 8/26/08, there were 5.64 million shares out short representing 7 trading days of volume (the short ratio), well ahead of my own idiosyncratic '3 day rule' for short interest. This short interest was ahead of the prior month's 4.78 million number and today's sharp move higher may well have been the result of short-sellers getting 'squeezed'.
No cash dividends are paid, and as I noted above, the last stock split was a 2:1 split on February 23, 2007.
What does the chart look like?
Reviewing the 'point & figure' chart on Trimble (TRMB) from StockCharts.com, we can see that this stock has not escaped the recent pressure on all stocks this year as it dipped from its high at $43/share set in October, 2007, to a recent low of $22 in January, 2008. With the stock now trading at $34.80, it is moving in on resistance area (the 'red line')---it would nice to see this stock break through this price area to confirm a new bullish move higher.
Summary: What do I think about this stock?
Well it would be corny to say I love this stock. I mean, my kids would say, 'if you love that stock, why don't you MARRY it?' O.K., so it isn't love, but how about intense affection?
They made a terrific move higher today. This is the third time it has come across my horizon the past four years!
Their earnings were great, they beat expectations and raised guidance. They have a long-term track record to 'write home about!' I mean, steady revenue growth, steady earnings growth, relatively stable outstanding shares, growing positive free cash flow and a strong balance sheet.
Valuation is a tad rich per p/e but the PEG suggests that even this isn't so bad! Meanwhile, the Price to Sales is less than its peers and the Return on Equity is greater! To top it off there were loads of shares out short and I suspect some of them are getting squeezed. Even the chart looks acceptable without being overvalued.
Now, if only I had purchased some shares. I still don't have a signal to be buying anything, but if I were....well this is the kind of stock that would be making itself home in my portfolio!
Thanks again for visiting! If you have any comments or questions, please feel free to leave them on the blog or email me at bobsadviceforstocks@lycos.com. If you get a chance, be sure and visit my Covestor Page where you can read about how my actual trading portfolio is performing, my SocialPicks page where you can see how my picks are doing from the past year or so, and my Podcast Page where if you haven't had enough of my discussions, you can download some mp3's of me talking about some of the many stocks I write up and answer emails from readers.
Have a great weekend everyone!
Yours in investing,
Bob
Wednesday, 23 April 2008
My Prosper.com Account: Update #3
 Hello Friends! Thanks so much for stopping by and visiting my blog, Stock Picks Bob's Advice! As always, please remember that I am an amateur investor, so please remember to consult with your professional investment advisers prior to making any investment decisions based on information on this website.
 Like a "mad scientist", I am continuing my Prosper.com experiment of person-to-person lending. I am still not sure whether this 'experiment' will turn out to be profitable for me or not. And I hope that my own experience will help you decide whether it is worthwhile for you to be venturing into this world of group-lending in the pursuit of higher interest returns on your loans as well as the possibility of finding funds that you might wish to borrow as well for your own ventures.
Last month, I wrote up "Update #2". Well, another month has passed, I have contributed some more funds to this account and the results remain mixed.
The background of interest in person-to-person lending stems from the fact that interest rates paid to investors on CD's at banks continue to remain quite low. As reported on CNN.com this past February:
"Since September the central bank has lowered the so-called Fed funds rate, which affects how much consumers pay on credit cards, home equity lines of credit and auto loans, five times from 5.25% to 3%.
As a result, consumers looking to park their cash no longer enjoy a wealth of high-yielding options.
A one-year certificate of deposit is yielding an average 2.75%, down from 3.76% in September, according to Bankrate.com.
Even banks that scored multitudes of new customers by offering online savings accounts with high yields are now scaling back on the sky-high rates they once offered.
The rate on EmigrantDirect's online savings accounts, which yielded 5.05% a year ago, has fallen to 4.05%. ING Direct has slashed the rates on its offering by more than a full percentage point to 3.40% from 4.50% a year ago, according to Bankrate.com."
At the same time, many borrowers are finding that their balances on credit cards are costing them record amounts of interest.
As recently reported:
"When Brenda Fishkin got the letter from Bank of America last month, she thought it might be a joke.
The bank said it planned to almost double the interest rate on her credit card, from about 13 percent to 24.99 percent. Fishkin, who is 60, couldn't figure out what she'd done to incur the higher rate. She had never been late on a credit card payment, had just refinanced her home at a lower interest rate and had just been rewarded by her credit union with a lower rate on her credit card there, she said.
"Trust me," said Fishkin, who lives with her husband in Dallas, N.C. "I wouldn't be aggravated if I were a late customer and I deserved it."
Fishkin's displeasure is shared by hundreds of people who started filling up online message boards recently with complaints that issuers, including industry leader Bank of America, hiked their credit card rates without explaining why."
So with interest paid to savers near record lows, and many people facing credit card debt at high rates of interest, it is not surprising that the internet should offer the opportunity of savers and borrowers alike to meet and do business. But will it be profitable for the average investor like myself? That remains to be seen.
So back to my loan portfolio.
As of April 23, 2008, I have 60 active loans. 55 are now current. 2 are less than 15 days late, 1 is 15 to 30 days late on a payment, 1 is 1 month late and in collections, and 1 is 2 months late and also in collections. Thus far, there have been no default. But it appears that at least one or two of these loans are certainly headed in that direction.
I have now lent out a total of $3,423.57. I have received loan payments totaling $406.98. My current value of my loans is $3,167.84, with an average interest rate of 15.57%. My daily interest accrual is $1.34. Net income totals (interest + fees + reward) $120.07, and as noted there have been not defaults.
I mention "rewards" above, and indeed I have received $75.00 in "rewards" from Prosper.com for referrals which works out to $25.00 awarded to me for sending a new lender to the website, and $25.00 which is actually given to that lender as well when he/she initiates a new loan. (You can earn this $25 and I earn $25 as well when you go to Prosper with the hyperlinks on this blog!)
To get a 'third party' evaluation of my loan portfolio performance, you can visit LendingStats.com and see how they rate my loans. Currently they are estimating, when all things are said and done, that I will be earning closer to 5.36% not the 15.57% when defaults are considered.
Of course when you participate in loans, you depend a lot on what people say about who they are and what they are going to do with the funds. The site of course does verify much of their financial information and rates the borrowers by their 'credit-worthiness'.
But the unknown information about potential borrowers still recalls the great cartoon from the New Yorker by Peter Steiner:

Thanks again for dropping by! I shall keep you posted on my Prosper.com account. The jury is out on whether this shall even be a profitable venture for me! Meanwhile, I continue to add my $50 twice a month to the account and utilize automatic bidding by "Portfolio Plans" to pick my loans I which to participate on.
If you have any comments or questions, please feel free to leave them on the blog or email me at bobsadviceforstocks@lycos.com.
Yours in investing,
Bob
Posted by bobsadviceforstocks at 10:36 PM CDT
|
Post Comment |
Permalink
Updated: Wednesday, 23 April 2008 10:38 PM CDT
Newer | Latest | Older


