Stock Picks Bob's Advice
Wednesday, 4 June 2008
Greif (GEF) "Revisiting a Stock Pick"
Hello Friends! Thanks so much for stopping by and visiting my blog, Stock Picks Bob's Advice! As always, please remember that I am an amateur investor, so please remember to consult with your professional investment advisers prior to making any investment decisions based on information on this website.
 Earlier today I saw that an old favorite of mine, Greif (GEF) had made the list of top % gainers on the NYSE. Greif had a nice day trading today and closed at $68.92, up $2.80 or 4.23% on the day. However, that 4.23% gain was not enough by the close to keep it on the list. However, since it was on the list earlier, I certainly reserve the right :) to 'revisit' this stock!
I would like to explain why I still feel that
GREIF (GEF) IS RATED A BUY
On April 5, 2005, I first discussed Greif (GEF) and actually purchased some shares at that time. Gef was trading at a split-adjust price of $37.03 at  that time. Unfortunately, with my trading rules I sold my shares of GEF when they hit an (8)% loss just a few months later and do not currently own any shares or options on this stock. In fact, I revisited GEF on December 12, 2006, when the stock was trading at a split-adjusted price of $57.88.
So here it is another year-and-a-half later and Greif (GEF) is making the list again, and once again I shall tell you why it belongs on the blog (and maybe in my portfolio if I get the opportunity).
It is a big late, so let me try to be brief.
First of all, according to the Yahoo "Profile" on Grief (GEF), the company
"...engages in the manufacture and sale of industrial packaging products, and containerboard and corrugated products worldwide. It operates in three segments: Industrial Packaging and Services; Paper, Packaging, and Services; and Timber. Industrial Packaging and Services segment offers industrial packaging products, such as steel, fiber, and plastic drums; intermediate bulk containers; closure systems for industrial packaging products; and polycarbonate water bottles."
The stock moved higher today in anticipation of an earnings report that was scheduled to be announced after the close of trading. In fact right after the close of trading the company announced 2nd quarter 2008 results. Net sales climbed 13% (7% adjusted for the positive effect of currency translation), net income was $54.3 million or $.92/diluted Class A share, compared to $39.2 million or $.66/diluted Class A share last year.
In itself that was a strong report.
But more importantly than just a strong report, the impact of a financial result is best understood in terms of expectations. In this case, analysts polled by Thomson Financial had expected earnings of $.87/share. Thus the company beat expectations!
Sort of like icing on a cake.....

if we can also as shareholders own shares in a stock in which the company not only reports strong results, beats expectations but also raises guidance we are in great shape! (Assuming we haven't partaken of too much of that cake!)
Greif (GEF) indeed did raise expectations by raising fiscal year 2008 guidance to $4.25 to $4.45/Class A share, from its previous forecast of $4.15 to $4.35/share.
I really do like these sorts of announcements from a company!
But let's take a quick look at the longer-term picture of Greif (GEF) as my 'pick' depends not only on strong current results but a longer-term record of persistence of good results.
In this case, reviewing the Morningstar.com "5-Yr Restated" financials on Greif (GEF), we can see that revenue has been steadily increasing from $1.92 billion in 2003 to $3.32 billion in 2007 and $3.42 billion in the trailing twelve months (TTM). Earnings have also been steadily and dramatically increasing from $.28/share in 2003 to $.92/share in 2007 and $1.02/share in the TTM.
Dividends are great. But a company that can steadily increase its dividend is even nicer! I recently heard Jim Cramer also comment on his interest in increasing dividends. This isn't a new concept. I do not restrict myself to stocks that even pay dividends, but when I can find a stock that not only pays dividends but also increases dividends regularly I certainly think this is another attractive point about a stock pick.
In 2003, Greif (GEF) paid $.28/share. This was increased each year to $.92/share (a more than 3-fold increase in the dividend in 4 years!), and the company has paid $1.02 in the trailing twelve months.
Free cash flow is solid with $103 million in 2005 increasing to $273 million in 2007 and falling back slightly to $190 million in the trailing twelve months.
The balance sheet appears at least adequate with $107 million in cash and $797 million in other current assets. This total of $904 million in current assets when compared to the $624 million in current liabilities yields a healthy current ratio of 1.45. The company does have a significant level of long-term liabilities reported at $1.1 billion, but this does not appear to be a problem for Greif (GEF).
In terms of valuation, Greif is a mid cap stock with a market cpaitalization of $3.23 billion. The trailing p/e according to Yahoo "Key Statistics" on Greif (GEF) is 22.37 with a forward p/e (fye 31-Oct-09) estimated at 13.92. The PEG is a very nice 0.91. (5 yr expected).
Referring to the Fidelity.com eresearch website, we find that the Price/Sales ratio is reasonable at 0.90 compared to the industry average of 0.86. The company is far ahead of its peers with a return on equity (TTM) ratio of 19.21% compared to the industry average of a negative (11.73)%.
Yahoo reports 46.81 million shares outstanding with 41.90 million of them that float. As of May 12, 2008 there were 2.41 million shares out short representing 9.2 trading days of volume (the short ratio) or 10.2% of the float. This was down slightly from the 2.45 million shares out short the prior month.
I don't fully understand why so many shares would be out short on such a 'high quality' company from my perspective. But then again, I don't understand a lot of things :). However, with the strong earnings report coming out today, I suspect the short squeeze may have started today in anticipation of the earnings report, as short-sellers rushed to cover their 'negative bets' looking for shares to purchase. I use an arbitrary '3 days' as a level of significance--with Greif at 9 days, this is something to consider.
As I have noted the company pays a nice dividend--and has been regularly increasing it. In fact, the forward dividend rate is $1.52/share yielding a nice 2.3%. This still represents a payout ratio of only 33% giving the company lots of leeway to operate and increase it further in the future.
As I also noted above, the company last split is stock with a 2:1 stock split effective April 12, 2007.
Finally, let's take a look at the chart for Greif (GEF) from StockCharts.com:
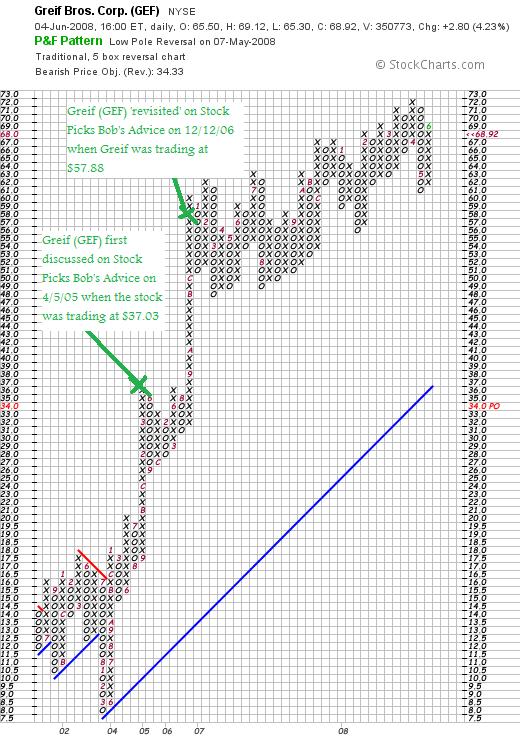
Needless to say, from my amateur perspective, this is a beautiful chart of incredible price momentum strength.
In summary, there are several reasons why I really like this stock. First of all they had a great earnings report which beat expectations and then they went ahead and raised guidance. They have a record of steady revenue and earnings growth while keeping their outstanding shares quite stable.
The company has been paying a dividend and has been consistently been raising it. They are producing an increasing amount of free cash flow and the balance sheet appears solid.
Valuation-wise, the company appears reasonably priced with a p/e in the low 20's and a PEG under 1.0. The Price/Sales is fairly average for its industry, with a Return on Equity ahead 'of the pack'.
Finally, there are a bunch of shares out short that need to be covered giving the stock some additional support. The chart looks solid.
What is there not to like?
Now, if only I had a signal to be buying a new position, you can "bet your sweet bippy" that this is the kind of stock I would be buying!
But seriously, this is my kind of stock and deserves a third pick (!) on this blog.
If you have any comments or questions, please feel free to leave them right on the website or email me at bobsadviceforstocks@lycos.com. If you get a chance, be sure and visit my Covestor Page where you can track my actual trading portfolio, my SocialPicks Page where you can monitor my many stock picks, and my Podcast Page where you can download some mp3's of me discussing some of the many stocks I write about here on the blog.
I hope you all have a great week ahead!
Yours in investing,
Bob
Sunday, 1 June 2008
Graham (GHM) "Trading Transparency"
Hello Friends! Thanks so much for stopping by and visiting my blog, Stock Picks Bob's Advice! As always, please remember that I am an amateur investor, so please remember to consult with your professional investment advisers prior to making any investment decisions based on information on this website.
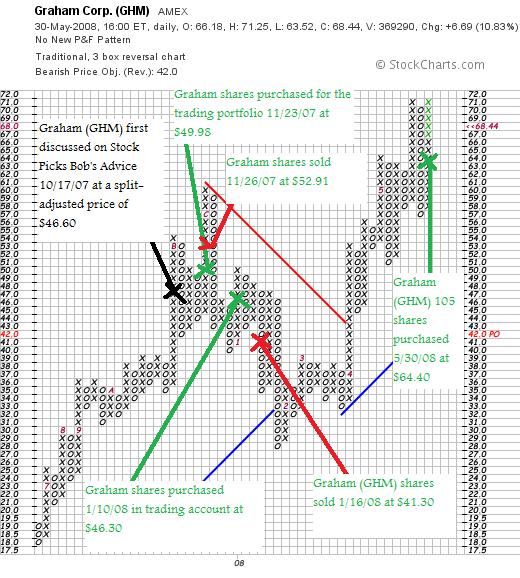
 I wrote Friday about my decision to make what I call a "lateral" move, selling my IHS stock (IHS) and buying 105 shares of Graham Corp. (GHM). Graham is actually an 'old friend' of mine having first written about Graham October 27, 2007, at a split-adjusted price of $46.60, on the suggestion of Doug S., a great and loyal reader of this blog.
I have also owned shares of Graham (GHM) for short periods of time (literally) having purchased 400 shares 11/23/07 at a split-adjusted cost of $49.98 and then selling those shares just 3 days later at split-adjusted price of $52.91. This was a "trade" and not exactly within my usual 'disciplined trading strategy'!
I purchased 210 shares once again 1/10/08 at $46.30, only to find myself losing money this time and unloading shares 1/16/08 when I found myself losing money and the stock trading at $41.30.
They say that 'third time is the charm'. So when looking for a stock to replace my IHS holding, I saw that GHM was on the move once more making the list of top % gainers and I purchased 105 shares at $64.40-- Graham (GHM) closed Friday at $68.44, up $6.69 or 10.83%.
Let's take another look at Graham (GHM) and I will explain why
GRAHAM (GHM) IS RATED A BUY
First of all, what exactly do they do?
According to the Yahoo "Profile" on Graham (GHM), the company
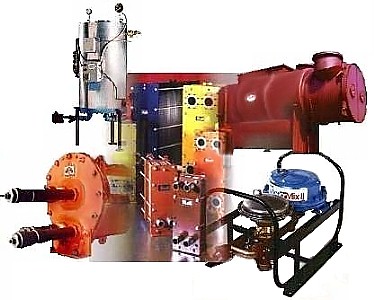 "...engages in the design, manufacture, and sale of vacuum and heat transfer equipment used in the chemical, petrochemical, petroleum refining, and power generating industries worldwide. Its products include steam jet ejector vacuum systems; surface condensers for steam turbines; vacuum pumps and compressors; various types of heat exchangers, including helical coil heat exchangers marketed under the Heliflow name; and plate and frame exchangers."
How did Graham (GHM) do in the Latest Quarter?
As is often the case in the stocks I review, it was the announcement of earnings, in this case 4th quarter 2008 results, that drove the stock higher on Friday. Before the opening of trading, the company reported that fourth quarter revenue grew $1.9 million or 9% to $22.8 million for the fourth quarter the prior year. Net income for the quarter came in at $4.2 million, up 22.7% compared to net income of $3.4 million during the same period last year. On a diluted per share basis this worked out to $.83/share, up 20.3% compared with $.69/diluted share the prior year same period.
The company noted that the backlog increased a healthy 40% to $75.7 million on March 31, 2008, compared with $54.2 million in backlog on March 31, 2007. The company guided the full year 2009 to a 15 to 20% revenue increase.
How about longer-term results?
Reviewing the Morningstar.com "5-Yr Restated" financials on Graham (GHM), we can see that after a dip in revenue from $44.5 million in 2003 to $37.5 million in 2004, the company has been steadily growing sales to $66 million in 2007 and $84 million in the trailing twelve months (TTM).
Likewise, earnings dipped from $0.00 in 2003 to a loss of $(.20)/share in 2004. Since then earnings have grown rather dramatically to $.10/share in 2005, $1.20/share in 2007 and $2.80/share in the TTM. The company also pays a small dividend which was increased from $.06/share in 2003 to $.08/share in 2004 and has held constant at that level. The outstanding shares, while small, are rather stable with 4 million share reported in 2003 increasing only to 5 million in the TTM.
Free cash flow which was a negative $(5) million in 2005, has increased to $4 million in 2007 and $17 million in the TTM.
The balance sheet appears solid with $3 million in cash and $48 million in other current assets. This total of $51 million can easily cover both the current assets of $16.8 million and the negligible $1.8 million in long-term liabilities almost 3 times over. The current ratio is calculated at a healthy 3.03.
What about some valuation numbers on this stock?
Reviewing some of the numbers on Yahoo "Key Statistics" on Graham (GHM), we can see that this company is a 'small cap' stock with a market cap of only $339.46 million.
The trailing p/e is a reasonable (imho) 23.99 with a forward p/e of only 17.96 (fye 31-Mar-09). No PEG is available (probably because there aren't any analysts out there estimating 5-yr results!).
Looking at a couple of value statistics from the Fidelity.com eresearch website, we can see that GHM has a Price/Sales figure of 3.97, well ahead of the industry average of 1.41. However, this premium in price/sales may be justified in light of the Return on Equity (TTM) figure of 39.16%, well ahead of the industry average of 22.26%.
Finishing up with Yahoo, we can get a feel for how small this company really is when we see that there are only 4.96 million shares outstanding and only 4.33 million of them actually float. As of 5/12/08 there were only 43,430 shares out short representing a very low 'short ratio' of only 0.3 days. This also represents only 0.9% of the float.
According to Yahoo, the company is now paying an increased dividend rate of $.12/share yielding 0.2%. The last stock split was a 5:4 stock split January 3, 2008.
What does the chart look like?
Reviewing the "point & figure" chart on Graham (GHM) from StockCharts.com, we can see the tremendous volatility with the stock moving strongly higher from $18/share in June, 2007, to a high of $61/share in December, 2007, only to plunge back to a low of $28 in January, 2008. The stock has moved strongly higher since January, 2008, to its recent price level at $68.44.
What do I think about this stock?
To summarize, I sold my IHS shares and discussed my rationale and have substituted Graham (GHM) a small cap stock that trades on the AMEX in its place. The company reported a great quarterly report Friday and the stock moved sharply higher. The valuation is reasonable and the company has a strong backlog of sales orders. Unfortunately, the stock is rather thinly traded with an average daily trading volume of only 211,588 shares. This may result in quite a bit of volatility as I have already experienced and may lead to me getting 'shaken out' of this position once again!
Thanks again for dropping by! If you have any comments or questions, please feel free to leave them on the blog or email me at bobsadviceforstocks@lycos.com. If you get a chance, be sure and visit my Covestor Page where my actual trading portfolio is monitored, or my SocialPicks Page where my many stock picks are monitored. If you get a chance, stop by and visit my Podcast Page where you can listen to some of the many stocks I write about discussed in a podcast format.
Wishing you all a great week ahead!
Yours in investing,
Bob
Friday, 30 May 2008
Revisiting iBonds!
Hello Friends! Thanks so much for stopping by and visiting my blog, Stock Picks Bob's Advice! As always, please remember that I am an amateur investor, so please remember to consult with your professional investment advisers prior to making any investment decisions based on information on this website.
A few days ago I discussed how I was looking into an iBond. So I visited my local Wells Fargo Bank and purchased a $5,000 bond for a long-term investment. And the more I thought about, the more I became perplexed about this new limit on individual savings bond purchases each year.
As reported by Chris Farrell on American Public Media "Marketplace":
"I think it's a terrible move. Here's the breakdown: Savers can now buy a total of $20,000 in U.S. savings bonds. That's $5,000 each of Series EE (the traditional savings bond) and Series I savings bonds (the inflation-indexed security you mentioned) online and another $5,000 each in paper. In sharp contrast, before the turn of the year individual savers could sock away a total of $120,000 in U.S. savings bonds.
The shift is even more significant than these dollar figures suggest. The change makes it that much harder for individual investors to hedge a substantial portion of their savings against the ravages of inflation over time. Yet many finance scholars advocate that inflation-indexed bonds should be the foundation of a long-term retirement portfolio. The big attraction for individuals of the inflation-indexed savings bonds is that savings compound tax deferred until the bonds are cashed in a 30 year period. Plus, you don't pay any commission to buy and sell savings bonds."
I just don't get it.
We are in a war in Iraq and Afghanistan. And it is costing us plenty.
As reported on March 9, 2008, from the Associated Press:
"In 2008, its sixth year, the war will cost approximately $12 billion a month, triple the "burn" rate of its earliest years, Nobel Prize-winning economist Joseph E. Stiglitz and co-author Linda J. Bilmes report in a new book.
Beyond 2008, working with "best-case" and "realistic-moderate" scenarios, they project the Iraq and Afghan wars, including long-term U.S. military occupations of those countries, will cost the U.S. budget between $1.7 trillion and $2.7 trillion — or more — by 2017."
I really don't get it.
On June 12, 1944, President Franklin D. Roosevelt had a 'fireside chat' with Americans and he spoke to us about the need to buy bonds to finance the war effort.
He stated:
 "And it goes almost without saying, too, that we must continue to provide our Government with the funds necessary for waging war not only by the payment of taxes- which, after all, is an obligation of American citizenship—but also by the purchase of war bonds- an act of free choice which every citizen has to make for himself under the guidance of his own conscience.
Whatever else any of us may be doing, the purchase of war bonds and stamps is something all of us can do and should do to help win the war.
I am happy to report tonight that it is something which nearly everyone seems to be doing. Although there are now approximately sixty-seven million persons who have or earn some form of income, eighty-one million persons or their children have already bought war bonds. They have bought more than six hundred million individual bonds. Their purchases have totaled more than thirty-two billion dollars. These are the purchases of individual men, women, and children. Anyone who would have said this was possible a few years ago would have been put down as a starry-eyed visionary. But of such visions is the stuff of America fashioned."
But I am not really surprised. Shortly after 9/11, President Bush delivered a speech designed to rally the nation behind the war effort. But he didn't really ask for much sacrifice or the purchase of war bonds like FDR. Instead, he called on the American Consumer to....yes...go shopping!
He stated:
"After all that has just passed, all the lives taken and all the possibilities and hopes that died with them, it is natural to wonder if America's future is one of fear� Americans are asking, 'What is expected of us?'"
He then answered his own rhetorical question with a line Americans wanted to hear.
"I ask you to live your lives and hug your children."
He could have stopped there — a gem of a line, a Hallmark-card-sized summation of the littlest and best things we can do — but when American shores are smoldering still, Bush must have realized that more couldn't hurt. Be calm, not scared; be tolerant, not blind; be generous, not selfish; be patient, patient, patient, at airports and skyscrapers and landmarks and hotels and traffic stops and bus stops and train stations and anywhere else it is possible to imagine a public vulnerability, which of course is everywhere.
And for God's sake keep shopping — "I ask your continued participation and confidence in the American economy" — and keep praying:
"And finally, please continue praying for the victims of terror and their families, for those in uniform and for our great country. Prayer has comforted us in sorrow and will help strengthen us for the journey ahead."
For God's sake keep shopping? Is that the best he could do?
The Brookings Institute carried a comment about the effect of foreign ownership of debt:
"Many observers are asking whether U.S. indebtedness to foreigners might pose any subtle hidden threats to the U.S. economy or even to U.S. national security. With China alone holding $1.2 trillion in reserve assets and foreigners collectively holding more than twice that in U.S. Treasury securities, is there any risk that the United States might be subject to economic blackmail? What about the rapid proliferation of so-called sovereign wealth management funds, most famously China's $3 billion investment in the private equity group Blackstone? Sovereign wealth funds now control nearly $2 trillion in assets, more than stand-alone hedge funds. Is there a risk that foreign governments will use their financial relationships to compromise U.S. security? Is there any danger of exotic "Goldfinger"-like scenarios where foreign governments might use their massive leverage to precipitate a wholesale financial collapse in the United States? The short answer is these more extreme risks are unlikely to materialize, but the United States continued dependence on foreign borrowing is a significant vulnerability in the event of shock, such as a collapse in U.S. housing prices, or an extreme national security breach, that might slow the inflow of new funds into the United States."
So how does the Treasury Department explain the new rules as of January, 2008, that reduced the maximum annual purchase of savings bonds from $120,000 to $20,000 per individual? Is there not enough debt to go around? Do we need to ration the opportunity of Americans to invest in their own government? Is the concept of Americans buying Savings Bonds in the time of war obsolete, or to quote Alberto Gonzales, "quaint"?
The budget deficit problem is not improving.
In fact, our deficits are actually growing as the economy slows. As reported on February 12, 2008:
"(AP) The federal budget deficit is running at a pace that is more than double last year's imbalance through the first four months of the budget year.
In its monthly review of the government's finances, the Treasury Department said Tuesday that the budget was in surplus in January, but totals $87.7 billion so far this budget year, double the $42.2 billion imbalance recorded during the same period in 2007. The new budget year started last Oct. 1.
The Bush administration sent its final budget request to Congress last week, projecting that the deficit for all of 2008 will total $410 billion, very close to the all-time high in dollar terms of $413 billion in 2004.
So far this year, federal spending is 8.3 percent ahead of last year's pace, at $949.1 billion. That is far ahead of the 3.2 percent increase in revenues, which have totaled $861.4 billion in the current budget year."
So I guess they aren't cutting back on the purchases of Savings Bonds and iBonds by individuals because there isn't any debt that needs to be funded.
So what is the explanation given?
Here is the Treasury Department explanation given on December 3, 2007:
"The annual limitation on purchases of United States Savings Bonds will be set at $5,000 per Social Security Number, effective January 1, 2008. The limit applies separately to Series EE and Series I savings bonds, and separately to bonds issued in paper or electronic form. Under the new rules, an individual can buy a maximum of $5,000 worth of electronic and paper bonds of each series in a single calendar year, or a total of $20,000, in single ownership form. If paper bonds are issued in co-ownership form, the limit applies to the first-named co-owner. All limits are based on the issue price of the securities.
The reduction from the $30,000 annual limit in effect for both series since 2003 was made to refocus the savings bond program on its original purpose of making these non-marketable Treasury securities available to individuals with relatively small sums to invest. Approximately 98 percent of all annual purchases of savings bonds by individuals are for $5,000 or less. The minimum purchase price for Series EE bonds is $25, whether purchased electronically or in paper form; the I bond minimum purchase is $25 for bonds issued in electronic form and $50 for those in paper form.
Savings bond purchases have been subject to an annual limit since Series E Bonds were first issued in 1941. Over the years, limits have been adjusted by the Treasury Department several times and have ranged from a low of $3,750 (at issue price) for Series E bonds from 1941 through 1947 to the $30,000 (issue price) limit that most recently applied to both Series EE and Series I bonds. The limit was last set at $5,000 (issue price) in 1973."
So in their words, the reason they are reducing the ability of Americans, in time of war, to buy savings bonds is because they wanted "to refocus the savings bond program on its original purpose of making these non-marketable Treasury securities available to individuals with relatively small sums to invest."
O.K. I still don't get it. The government would somehow rather borrow from foreign governments and foreign investors than sell savings bonds to individuals.
Is this what patriotism is all about?
Maybe I am missing the point, but I somehow like the old FDR approach of asking Americans to sacrifice and to buy savings bonds so that we all together can share in this effort. For this Administration, it has been a better approach to sacrifice by 'going shopping'. Or better yet, this President has sacrificed in this war effort by 'giving up golf.'
And I just wanted to buy more than one savings bond.
Yours in investing,
Bob
Posted by bobsadviceforstocks at 11:37 PM CDT
|
Post Comment |
Permalink
Updated: Friday, 30 May 2008 11:41 PM CDT
IHS (IHS) "Trading Transparency"
Hello Friends! Thanks so much for stopping by and visiting my blog, Stock Picks Bob's Advice! As always, please remember that I am an amateur investor, so please remember to consult with your professional investment advisers prior to making any investment decisions based on information on this website.
 A few moments ago I sold my 140 shares of IHS (IHS) that I had puchased 10/1/07 with a cost basis of $58.53. These shares were sold at $59.29 for a gain of $.76 or 1.3% since purchase.
This sale doesn't really fit into my usual 'trading rules'. But I always retain the right :) to arbitrarily 'pull the plug' on any of my holdings. Perhaps it is because my portfolio is so small at 6 positions now--or I am just anxious to keep up with my Covestor results where I am just staying ahead of the S&P--but in any case, with the market basically moving higher and IHS acting rather weak the last few days, I decided to move on.
Since I am not really selling the stock on 'bad news', except my own perceived assessment of the stock's prospects, and this isn't really 'good news' either, I consider this more or less a lateral in football terms.
But before I get to what I decided to 'do' with the proceeds (I bought some shares of Graham (GHM)), let me share with you some of my thoughts on IHS and why I switched from being a holder of shares to a seller of shares and why now
IHS (IHS) IS RATED A SELL
First of all, as I write, the Dow is trading at 12,672.35 up 26.13 and the Nasdaq is at 2,527.93. And IHS? IHS is at $59.22, down $(1.79) or (2.93)% on the day.
Looking through the news on IHS, I came across a story from TheStreet.com which recently was published (5/23/08). They remarked on several different stocks. On IHS they had this to say:
"IHS (IHS - Cramer's Take - Stockpickr), which provides critical information, decision-support tools and related services to the energy, defense, aerospace, construction, electronics and automotive industries, has been downgraded to hold. Strengths such as robust revenue growth, a solid financial position and EPS improvement are weighed down by disappointing return on equity. For the first quarter, revenue increased 30% year over year to $198.8 million, and earnings per share rose to 34 cents from 32 cents. Regardless of the somewhat mixed results with the debt-to-equity ratio, the company's quick ratio of 0.83 is weak. The company's gross profit margin is rather high at 55%. Its net profit margin of 11% compares favorably to the industry average. The company's current return on equity has slightly decreased from the same quarter one year prior and lags the industry average. Shares have risen 61% in the past year, beating the S&P 500. The gains have netted the stock a price-to-earnings ratio of 44.68, which places it at a premium to others in its industry. IHS had been rated buy since May 13."
The "quick ratio" is a bit different than the "current ratio" which we usually examine. As it is defined:
"A measure of a company's liquidity and ability to meet its obligations. Quick ratio, often referred to as acid-test ratio, is obtained by subtracting inventories from current assets and then dividing by current liabilities. Quick ratio is viewed as a sign of company's financial strength or weakness (higher number means stronger, lower number means weaker). For example, if current assets equal $15,000,000, current inventory equals $6,000,000, and current liabilities equal $3,000,000, then quick ratio amounts to: ($15,000,000 - $6,000,000)/$3,000,000 = 3. Since we subtracted current inventory, it means that for every dollar of current liabilities there are three dollars of easily convertible assets. In general, a quick ratioof 1 or more is accepted by most creditors; however, quick ratios vary greatly from industry to industry."
Even so, the current ratio, with a total of $406 million in total current assets compared to the current liabilities of $400.2 million, is also just above 1.0, suggesting some financial 'stress' as well imho. These figures are from the Morningstar.com "5-Yr Restated" financials page which otherwise doesn't look too shabby.
Mark Hulbert recently wrote on Forbes.com about the utility of insider trading as an indicator. He wasn't very impressed with the results:
"A recent academic study1 by professors Josef Lakonishok and Inmoo Lee provides an answer. The professors discovered that while stocks being bought by insiders proceed to modestly outperform the market, so do stocks sold by the insiders. Overall, therefore, there is not much of a performance differential between the stocks insiders are buying and the stocks they are selling."
In any case, IHS recently had a significant sale by a director which was reported on April 24, 2008, when it was noted that Director Steven A. Denning sold 744,501 shares of stock at $65.05. In itself it may not be enough to change my mind, but as a piece of a puzzle, it may be worthwhile to consider. This had followed a sale reported on April 2, 2008, as reported, of Co-President, Co-COO Jeffrey R. Tarr selling 4,573 shares of common stock at $65.84/share. That particular sale was under what is called a 10b5-1 trading plan which is a plan that allows pre-arranged sales regardless of nonpublic information they may possess. However, that sale also followed a sale April 1, 2008, by Executive Vice-President Daniel Yergin who dropped 10,00 of his shares between $66 to $69 apiece.
Going through the news we can see that Jeffrey D. Sisson sold 5,273 shares March 28, 2008, also through a pre-arranged 10b5-1 trading plan, John Oechsle, also through one of these same plans sold 3,000 shares March 28, 2008, CFO Michael Sullivan exercised options for 5,000 shares under the same plan and sold them on March 28, 2008, Yergin reported March 28, 2008, selling another 18,403 shares, Senior Vice-President Stephen Green sold 6,600 shares as reported the same date under the same program, and IHS Co-COO Rohinton Mobed reported selling 10,980 shares of common stock in an announcement on March 28, 2008.
It is really appropriate to exercise caution before concluding anything about these sales. Many executives have stock options as really part of their employment package and sell stock regularly to fill their own financial planning requirements. But all of these sales do give you pause, don't you think?
On a positive note, after the company's last quarterly report, they did indeed raise guidance on full-year sales to a growth of 21 to 23% from the prior guidance of growth of 18 to 20% year over year.
Ironically, the 1st quarter 2008 results announced on March 19, 2008, did beat expectations on both earnings and revenue. So not all of the news is negative on this company.
Finally, looking at the price chart, I am not encouraged by the apparent ongoing technical weakness. As presented by StockCharts.com with a 'point and figure' chart on IHS:
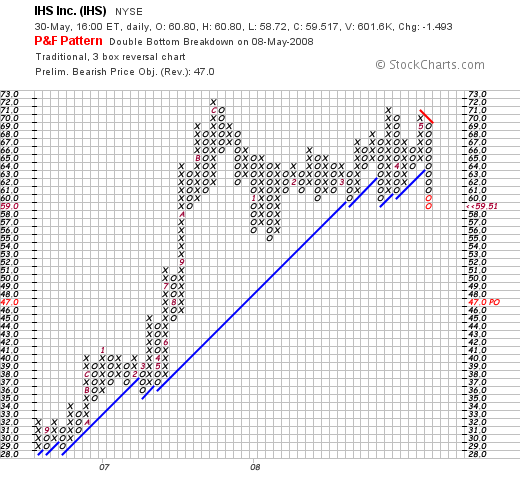
So today, with the stock weak while most other stocks climbed, I looked at the chart, thought about the financial questions raised, noted the insider selling activity (although most of that was fairly routine) and decided to 'move on'.
Wish me luck. I do think I need to do these types of relatively conservative 'laterals' from time to time.
Thanks again for visiting! If you have any comments or questions, please feel free to leave them on the blog or email me at bobsadviceforsocks@lycos.com.
Yours in investing,
Bob
Posted by bobsadviceforstocks at 9:33 AM CDT
|
Post Comment |
Permalink
Updated: Friday, 30 May 2008 1:28 PM CDT
Thursday, 29 May 2008
Visa (V) "Trading Transparency"
Hello Friends! Thanks so much for stopping by and visiting my blog Stock Picks Bob's Advice! As always, please remember that I am an amateur investor, so please remember to consult with your professional investment advisers prior to making any investment decisions based on information on this website.
 Earlier today I sold a portion of my Copart (CPRT) stock after it hit my first assigned appreciation target--that is it had increased in price to a 30% appreciation over my purchase cost. With that event, I sold 1/7th of my holding (and wrote about it on my blog as well). My own portfolio management strategy depends on the performance of my own stocks to give me the 'signals' to be either buying (on good news events like sales on appreciation) or 'sitting on my hands' which happened yesterday on a bad news event like a sale on a decrease in the stock price as I experienced with my ResMed holding.
The other part of my portfolio management strategy involves dealing with sales at the extremes of my portfolio size. For me, my minimum number of holdings is five and my maximum is twenty. I try to 'float' my portfolio between these two extremes based on the activity of my own stocks. In this case, sitting at five positions, my minimum, the sale of a portion of Copart (CPRT) gave me a signal or 'permission slip' as I sometimes write, to be looking for a new stock to buy. And thus, as I have written before, with that nickel burning a hole in my pocket, I set out to find a new stock to purchase.
Checking the list of top % gainers on the NYSE earlier today, I saw that Visa (V) had made the list. However, the other stocks moved higher and V sold off a bit, so by the end of the day it was no longer on the top % gainers. However, by that time I had already purchased 70 shares at $85.92 for my trading account. Visa (V) closed at $85.25 up $3.33 or 4.06% on the day.
Let's take a closer look at this stock and I will try to explain why I purchased shares and why
VISA (V) IS RATED A BUY
First of all, according to the Yahoo "Profile" on Visa (V), the company
 "...through its subsidiaries, operates retail electronic payments network worldwide. It facilitates commerce through the transfer of value and information among financial institutions, merchants, consumers, businesses, and government entities in approximately 170 countries and territories."
And how did it do the latest quarter?
On April 28, 2008, Visa (V) reported strong 2nd quarter 2008 results. Revenue and net income rose strongly with net income climbing 28%. The company beat expectations coming in with adjusted earnings of $.52/share ahead of Thomson Reuters' consensus of $.46/share. Revenue climbed to $1.5 billion ahead of expectations of $1.45 billion.
The stock actually dipped on this report since it is a relatively recent IPO, having come public on March 18, 2008, and having climbed sharply from the $44/share level with a 66% increase at the time of the earnings announcement.
Looking longer-term at the Morningstar.com '5-Yr Restated' financials page, we can see a steady increase in revenue from $1.98 billion in 2003 to $3.59 billion in 2007 and $4.8 billion in the trailing twelve months (TTM). There has been an increase from 1.02 billion shares in 2007 to 1.53 billion in the TTM. I assume this is related to the recent public offering of shares.
The free cash flow numbers suggest a one-time dip in free cash flow with $8 million in 2007 dipping to a negative $(20.9) billion in the trailing twelve months. Quite frankly, I didn't pay a lot of attention to this figure at the time of purchase (?). I don't think it is a problem, but would wait for updated Morningstar.com figures as things progress.
The balance sheet is solid with $10 billion in cash and other current assets vs. the $(5.8) billion in current liabilities.
Let's take a brief look at the 'point & figure' chart on V from StockCharts.com:
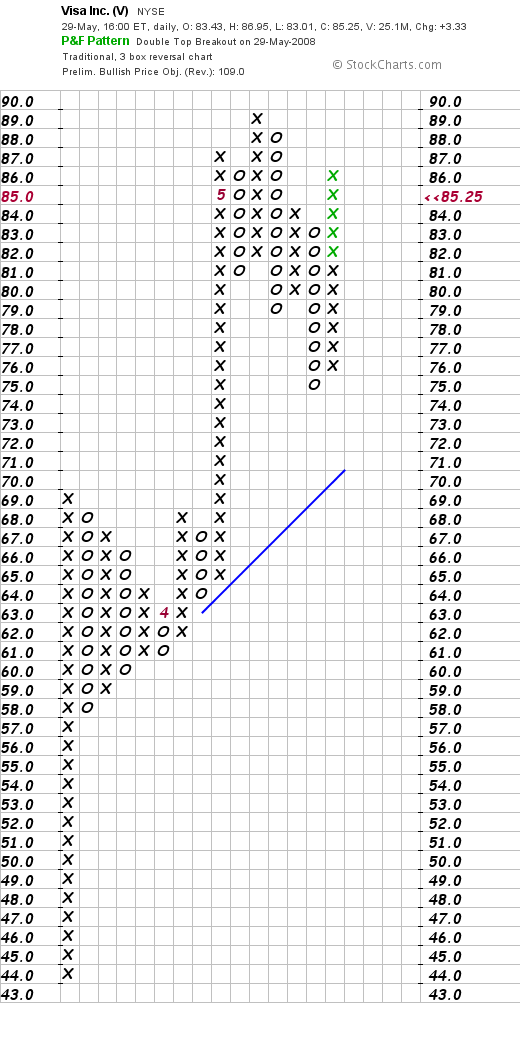
We can certainly see the incredible price momentum on this stock.
So while the Morningstar.com page is a bit incomplete from my perspective, the recent quarter was strong, I am well familiar with this particular franchise :), and the chart looks great.
Anyhow, I added it to my portfolio---so now I have a 'financial' stock that appears to be moving strongly higher.
Thanks so much for stopping by and visiting! If you have any comments or questions, please feel free to leave them on the blog or email me at bobsadviceforstocks@lycos.com.
Yours in investing,
Bob
Copart (CPRT) "Trading Transparency"
Hello Friends! Thanks so much for stopping by and visiting my blog, Stock Picks Bob's Advice! As always, please remember that I am an amateur investor, so please remember to consult with your professional investment advisers prior to making any investment decisions based on information on this website.
 Earlier this morning, my Copart (CPRT) stock hit an appreciation target of a 30% gain triggering a partial sale of 1/7th of my position or 30 shares which were sold at $43.80/share. This represented a gain of $10.08/share or 29.9% since purchase. The shares were initially acquired 9/27/07 at a cost basis of $33.72/share.
As you may know, I use sales like today's sale as a 'signal' to buy an additional position if I am under my maximum of 20 positions. Since, after yesterday's sale of ResMed (RMD), I am at my minimum of 5 positions, well under my maximum, this sale indeed did give me a 'permission slip' to be buying a new position.
A few moments ago I purchased 70 shares of Visa (V) as that new position. I shall be writing this up a little later.
Even though I have sold shares of Copart (CPRT), with the company's solid second quarter results (even though they did miss expectations) and their strong Morningstar.com '5-Yr Restated' financials,
COPART (CPRT) IS RATED A BUY
When would I sell shares next and how many? Well on the upside, my next sale point would be at a 60% appreciation target which with the cost basis being at $33.42, this would work out to 1.6 x $33.42 = $53.47. At that time, my plan would be to sell 1/7th of the remaining shares which now at 180 shares would be 180/7 = 25 shares.
On the downside, after a single sale (at the 30% appreciation level) I move my sale point up from an (8)% loss to break-even, or in this case would mean selling all of my remaining 180 shares if the stock should decline to $33.42.
Thanks again for stopping by! If you have any comments or questions, please feel free to leave them on the blog or email me at bobsadviceforstocks@lycos.com.
Bob
Wednesday, 28 May 2008
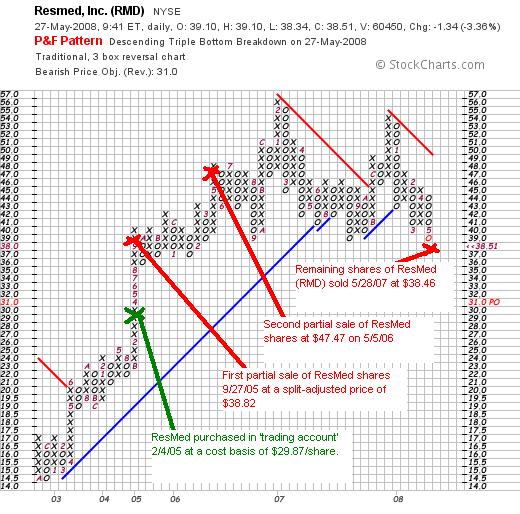
ResMed (RMD) "Trading Transparency"
Hello Friends! Thanks so much for stopping by and visiting my blog, Stock Picks Bob's Advice! As always, please remember that I am an amateur investor, so please remember to consult with your professional investment advisers prior to making any investment decisions based on information on this website.
 A few moments ago I sold all of my shares of ResMed (RMD), which amounted to 150 shares, at $38.46. These shares were purchased 2/4/05 at a cost basis of $29.87 giving me a long-term gain of $8.59 or 28.8% on these shares.
This sale brings me down to my 'minimum' portfolio size of 5 positions. I have set my maximum at 20 positions and my minimum at 5. What this means is that with this sale, as before, since it is on 'bad news', which means selling on a defensive basis as part of a decline, I shall be 'sitting on my hands' with the proceeds. That is, I shall not be replacing this position.
However, since I am now at 5 positions, if any of these are sold on 'bad news' I shall be looking for new stocks to replace them. I hope you follow this 'strategy'.
I would also like to explain the why of my sale.
Basically after my initial purchase of ResMed (RMD), I had two partial sales at appreciation targets--at 30% and 60% appreciation levels. My approach to stocks requires me to sell stocks if they decline to certain levels. After an initial purchase, I sell a stock if it declines to an (8)% loss. After a single sale at my first appreciation target (30%), I sell if a stock declines--slips back--to 'break-even'. With additional sales, my sell-point is increased to 50% of the highest appreciation sale. With ResMed having been sold partially at a 60% appreciation level, this means that when the stock dropped to under a 30% appreciation level I was given the 'signal' to sell the stock.
Actually, the stock was 'flirting' with a sale yesterday as it bounced at that 30% appreciation level under and over. I hoped it wouldn't break through but with today's market weakness, ResMed dipped and I sold shares.
Even though I still 'like' the stock from the good 3rd quarter report and the decent Morningstar.com '5-Yr Restated' financials, with my own sale, the best I can do:
RESMED (RMD) IS RATED A HOLD
If we look at the ResMed "point & figure" chart from StockCharts.com, we can see the technical weakness with the stock, after peaking at $56 in February, 2007, has struggled to move higher, failing to make a new high in December, 2007, when it reached $54, and then breaking through support currently.
This isn't about 'liking' a stock. I like ResMed a lot. But my trading system required me to part company with the shares. Successful trading is about some sort of discipline and I try hard to depend on my own trading rules to succeed. I hope that I shall be a shareholder in this stock in the future, but for now.....
Thanks again for stopping by and visiting! If you have any comments or questions, please feel free to leave them on the blog or email me at bobsadviceforstocks@lycos.com. If you get a chance, visit my Covestor Page where my trading account is tracked, my SocialPicks page where all of my stock picks for the last year-and-a-half have been monitored, and my podcast page where you can download some mp3's and listen to me discuss a few of the many stocks I write about here on the website.
Yours in investing,
Bob
Friday, 23 May 2008
Natus Medical (BABY)
Hello Friends! Thanks so much for stopping by and visiting my blog, Stock Picks Bob's Advice! As always, please remember that I am an amateur investor, so please remember to consult with your professional investment advisers prior to making any investment decisions based on information on this website.
 Earlier today, while looking through the list of top % gainers on the NASDAQ, I came across a stock I would like to briefly share with you, Natus (BABY), which closed at $21.02, up $1.35 or 6.86% on the day. I do not have any shares nor do I have any options on this stock. In fact, as the trading day finished up, Natus was no longer on the top % gainers list, but did close with a nice gain, and I think deserves a spot on this blog.
I will try to briefly explain why,
NATUS (BABY) IS RATED A BUY
First of all, on what the company does. According to the Yahoo "Profile" on Natus, the company
 "...develops, manufactures, and markets neurondiagnostic and newborn care products to healthcare professionals worldwide. It provides healthcare products used for the screening, detection, treatment, monitoring, and tracking of common medical ailments, such as hearing impairment, neurological dysfunction, epilepsy, sleep disorders, and certain newborn conditions."
Insofar as the latest quarter, the company announced 1st quarter 2008 results on May 1, 2007. Revenue climbed 36% to $36.9 million from $27.1 million. Net income was up 73% to $2.6 million or $.11/share compared to net income of $1.5 million or $.07/share the prior year same period. In addition to this great result, the company also raised guidance for the full year 2008 from $160 million in revenue to $161 to $162 million and earnings were also guided higher from $.68 to $.70 to the new guidance of $.70 to $.72/share.
Longer-term, checking the Morningstar.com "5-Yr Restated" financials on BABY, we can see the steady rise in revenue from $31 million in 2003 to $118 million in 2007 and $128 million in the trailing twelve months (TTM). Earnings have been a bit erratic, as is not uncommon in these small companies, but has improved from a loss of $(.05)/share in 2006 to a profit of $.43/share in 2007 and $.47/share in the TTM.
Outstanding shares have grown somewhat from 16 million in 2003 to 23 million in the TTM. Free cash flow, which dipped from $7 million in 2005 to $1 million in 2006, has improved to $9 million in 2007 and $10 million in the TTM.
The balance sheet appears solid with $13.0 million in cash and $55 million in other current assets balanced against a current liabilities of $45.6 million. This yields a current ratio of somewhere around 1.5. the company has an additional $25.2 million in long-term liabilities on the book.
Reviewing the Yahoo "Key Statistics" on Natus (BABY), the market cap is a small cap $481.72 million with a trailing p/e of 44.16. The forward p/e (fye 31-Dec-09) is estimated at 24.44. Thus, with the rapid growth in earnings the PEG works out (5 yr expected) to an acceptable 1.11 level.
There are 22.92 million shares outstanding and 22.5 million that float. Currently as of 4/25/08, there are 2.3 million shares out short representing a short ratio of 16.7. This is well ahead of my own cut-off of 3 days for short interest significance. We may well have seen a bit of a squeeze of the shorts today in an otherwise negative market environment. No dividend is paid and no stock splits are reported.
Let's take a brief look at the 'point & figure' chart on BABY from StockCharts.com:
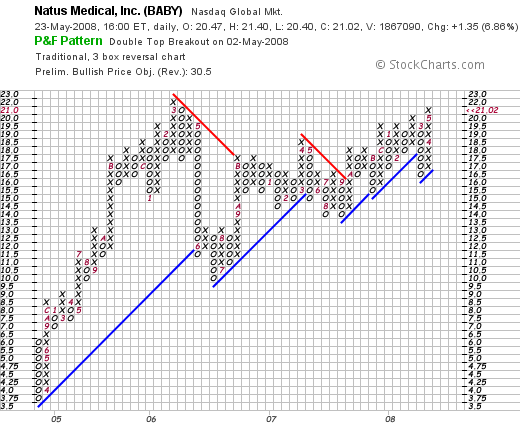
Here we can see the relatively meteoric rise in the stock price from March, 2004, to March, 2006, from $3.75/share to $22/share. Since that $22 peark, the stock has been consolidating and only in the last few days has it been moving to break through that level towards a higher price. The chart looks strong to me in my humble opinion!
Insofar as other news or comment I have been able to find, you should know that Natus has filed for a public offering of 4 million sharees at $19.50 apiece. The market has certainly taken that announcement in stride.
Natus is also a favorite over at TheStreet.com, where they recently commented:
"Natus has been rated a buy since June 2007. For the first quarter of fiscal 2008, Natus reported a 36% revenue increase year over year. The company also reported that its earnings per share improved from 7 cents a year ago to 11 cents in the most recent quarter. Over the same period, net income rose to $2.63 million from $1.52 million. First-quarter results were led by strong sales of newborn hearing-screening products. Additionally, the company completed its integration of Excel-Tech ahead of schedule, and recently announced an agreement to acquire Sonamed, a manufacturer of hearing-screening products.
Looking ahead, Natus increased its revenue and earnings guidance for fiscal 2008 and now anticipates revenue to range from $161 million to $162 million. Earnings per share are expected to be in the range of 70 cents to 72 cents for the full year, while guidance for the second quarter anticipates EPS in the range of 14 cents to 15 cents. This guidance does not include the potential impact of the Sonamed acquisition, which is expected to close by the end of May 2008. Bear in mind that the stock has surged 35% over the last year and is now trading at a price that is somewhat expensive when compared to the rest of the industry. We do, however, feel that the company does not currently have any significant weaknesses and that its strengths justify the higher stock price levels."
Also today, the Motley Fool commented on the Natus move as one of its "five-star stocks" doing well in the market.
And Thomas Sidwell wrote about Natus as one of the "6 Medical Device Makers Poised for Growth" over on Seeking Alpha. Donald Johnson also had a piece on Seeking Alpha on May 12th about Natus. He wrote:
"Like a lot of momentum stocks, BABY's already pretty expensive as these key statistics show. The forward PE is 24, the trailing 12 months PE is 44, the not too reliable PEG ratio is a cheap 1.12 and, the price sales ratio is 3.52, according to data on Yahoo.com. The price per share to cash flow is a very high 43.7, according to Morningstar.com, which doesn't rank the stock. IBD (investors.com) gives the stock a very high composite rating of 95, which is based on the company's earnings per share growth rate, profitability, sales growth and buying by institutions. BABY's point and figure chart shows a bullish price objective of $30.50. Thus, BABY is making the most of the baby boom, much as Pediatrix (PDX) is, even if that baby boom may be slowing."
I suppose I may be a little late to the party, but the water is fine and I shall jump right in :). At least on the blog, as I do not own any shares!
Thanks again for visiting! If you have any comments or questions, please feel free to leave them on the blog or email me at bobsadviceforstocks@lycos.com. Have a great Memorial Day Weekend everyone!
Yours in investing,
Bob
Posted by bobsadviceforstocks at 5:56 PM CDT
|
Post Comment |
Permalink
Updated: Friday, 23 May 2008 5:57 PM CDT
Thursday, 22 May 2008
A Reader Writes "...what is the significance of the 'short interest'?"
Hello Friends! Thanks so much for stopping by and visiting my blog, Stock Picks Bob's Advice! As always, please remember that I am an amateur investor, so please remember to consult with your professional investment advisers prior to making any investment decisions based on information on this website.
 One of my favorite activities as author of this blog is to receive, read, and respond to email and comments regarding investing. I hope through these discussions that I have helped others understand investing concepts as much as I learn from these questions as well.
Earlier today I received a nice letter from Randy S. who commented:
"hi,
what a great blog. I just found it last week. I'm trying to learning more about stock analysis and had a question about BLUD
"Going back to Yahoo for a few more numbers on this stock, we can see that there are 44.43 million shares outstanding with 43.88 million of them that float. Currently there are 1.72 million shares out short representing 5.7 trading days of volume. Using my own "3 day rule" on short interest, this looks significant and may well be adding to the buying pressure driving this stock higher. It does look like the short-sellers may be throwing in the towel on this company, for the prior month, the short interest was at 1.93 million shares."
I know I'm looking at today's yahoo statistics which have changed since your article but can you tell me where on the Stats page you found these numbers (44.43, 43.88, 1.72, 1.93), and how did you calc the 5.7 trading days volume?
And what is the signifance of the "short interest"?
i understand shorting but didn't understand the significance of the 5.7 days and how it effects buying pressure.
thanks very much!
randy"
First of all, I am glad that you 'found' my blog, found an entry that you found useful, and ended up asking some very good questions about what I wrote.
Let me try to go through to give you some answers in a bit more detail regarding your inquiry. First of all, you commented on my entry on Immucor (BLUD) dated April 6, 2006. On April 2, 2008, I 'revisited Immucor (BLUD) on this blog and updated some of the 'facts' behind my interest in this company. I do not own any shares nor do I have any options on this stock.
You asked about where I got the numbers on Immucor regarding outstanding shares, number that float, number of shares out short, and the number of shares out short the prior month. Let me try to direct you directly to the source of that information.
I am not sure whether or not you are familiar with Yahoo "Finance" or not. (I am assuming that you understand the use of hyperlinks. These are the 'links' on my blog and other websites that are often in another color--I use red--other links are in blue--and are underlined to indicate their status. When you take your mouse and 'click' on these words, you will be directed to another website with the information I am choosing to present. To get back to the original website, you just needed to click on the 'back' button or left-pointing arrow on the top of your browser.)
If we enter "BLUD" into the "GET QUOTES" box on Yahoo "Finance" we will arrive to this page. This is the "Summary" page for BLUD, which we can see closed today (5/22/08) at $25.70, up $.32 or 1.26% on the day.
For the numbers I refer to we need to examine the "Key Statistics" page which is found under the sub-section entitled "Company", just under the "Profile" for BLUD.
This page gives us two columns of data on BLUD. Under the "Share Statistics" section in the right hand column, you will see both the "Shares Outstanding" which currently is listed as 70.04 million shares and the "Float" which is currently at 68.97 million shares.
Shares outstanding is defined as
"The shares of a corporation's stock that have been issued and are in the hands of the public. also called outstanding stock."
There is a difference in the outstanding shares and the "float" because sometimes some shares are not available to the public. These may be shares that are 'closely held' and not traded by the original owners of the company.
As the definition of "float" explains:
"The number of shares of a security available for trading by the public. A company can have 20 million shares outstanding and only 7 million float. A stock with low-float means there is a limited supply of shares, which can often make a stock more volatile."
You also asked about the "Shares Short" which is also found under the right column on "Key Statistics" under the "Share Statistics" heading. Today, BLUD has 6.02 million shares out short. In the same section, there is a note that the "Shares Short (prior month)" amounted to 6.63 million shares out short. Thus, we can deduce that some of the short-sellers (about 600,000 shares worth) have "covered" their shorts by buying the shares.
Let's take a look at the definition of "short covering":
"The purchase of securities to close out a short stock position. To close a position, an option investor purchases the same number of shares that were sold short. If the price of the shares being purchased is below the price of the shares that were shorted, a profit could be realized (depending on trading fees)."
Of course, we need to understand the entire concept of 'short-selling'. These are sales that go in the opposite order of the usual purchase of stock---what I generally do---which involves first buying shares of stock, hopefully seeing the stock rise in price, and then selling the shares later for a profit.
The short-seller, expecting the stock to decline, literally does this backwards! He borrows shares of stock (promising to return the shares later) from another brokerage account (with the assistance of the broker), and then sells the shares. If the stock shares actually do decline, as he/she suspects, then the short-seller can actually purchase the shares to 'return them' and if the stock has declined, can pocked the difference as a profit. Going "short" is the opposite of going "long."
You asked about the "5.7 trading days of volume" as the amount of shares out short and where I got that figure. This number is the same as the "Short Ratio", which now amounts to 12.9 trading days of volume. This statistic is also found on the "Key Statistics" page under the "Share Statistics" section in the right column of each of these pages on Yahoo.
As explained about the Short Ratio, this is formally defined:
"Short interest divided by average daily volume over some period, usually 30 days. Some investors believe that a high ratio is a bullish indicator, and a low ratio is a bearish indicator."
The definition above suggests the effects of a large "short ratio". I have personally chosen to suggest that greater than three days is significant. That number is actually my own creation. Other people might have other criteria to decide when a level is sufficiently high to be significant.
Let me try to explain why this might be an important statistic. Assuming that there is a large "short ratio" on a stock--that is that a lot of shares have been sold "short" with speculators believing the stock is going to drop in price--and if in this situation something really good is announced. For instance a contract is awarded, or an earnings report exceeds expectations and the company raises guidance or whatever. Then the stock might start rising in price as other investors decide that the prospects for the company are terrific and they too want to own shares.
The short-sellers are thus under pressure in this situation. For as a stock rises in price, instead of making money if like you or I if we are going "long" on a stock, they are instead watching their losses pile up. You see everything is upside-down and sort of topsy-turvy in a short-sellers perspective.
In fact, we could even see a bit of a 'panic' known as a short squeeze if this should happen as short-sellers scramble to buy back shares that they previously borrowed and sold to limit their losses. Of course a rising stock price is a disaster for a seller who as already borrowed shares, sold them, and then was waiting for the shares to decline in price so that he/she could profit the difference!
Let me give you the formal definition of 'short squeeze':
"A situation in which the price of the stock rises and investors who sold short rush to buy it to cover their short position and cut their losses. As the price of the stock increases, more short sellers feel compelled to cover their positions. More common than the opposite, long squeeze."
So as part of my process of looking at some of the facts and figures behind a stock, I like to know what the short interest level is related to the average trading volume each day in the stock.
I hope that this discussion was helpful! If you have other questions, please feel free to leave them on the blog or email me at bobsadviceforstocks@lycos.com. If you get a chance, be sure and visit my Covestor Page where my actual trading account is reviewed, my SocialPicks page where my stock selections from my blog are monitored, and my Podcast Page where you can download some mp3's of me discussing some of the many stocks and topics I cover here on this website.
Wishing you all a good Memorial Day Weekend!
Yours in investing,
Bob
Posted by bobsadviceforstocks at 4:49 PM CDT
|
Post Comment |
Permalink
Updated: Thursday, 22 May 2008 8:34 PM CDT
Tuesday, 20 May 2008
Thinking About Buying an iBond!
Hello Friends! Thanks so much for stopping by and visiting my blog, Stock Picks Bob's Advice! As always, please remember that I am an amateur investor, so please remember to consult with your professional investment advisers prior to making any investment decisions based on information on this website.
Is inflation rearing its ugly head?
As reported this morning:
The department's Producer Price Index, which measures inflation pressures before they reach the consumer, rose 0.2 pct in April following a 1.1 increase in March.
Core inflation rose 0.4 pct for the month, after rising 0.2 pct in March. That left core inflation up 3.0 pct in the past twelve months, the largest change since December 1991. Overall inflation has risen an unadjusted 6.5 pct for the year.
Economists polled by Thomson's IFR Markets had expected overall wholesale inflation to rise 0.4 pct, while core inflation was expected to increase 0.2 pct.
So what is an investor supposed to do?
IBonds deserve a place in an investor's portfolio.
These United States Government Savings Bonds are adjusted for inflation.
As explained:
I Bonds earn interest from the first day of their issue month.
- You can redeem them at any time after a twelve-month minimum holding period
- They are an accrual-type security
- They increase in value monthly and the interest is paid when you redeem the bond
- I Bonds are sold at face value; i.e., you pay $50 for a $50 I Bond
- I Bonds grow in value with inflation-indexed earnings for up to 30 years
If you redeem I Bonds before they’re five years old, you’ll forfeit the three most recent months’ interest; at or after 5-years old, you won’t be penalized.
Rates
The I Bond earnings rate is a combination of two separate rates; a fixed rate and an inflation rate:
Fixed Rate:
- Announced each May and November
- Applies to all bonds issued during the six months period beginning with the announcement date.
- Remains the same for the life of the bond
Inflation Rate:
- Announced each May and November
- Based on changes in the Consumer Price Index for all Urban Consumers (CPI-U)
- Is combined with the fixed rate to determine the earning rate of the bond every six months*
O.K., that's pretty conservative! But I always feel like I have an ethical responsibility to share my best ideas with my readers. And having an IBond in your portfolio of investments isn't really a bad idea! I plan on picking up a bond later this year. Investors are currently limited to $5,000/year in 'paper' bonds and $5,000/year in electronic bonds.
Go to the links above for more information on details and tax consequences.
Currently, IBonds purchased between May, 2008, and October, 2008, are yielding 4.8%. This may change. Up or down. But with money market rates in the low single digits, this might be something to consider.
I will write up some more stocks later :). But I would encourage all of you to explore the possibilities of a IBonds in your portfolio as a small inflation hedge.
Yours in investing,
Bob
Newer | Latest | Older


