Stock Picks Bob's Advice
Wednesday, 14 January 2009
Varian Medical Systems (VAR) "Revisiting a Stock Pick"
Hello Friends! Thanks so much for stopping by and visiting my blog, Stock Picks Bob's Advice! As always, please remember that I am an amateur investor, so please remember to consult with your professional investment advisers prior to making any investment decisions based on information on this website.
The market was very weak today; the Dow dropped 250 points or 2.9% to 8200. The Nasdaq wasn't any stronger, dipping 3.67% or nearly 59 points to 1,489, and the S&P was off 3.35% or 29.17 points to 842.62.
However, in the midst of this ongoing bear market, I continue to look for companies which appear to meet most of my own criteria. Yesterday Varian (VAR) made an 8+% move higher on an upbeat forecast for fiscal 2009. Unfortunately, with the market weak today, the stock gave back about a half of its gain closing at $35.62, down $1.34 or (3.63)% on the day. This stock however deserves a second look.

Varian is definitely an 'old favorite' of mine on this blog. I write this because I first wrote about Varian (VAR) on October 20, 2003, more than five years ago! Two years later, on May 11, 2005, I once again wrote up Varian on Stock Picks. I do not currently own any shares or options on this stock.
But I do still like Varian's business and their fundamentals remain impressive.
Regarding its business, as described by the Yahoo "Profile" on Varian (VAR), the company
"...and its subsidiaries provide cancer therapy systems worldwide. Its Oncology Systems segment designs, manufactures, sells, and services hardware and software products to treat cancer with radiation, including linear accelerators, brachytherapy afterloaders, treatment simulation and verification equipment, and accessories, as well as information management, treatment planning, and image processing software."
In a very morbid fashion, cancer is a growth business. There are few people that will get through life without dealing with this disease themselves or with one of their own close family members as I have personally related. In fact as the World Health Organization relates on their website:
"In 2005, 7.6 million people died of cancer out of 58 million deaths worldwide.
More than 70% of all cancer deaths occur in low and middle income countries, where resources available for prevention, diagnosis and treatment of cancer are limited or nonexistent.
Based on projections, cancer deaths will continue to rise with an estimated 9 million people dying from cancer in 2015, and 11.4 million dying in 2030."
Healthcare business, while relatively insulated from economic trends, is also feeling the effects of the economic downturn as this story relates. However, the pain felt in many cyclical businesses is far greater than the effects of the global economic slowdown on health-related businesses and employment.
This relative strength in healthcare was reflected in the recent employment report which noted every industry losing jobs "...except education, health care, and govenrment."
Which brings me back to Varian Medical Systems (VAR).
On January 12, 2009, Varian announced that in the first quarter of fiscal 2009, there would be a net growth in orders between 12 and 13% ahead of the year-ago period. Tim Guertin, president and CEO of Varian noted that this performance was in the face of continuing economic stress:
"While there is unprecedented volatility and uncertainty in this economic climate, the solid net orders growth in the first quarter gives us cautious optimism about the prospects for our businesses in 2009," said Guertin.
Furthermore, Varian late last year announced a continuation of a stock repurchase plan, with the authorization to pick up an additional 8 million shares of stock in 2009. As the company reported:
"Since initiating share repurchase authorizations at the end of fiscal year 2001, the company has spent $1.4 billion to repurchase 36 million shares of common stock at an average price of $40.13 per share."
Stock repurchases are helpful in supporting and advancing the price of a company.
Let's take a closer look at some numbers behind this company as reported on the Morningstar.com "5-Yr Restated" financials. First of all, we can see a very pretty picture of steady revenue growth from $1.24 billion in 2004 to $2.07 billion in 2008. Earnings have also increased in an uninterrupted fashion from $1.18/share in 2004 to $2.19/share in 2008. At the same time, outstanding shares, as explained above, has been decreasing from 142 million shares in 2004 to 128 million in 2008.
Free cash flow, as reported by Morningstar, has been positive and growing with $160 million in 2006 increasing to $291 million in 2008.
The balance sheet appears solid with $397 million in cash and $997 million in other current assets. This total of $1,394 million, when compared to the $781.7 million in current liabilities yields a current ratio of 1.78. Varian has a relatively small amount of long-term liabilities reported to be $166.7 million.
Reviewing a few "Key Statistics" on Varian from Yahoo, we can see that this stock is a mid cap stock with a market capitalization of $4.43 billion. The trailing p/e is a moderate 16.26, but with strong growth expected, the PEG is reported at a very nice 0.87 level.
Checking the Fidelity.com eresearch website, we can see that in terms of the Price/Sales ratio, Varian is relatively inexpensive with a Price/Sales (TTM) ratio of 2.24 compared to the industry average of 6.15.
The company is also relatively more profitable than its peers with a Return on Equity (TTM) of 31.49% compared to the industry average of 14.24% per Fidelity.
Returning to Yahoo, we find that there are 124.25 million shares outstanding with 123.37 million that float. As of December 10, 2008, there were 7.11 million shares out short representing 4.6 trading days of volume (the short ratio), which is a bit more than my own '3 day rule' for significance. We may have seen a bit of a 'squeeze' of the shorts yesterday on the back of the good news announcement.
No dividend is paid and the last stock split was a 2:1 split back on August 2, 2004.
Finally, let's take a look at the chart with a 'point & figure' graph from StockCharts.com:
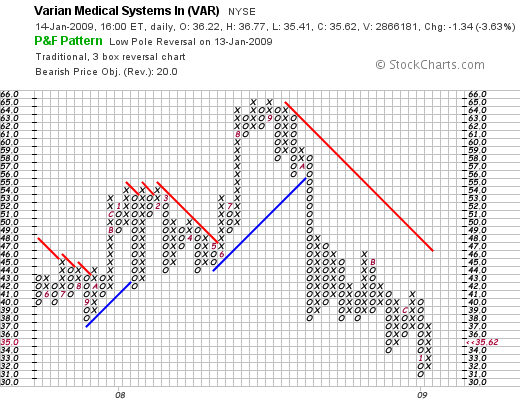
Here we can see that after hitting a 'double-top' in August, 2008, at $65.00, the stock broke down and continues to trade with lower lows and lower intermediate highs to the current level around $35.62. I see little to indicate any technical strength in this chart unfortunately.
However, I am not currently prepared to buy shares in Varian (VAR) nor any other new position. The decision to buy a new holding will only result after one of my current holdings hits an appreciation target on the upside. Needless to say in the current market, my holdings are moving in rather the opposite direction!
But in the midst of this depressing trading milieu, I continue to remain optimistic long-term and continue to look to identify the quality companies that are able to persistently grow revenue, earnings, free cash flow, and possibly dividends, while maintaining solid balance sheets and reasonable valuation. Except for the weak chart, Varian (VAR) is quite impressive and has easily earned a place in my blog!
Yours in investing,
Bob
Friday, 9 January 2009
Satyam (SAY) "Taking Another Look"
Hello Friends! Thanks so much for stopping by and visiting my blog, Stock Picks Bob's Advice! As always, please remember that I am an amateur investor, so please remember to consult with your professional investment advisers prior to making any investment decisions based on information on this website.
Satyam (SAY) is what I would have to call an 'old favorite' of mine.
In fact, this is what I had to say about Satyam (SAY) when I blogged about it on December 15, 2005:
"So what do I think? The stock is certainly showing strong fundamental and technical strength with a superb quarterly report which also raised guidance, a solid Morningstar.com "5-Yr Restated" financials, including growing free cash flow and a solid balance sheet. Valuation-wise, the PEG being just a bit over 1.0 is encouraging. However, the Price/Sales appears very rich at 6.1, way ahead of other stocks in the same business."
I was sold on the numbers. And yet were the numbers actually safe to believe?
On April 19, 2008, I "revisited" Satyam on this blog. The 'numbers' once again caught my attention.
This time I wrote:
"The latest quarter was strong and the company raised guidance. The longer-term view is equally impressive with steady revenue growth, earnings growth, and even dividend growth! Outstanding shares have been relatively quite stable and free cash flow is positive. The balance sheet is solid.
Valuation-wise, the company sells at a modest p/e with a great PEG ratio reported. Price/Sales is a bit rich but the company is more profitable than its peers as judged by the Return on Equity and Return on Assets ratios.
Finally, the chart looks satisfactory with the price undergoing a recent period of price consolidation and with the chart on the verge of 'breaking out' assuming the rest of the market holds up.
In other words this is my kind of stock! Now, if only I had been able to hang on to the shares I have owned in the past."
No I do not currently own any shares. In the past, I actually purchased shares in April, 2007, only to sell the same shares in August, 2007, with an (8.15)% loss. I wrote about this trade here.
If you have been following the financial news, you will be aware of what has been called India's Enron. The 'cooking of the books' that has led to the collapse of Satyam stock and the arrest of B. Ramalinga Raju, Satyam's former Chairman and founder and his brother B. Rama Rajku, a co-founder of the company.
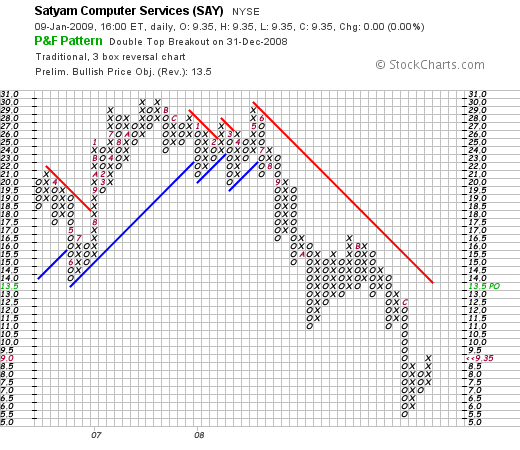
If we examine a 'point & figure' chart on Satyam (SAY), we can see that the breakdown in the stock price actually became apparent in July, 2008. For me, my own discipline of limiting losses saved me from even larger financial damage. This once again shows the potential problems of depending purely on 'value' and ignoring the decline in stock prices that may well be indicating greater problems, either with the equity itself or the market as a whole.
I was fooled along with other investors in Satyam (SAY). I read the basic news from Yahoo, saw the Morningstar reports and like what I read. I even bought shares in the stock and got 'stopped-out' with a loss.
Perhaps the most important lesson is to be aware that there is a leap of faith with every investment we make. That we need to not fall in love with any holding, pull the plug when the stock price deteriorates regardless of the news or numbers, and diversify adequately to protect ourselves from implosions of this sort that may well be totally unexpected.
I continue to learn from every investment and every blog entry that I make. As always, as I write over and over, I must let you know that I am an amateur. Please do check with your professional advisers who may also be unable to know what nobody has the power of knowing---that from time to time there are those who report information that they know is incorrect.
I trust that what I read from the best sources is true and reliable. Reality fails us from time to time in meeting even these basic expectations.
Yours in investing,
Bob
Posted by bobsadviceforstocks at 10:56 PM CST
|
Post Comment |
Permalink
Updated: Friday, 9 January 2009 10:58 PM CST
Wednesday, 7 January 2009
A Brief Update: Waiting for the Right Moment
Hello Friends! Thanks so much for stopping by and visiting my blog, Stock Picks Bob's Advice! As always, please remember that I am an amateur investor, so please remember to consult with your professional investment advisers prior to making any investment decisions based on information on this website.
I have been extremely quiet on this blog. For that I apologize to all of my readers.
However, there are times for activity and times for simply sitting quietly. I believe that we are in that latter period.
Certainly there is no uniform agreement on the proposed economic stimulus of President-elect Obama. Personally, I believe that government does indeed have a role in a fiscal stimulus of the beleaguered economy. Unfortunately, during the past eight years of relative economic stability, the current Administration has followed a 'supply-side' economic theory that utilized tax cuts without regards to expenditures to keep the economy moving. With this policy, the government changed a surplus to a massive deficit.
Now that we need to utilize deficits to stimulate the economy, we find ourselves already dealing with deficits that have been incurred in times of relative economic health. We likely need to push federal spending to get the economic recovery we all desire in spite of past deficits.
In the meantime, I continue to implement my strategy of monitoring my own holdings, using them as the indicators for future purchases and sales and the shifting between equities and cash. I also continue to monitor the top % gainers list--I should point out that rarely do I find stocks that appear to fit my own strategy, but yesterday did note that Chase (CCF) an old favorite of mine, and yet a stock that I do not own, made a nice move higher.
Otherwise, I am waiting patiently with much of my portfolio in cash and with my 6 positions being monitored closely.
I shall continue to keep you posted.
Yours in investing,
Bob
Thursday, 1 January 2009
My Trading Portfolio "An End of the Year Analysis"
Hello Friends! Thanks so much for stopping by and visiting my blog, Stock Picks Bob's Advice! As always, pleased remember to consult with your professional investment advisers before making any investment decisions based on information on this website.
Before I get any further, I would like to wish all of my friends and readers a very Happy and Healthy 2009.
With the New Year upon us already, I didn't want to let a moment pass before getting my year-end status online.
I last reviewed my holdings November 30, 2008 As I often explain here, I write about many different stocks as well as the stocks I actually own in my 'trading account'. As part of my effort to be as transparent as possible I try also on a regular basis to offer all of you a summary of how my own portfolio is doing.
The following list shows my holdings as of December 31, 2008, with the names of the stocks, their symbols, the number of shares held, date of purchase, the cost basis, latest price (12/31/08), and the % gain (or loss).
Haemonetics (HAE), 50 shares, 10/27/08, $51.70, $56.50, 9.28%
Johnson Controls (JCI), 82 shares,11/20/08, $14.83, $18.16, 22.42%
PetSmart (PETM), 104 shares, 11/20/08, $15.58, $18.45, 18.44%
Rollins (ROL), 350 shares, 10/16/08, $14.69, $18.08, 23.09%
Sysco (SYY), 154 shares, 12/10/08, $22.72, $22.94, .97%
WMS Industries (WMS), 72 shares, 10/28/08, $20.12, $26.90, 33.68%
Currently I have $18,487.43 in a Fidelity Municipal Money Market account. This is in addition to my $18,030.48 in equities described above. The account as of 12/31/08 had a total value of $36,517.91.
As of 12/31/08, my portfolio had $2,520.32 in unrealized gains. For 2008, my account had a net of $42.76 of realized gains after accounting for the $(9,246.00) in net realized short-term losses and $9,288.76 in net long-term gains.
I continue to regularly add $200/month to the account which goes into the money market fund. In 2008 I received $160.75 in ordingary dividends, $.44 in capital gain distributions as well as $118.33 in tax-exempt income for a total of $279.52 in income.
Balancing this was the total of $(244.79) in margin interest paid during 2008.
Overall 2008 was essentially a wash for me in terms of realized activity. However, what suffered the most was the loss of so much of my unrealized gains on my holdings. Thus, my account value dipped during the year as it did with so many investors.
Thanks for taking the time to visit my blog and I look forward to many more entries going into 2009 and the future.
Yours in investing,
Bob
Posted by bobsadviceforstocks at 8:37 PM CST
|
Post Comment |
Permalink
Updated: Friday, 2 January 2009 9:56 AM CST
Friday, 19 December 2008
Apogee Enterprises (APOG) "Revisiting a Stock Pick"
Hello Friends! Thanks so much for stopping by and visiting my blog, Stock Picks Bob's Advice! As always, please remember that I am an amateur investor, so please remember to consult with your professional investment advisers prior to making any investment decisions based on information on this website.
 Many of my recent entries have been about my trades---some successful and some not----and I haven't been writing quite as much about the kind of stocks that I refer to as my vocabulary of investable companies. These are companies that meet my fairly well-accepted criteria of consistent revenue and earnings growth, stable shares, positive free cash flow, and healthy balance sheet. It was a relief yesterday when I saw an 'old favorite' of mine, Apogee Enterprises (APOG) make the list of top % gainers. While I do not limit myself at this time to selecting stocks off these gainers lists, I do find them helpful in identifying companies that may have enough momentum to exhibit price appreciation in a prolonged fashion.
I first discussed Apogee on this blog back on September 20, 2007, when the stock was trading at $25.76. As I write this entry, Apogee is trading at $10.10, up $.56 or 5.87% on the day. However, the stock has declined markedly since my entry, actually down $(15.66) or (60.8)% since posting. Not exactly a stellar pick from last year, is it? I do not own any shares or options of this company.
Apogee is heavily involved in architectural glass, and associated products and services. It does also have some exposure to the picture framing market and optical display business. However, the construction slump that we have been experiencing in the United States has brought down shares of construction-related stocks like Apogee.
I would like to take you through some of the things about this company that I still find attractive even though the nature of the business itself, being associated with the building industry, concerns me.
First of all, the company jumped yesterday after they announced 3rd quarter 2009 results and maintained guidance on the rest of the year. Revenues for the quarter came in at $240.4 million, up 14% from the prior year. Earnings from continuing operations were $.63/share, up from $.26/share. Net earnings, including discontinued operations, came in at $.63/share, up from $.38/share last year.
If we review the Morningstar.com "5-Yr Restated" financials on APOG, we can see the picture of steady revenue growth from $490.8 million in 2004 to $881.8 million in 2008 and $937.7 million in the trailing twelve months (TTM).
Earnings have similarly increased during this period from a loss of $(.20)/share in 2004 to $1.67/share in 2008 and a dip to $1.66/share in the TTM.
The company also pays a dividend and has been increasing it annually from $.24/share in 2004 to $.28/share in 2008 and $.30/share in the TTM. Outstanding shares have been very stable with 28 million shares reported by Morningstar in 2004, and 29 million in the TTM.
Free cash flow has been positive and generally increasing with $5 million in 2006 growing to $31 million in 2008 and only dipping slightly to $23 million in the TTM. The balance sheet appears adequate with $6 million in cash and $244 million in other current assets resulting in a current ratio of 1.46.
The valuation of this stock has become even more compelling now with the discounted stock price. Per Yahoo "Key Statistics", this is a small cap stock with a market capitalization of only $280.81 million. The trailing p/e is reported at 5.93 (!), with a forward p/e expected at 8.71 (fye 01-Mar-10). The PEG works out to a very attractive 0.39. (Generally I have found stocks with PEG ratios between 1.0 and 1.5 to be 'acceptable'.)
Currently, the company pays a small but increasing dividend but with the decrease in the stock price this works out to an attractive 3.6% yield. The last stock split was back on February 18, 1997, when the company split its stock 2:1.
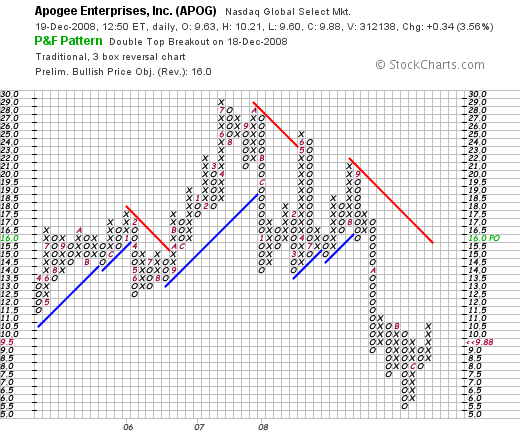
Looking at the point & figure chart on APOG from StockCharts.com, we can see that the stock price peaked back in July, 2007, at $29. The stock experienced growing weakness through August, 2008, when it managed to reach a level of $21, then broke down completely in September of this year, dipping as low as $5.50/share. The stock appears to be showing some recent strength but it would need to trade above $15.50, at least per this chart, to suggest some technical evidence of breaking-out above resistance.
Two additional stories from Yahoo also suggest an effort by management to continue to support the price of this stock. First of all, was this story from October 8, 2008, when the company announced an increased dividend, and this story also from October 8, 2008, when the company announced an increase in its share repurchase authorization.
Thus, I find myself once again writing about this small Minneapolis-based firm. I enjoy writing up stocks from the Midwest regardless of how many inches of snow we may have received last night!
But seriously, even though I do not own any shares, they reported a great quarter in the face of a dismal construction environment, have a terrific longer-term track record of increasing revenue, earnings, and even their dividend, and have compelling valuation numbers. On the downside is the ever-present reality of the awful building and home-construction market. In addition, I have been a bit wary of stocks trading at just-above $10, and I have had problems as well with these very small-cap companies. But this may well represent a good opportunity in this stock, and it deserves another mention on my blog!
Thanks so much for stopping by and visiting! If you have any comments or questions, please feel free to leave them right here on the website or email me at bobsadviceforstocks@lycos.com.
Yours in investing,
Bob
Posted by bobsadviceforstocks at 10:55 AM CST
|
Post Comment |
Permalink
Updated: Friday, 19 December 2008 12:16 PM CST
Saturday, 13 December 2008
A Small Change to my Stock Selection Strategy! Using Ecolab (ECL) as an example!
Hello Friends! Thanks so much for stopping by and visiting my blog, Stock Picks Bob's Advice! As always, please remember that I am an amateur investor, so please remember to consult with your professional investment advisers prior to making any investment decisions based on information on this website.
For the last several years I have been selecting stocks in the same general fashion. I check the lists of top % gainers first---generally avoiding stocks under $10---a strategy I picked up from the IBD CAN SLIM approach---and screen these stocks further.
Before deciding on any of these stocks, I generally look at the latest quarterly report hoping to find a company reporting growing revenue and growing earnings and possibly even beating analysts' expectations and raising guidance on future results. (For Ecolab (ECL), the information is here.)
If this looks good, I generally head over to the Morningstar.com page and check on the "5-Yr Restated" financials. I continue to look for steady revenue growth, earnings growth, possibly dividends with maybe some dividend growth, stable or declining outstanding shares, positive free cash flow and possibly growing free cash flow, and a balance sheet which shows more current assets than current liabilities. (Ecolab's (ECL) "5-Yr Restated financials.)
From there, I usually refer to the Yahoo.com finance page and research the "Key Statistics" on the stock, hoping to find a relatively low p/e, acceptable PEG ratio, and possibly a short ratio over 3.0. (Ecolab's "Key Statistics").
Often I will utilize my Fidelity.com site to check the Price/Sales ratio relative to the company's peers, and the same with the Return on Equity for a look both at valuation and profitability.
Finally, I like to check the "point & figure" chart from StockCharts.com to see if in my own amateur perspective, the chart looks as encouraging as possible and the stock price isn't instead in some sort of 'free fall.' (Ecolab's "point & figure" chart).
My timing of my purchases is still directed by sales of my own holdings as they reach appreciation targets or a sale of one of my minimum of 5 holdings which directs me as well to find a replacement and purchase a new stock.
The size of my purchases is now defined by the size of my other holdings. If I am purchasing a stock that is not one of the five minimum, then I purchase shares that amount to 125% of the average value of my other holdings. On the other hand, if this purchase is done 'under duress' that is, made mandatory by my own need to own at least five positions, then that 1-5 position purchase is much smaller, at 50% of the value of the remaining holdings.
What I have changed is not my reference to the top % gainers lists, but rather my willingness to not feel bound to that list and to instead purchase a stock that generally otherwise fits my criteria and is a 'high quality' company much like Sysco (SYY), which except for some recent accounting questions raised by Barron's is a great company to own and a company that I recently chose to purchase shares.
I use Ecolab (ECL) as another example. It is a similar company to Sysco (SYY), and I suspect they actually compete in the hospital market. However, Ecolab concentrates on cleaning supplies and Sysco has a greater emphasis on restaurant supplies and food. I do not currently own shares in Ecolab (ECL) but I do own shares in Sysco (SYY).
Anyhow, I wanted to clarify my slight nuanced change in my stock selection criteria. This blog and my own strategy is absolutely a 'work in progress' and I am glad you chose to come along on this journey.
If you have any comments or questions, please feel free to leave them on the blog or email me at bobsadviceforstocks@lycos.com.
Yours in investing,
Bob
Wednesday, 10 December 2008
DryShips (DRYS) and Sysco (SYY) "Trading Transparency"
Hello Friends! Thanks so much for stopping by and visiting my blog, Stock Picks Bob's Advice! As always, please remember that I am an amateur investor, so please remember to consult with your professional investment advisers prior to making any investment decisions based on information on this website.
 I had a busy, if relatively unprofitable, day today. Yesterday I wrote about my sale of a portion of Johnson Controls (JCI) at a gain, a sale that gave me a 'buy signal' to be adding a new position to my portfolio. Being at 5 positions, I am well under my maximum of 20 holdings, and partial sales at appreciation targets trigger a buy in my investment strategy of responding to the stock market by paying attention to the actions of my own holdings.
What I didn't count on was the severe volatility of this market and the fact that picking up stocks on the top % gainers list simply does not lend itself as well to my own strategy as it has in the past. I cannot explain the market activity but to point out that we can see surges in various industry groups as different strategies appear to be employed. One day we observe commodity stocks moving higher, the next day financials, and today we had a lot of energy and commodity-related stocks on the rise.
DryShips (DRYS) made the list of top % gainers today and I thought I would try my hand at this stock that has been hit hard recently and has been moving higher along with some of the commodities the past few days. In reality, employing my 8% loss limit on positions 6-20 in my portfolio really precludes me from buying a stock like DRYS which is swinging in 20% price moves the last few days. I learned this today.
Nevertheless I purchased 306 shares of DRYS (a number calculated by determining the value of 125% of the average of my remaining 5 holdings) at $11.1856 this morning, only to watch the shares dip and passing my own 8% loss limit within hours of my purchase, I sold these same shares at $10.1522 for a loss of $(1.0334) or (9.24)% since purchase. DRYS did rebound later in the day to close at $10.71, up $1.26 or 13.33% on the day. But I was no longer a shareholder by that time.
It is difficult to do so much learning as an amateur in public! But I would like to share with you my experiences so perhaps some of you may avoid my same errors.
After a similar experience the other day with Buckle (BKE), I really started asking myself if there was something very wrong with my stock selection approach. Clearly in the current market environment, investors are quick to sell large gains and this activity results in a lack of 'follow-through', something in the past that hadn't been a problem. Momentum has been very fickle.
But Johnson Controls (JCI) had worked. So what was the difference?
In today's market, the stocks that appear to have some staying power as the market rallies are similar companies of what I would call 'high quality' types with the steady revenue growth and earnings and the like that I write about frequently on this blog. But the over-done spikes in stock prices that are the result of either short-covering or simply market 'fads' for the moment are not the stuff to make an investment today.
Instead of sitting completely on my hands as a sale would usually dictate, I instead thought about some of the highest 'quality' companies that have been 'beaten-up' in the market but represent to me companies that may well have terrific longer-term prospects and are simply selling at a steep discount to probably real valuation. O.K. I confess, I believe the market we are in is best served by a touch of 'value investing' in here....more along the lines of GARP investing, where well-known 'quality' growth stocks are selling at discounted levels. Stocks like Fastenal (FAST), General Electric (GE), Walgreen (WAG), Ecolab (ECL), and Sysco (SYY) came to my mind. These are the 'archetypes' of my investment strategy.
 I chose to pick up some shares of Sysco (SYY), a company I have admired for many years, a company whose trucks dominate the road, providing food for many a restaurant and supplies for hospitals and institutions. This company wasn't going to go away and was selling for a song in the market. At least that was my take today. I wanted something 'safe' after getting my fingers burnt publicly more than once in a short period of time. I needed some sort of foundational stock for my portfolio that would anchor my holdings. I would sell if it hit an 8% loss like any other stock, but I had my doubts of much downside risk at these levels.
This afternoon I purchased 154 shares of Sysco (SYY) at $22.668. I was down a few cents on this purchase by the close as SYY closed at $22.39 on the day, up $.17 or .77%. It was a sedate purchase after my violent ride on DRYS. Something I needed I guess :).
Let's take a brief look at a few of the things I like about Sysco.
First the chart, a point & figure graph from StockCharts.com:
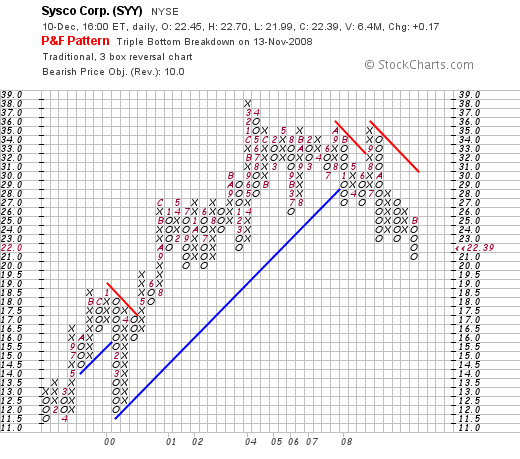
You can see from this chart that the stock is now trading at levels not previously seen since about 2002. Technically, there is little evidence that the stock has bottomed or has now turned higher. It looks like there is more on the downside. But some of the valuation numbers suggest otherwise.
Looking through some of the headlines on Sysco, we can see that just last month the company raised its dividend by 9%. Not exactly a pessimistic outlook by that move I would say.
Also last month, the company reported 1st quarter 2009 results. Revenue climbed 5% to $9.88 billion from $9.41 billion and earnings came in at $276.8 million or $.46/share up from $267 or $.43/share last year.
Reviewing the Morningstar.com "5-Yr Restated" financials on Sysco (SYY), we can see a pretty picture of steady revenue growth with the company reporting $26.1 billion in 2003 increasing to $35 billion in 2007 and $37 billion in the trailing twelve months (TTM).
Except for a dip in 2006, earnings have steadily increased from $1.37 in 2004 to $1.81/share in 2008 and $1.84/share in the TTM. Dividends have also been increasing steadily from $.50/share in 2004 to $.85/share in 2008 and $.88/share in the TTM. Meanwhile shares outstanding, which were listed at 662 million in 2004 have been steadily reduced each year to 611 million in 2008 and 608 million in the TTM.
Free cash flow is postive and growing with $611 million in 2006 and $1.08 billion in 2008 with $1.00 billion reported in the TTM.
The balance sheet appears solid with $346 million in cash and $5 billion in other current assets as compared to the $3.4 billion in current liabilities and the $3.4 billion in long-term debt.
Finally, in terms of valuation, looking at Yahoo "Key Statistics" we find that the company is a large cap with a market capitalization of $13.46 billion. The trailing p/e is only 12.20, with a forward p/e (fye 28-Jun-10) estimated at 10.46. The PEG works out at a very reasonable level of 0.95. The company pays a dividend of $.88/share with a forward yield of 4%.
Finally, the stock last split in December, 2000, when it reported a 2:1 stock split.
O.K., I got chicken. I stayed away from the high-fliers and bought something I could really sink my teeth into. Seriously. Something I see when I go out to eat at a restaurant.
They are a steady grower, they deserve a spot in most everyone's portfolio from my view. And I have a hard time hanging onto these $10 stocks anyhow that move violently up and down as I am trying to limit my losses in some rationale fashion. DryShips is an outstanding value in here I shall not dispute that fact. But maybe I am getting too old for those kind of stock moves and need something more dependable (?) like a Sysco (SYY). Sort of a 'comfort stock' you could say.
Anyhow, that's my update for today. Excuse me for publicly chasing and dumping a stock once again. I am changing my rules for the time being. I shall check but not limit myself to the top % gainers list. It is about time I gave myself a bit of flexibility on this. However, I shall continue to try to manage the stocks that are in my portfolio in the same disciplined (?) fashion.
If you have any comments or questions, please feel free to leave them right here or email me at bobsadviceforstocks@lycos.com.
Yours in investing,
Bob
Posted by bobsadviceforstocks at 4:51 PM CST
|
Post Comment |
Permalink
Updated: Wednesday, 10 December 2008 4:53 PM CST
Tuesday, 9 December 2008
Johnson Controls (JCI) "Trading Transparency"
Hello Friends! Thanks so much for stopping by and visiting my blog, Stock Picks Bob's Advice! As always, please remember that I am an amateur investor, so please remember to consult with your professional investment advisers prior to making any investment decisions based on information on this website.
 I cannot emphasize enough how my trading is driven by the performance of my underlying holdings. Especially in this time of extreme market volatility, having a plan to deal with price moves, whether they be on the upside or downside, is essential. In my own case, each of my holdings has sale points determined at their time of purchase whether it be a partial sale of 1/7th of my holding as the stock appreciates in price, or a complete sale of the holding should the stock decline 8% (or 16% if in the last 5 of my maximum of 20 positions), or at other set points should the stock have previously appreciated and experienced partial sales of that holding.
These sales drive my own responses to the market. On the downside, I either 'sit on my hands' with the proceeds (if I am above 5 positions) or I replace that holding with a new holding of smaller size. In any case, these downside sales drive my portfolio towards cash and away from equities. I am simply trying to "listen" to my stocks as they let me know like that canary in the coal mine whether it is a 'good time' to be investing, or rather a 'bad time' and I should enjoy whatever cash position I can possibly possess.
Johnson Controls (JCI) is a rather new position in my minimum of 5 holdings. These holdings have been decreasing in size in a planned fashion. This morning, I sold 13 shares of my 95 share position at $20.36, 1/7th of my holding, as it hit and passed my first appreciation target which is at a 30% gain over an initial purchase. I had just purchased these 95 shares on 11/20/08, not much more than two weeks ago, at a cost basis of $14.83. Thus with the sale at $20.36, this represented a gain of $5.53/share or 37.3%. It turned out to be a timely sale because as the market dipped later in the day, JCI also turned lower and closed at $19.44, down $(.09) on the day.
With a sale at an appreciation of a holding, I now have a 'buy signal' to add a new 6th position to my portfolio. I shall be waiting for a suitable stock to come along that meets my own criteria for stock selection and shall keep you posted.
Meanwhile, if you have any comments or questions, please feel free to leave them on the blog or email me at bobsadviceforstocks@lycos.com.
Yours in investing,
Bob
Posted by bobsadviceforstocks at 5:05 PM CST
|
Post Comment |
Permalink
Updated: Tuesday, 9 December 2008 8:49 PM CST
Thursday, 4 December 2008
Buckle (BKE) "Trading Transparency"
Just a very quick note to update you on my Buckle (BKE) stock, which I absolutely love, but have learned to part ways as "friends" :).
Doug S. dropped me a not earlier warning me about the technicals, but I used my old strategy in a very difficult and unfriendly market that turned around and headed lower today.
I sold my 143 shares of BKE which were purchased just hours ago at $24.3968, at $22.0132. That is more than an (8)% loss and being in position 6-20 of my portfolio, it is my loss limit. Anyhow, they are history.
It is unfortunate that a 'favorite' of mine should disappoint like that. But I remain committed to limiting losses, exercising trading discipline, and recognizing trading mistakes as soon as possible. I also am committed to sharing with you my own actual trades as foolish as they may sometimes appear.
Please feel free to comment here or email me at bobsadviceforstocks@lycos.com if you have any other thoughts.
Yours in investing,
Bob
Buckle (BKE) "Trading Transparency"
Hello Friends! Thanks so much for stopping by and visiting my blog, Stock Picks Bob's Advice! As always, please remember that I am an amateur investor, so please remember to consult with your professional investment advisers prior to making any investment decisions based on information on this website.
 I needn't tell you that the 'nickel in my pocket' from my partial sale of WMS (WMS) yesterday was burning a big hole and waiting to be spent!
If you didn't catch the story about Ford (F) yesterday, I would encourage you to take note of anything that sounds optimistic about the economy. Yesterday Ford (F) related that it was increasing production of the F-150 pickup.
As reported:
"Analysts said a sharp drop in gas prices curbed the decline in truck sales.
Ford already announced in October that it planned to restore in January a third shift at its other F-150 plant in Dearborn, Mich. Those roughly 1,000 workers had been laid off earlier this year as the automaker cut production.
The decision to shift workers at the plant in Claycomo near Kansas City to F-150s is continuing that strategy, Kozleski said.
"Despite the challenges in the market, the fullsize pickup remains one of the big sellers in the industry and we are ensuring we have capacity to meet market demand," she said."
Now this particular entry in my blog isn't about Ford (F) at all. We all know the CEO's of the 'big 3' automakers are back testifying to Congress over their need for federal subsidies to keep them in business. But isn't it somehow reassuring that some part of the auto business, even if it is the F-150 pickup line, is showing some life and growth in the midst of what sounds to be universal despair?
Anyhow, I had that nickel in my pocket this morning. If you aren't a regular reader of my blog, I should explain that my stock portfolio shifts between 5 and 20 positions. I use the performance of my own stocks to determine whether I should be adding a new position or shifting more funds into cash. With a sale of 1/7th of my WMS position at a 30% gain (my first targeted appreciation level), that action generated a 'buy signal' for me and I was on the 'lookout' this morning for a good prospect to add to my portfolio.
Checking first with my favorite starting point, the list of top % gainers, I found that an old favorite of mine, Buckle (BKE) had made the list and currently as I write is trading at $23.85, up $4.29 or 21.93% on the day. I went ahead an purchased 143 shares of Buckle (BKE) at $24.3968. I calculated this number of shares by purchasing 125% of the average of my other 5 holdings---as I have written about as my plan for the positions 6-20 in my portfolio---positions that are purchased on 'good news' events.
I say 'old favorite' of mine, because I first wrote up Buckle (BKE) on this blog on April 8, 2005, and then 'revisited' the stock again on December 23, 2006.
What drove the stock higher today was the announcement before the open of November sales for the four-week period ended November 29, 2008. Unless you are living in a cave, you probably are quite aware of the retail sales slump that we are experiencing in the United States, and the global economic slump the world is working through.
Anyhow, the Buckle reported that November sales overall increased 21.6% to $72.2 million from $59.4 million last year. Pretty solid! But even better was the same-store numbers which Buckle reported that for stores open at least one year, same-store sales during the period climbed 15.0%. Year-to-date, comparable store sales for the 43-week period ended November 29, 2008, increased 22.6% over the same period the prior year. So while the growth wasn't quite at the pace of the prior 6 months, it is still pretty amazing! In addition, the company in the same announcement reported that it was busy rebuying its own shares, acquiring 391,400 shares of stock at an average price of $16.23/share.
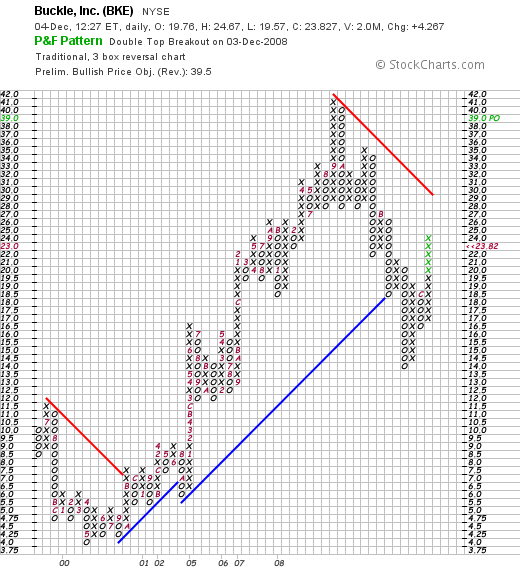
If we look at the StockChart 'point & figure' chart on Buckle (BKE), we can see that the stock peaked at $42/share back in September, 2008, and dipped to as low as $14 this past November, 2008. The stock is moving higher from that intermediate low point, breaking above prior 'support lines' (the blue line on the graph) at $18.50, and pushing towards resistance at $29.
Reviewing the Morningstar.com "5-Yr Restated" financials on Buckle (BKE), the growth in revenue, earnings, and free cash flow is unabated. The company is paying an increasing dividend and at the same time reducing its outstanding shares. The balance sheet is solid with a current ratio of almost 4. There is nothing not to like on this page.
In fact, if we check the latest quarterly report, the 3rd quarter results were reported just two weeks ago: earnings came in at $.62/share or $.64/share removing a one-time charge. This was $.01 ahead of estimates! Net sales came in at $210.6 million, up from $167.6 million last year. And same-store sales for the quarter came in up 19.1% (!) from last year. Nothing shabby there. In fact, I am a bit perplexed how this company has managed to escape the retail struggles of the other stores at the mall!
Looking at Yahoo "Key Statistics" for a brief update on some valuation numbers, the company has a market cap of $1.1 billion, making it a mid cap stock with a trailing p/e of 11.19. With a forward p/e of only 10.75, the company has a PEG ratio of 0.60 practically screaming to me of great value!
There are 46.46 million shares outstanding but only 24.16 million of them that float. As of 11/11/08, there were 8.74 million shares out short for a short ratio of 7.6 trading days (above my 3 days for significance.)
As I noted earlier, the company pays a great dividend of $.80/share yielding 4.60%. The payout ratio is only 33% giving it ample room to increase it in the future depending of course on future earnings and prospects. In fact, the company just completed a 3:2 stock split on October 31, 2008.
Anyhow, that's the news on my trading portfolio. I do not know if I am seeing the light at the end of the tunnel, but somehow that F-150 report yesterday got me a bit encouraged. And it is nice to see an 'old name' of mine moving higher on good earnings and sales news. Sort of like old times.
Thanks again for stopping by and visiting. If you have any comments or questions, please feel free to leave them on the blog or email me at bobsadviceforstocks@lycos.com.
Yours in investing,
Bob
Posted by bobsadviceforstocks at 12:27 PM CST
|
Post Comment |
Permalink
Updated: Thursday, 4 December 2008 12:28 PM CST
Newer | Latest | Older


