Stock Picks Bob's Advice
Sunday, 22 December 2013
Cintas (CTAS) "Revisiting a Stock Pick"
Hello Friends! Thanks so much for stopping by and visiting my blog, Stock Picks Bob's Advice! As always, please remember that I am an amateur investor, so please remember to consult with your professional investment advisers prior to making any investment decisions based on information on this website.
 It is often hard to believe that I have been blogging here on this website since May 12, 2003, over 10 years ago, when I wrote up my first entry St Jude Medical. For those of you who have become regular readers here, I thank you and hope that I have in some small way added to your own understanding of looking at stocks. I know that it has been a very useful experience for me giving me the experience of examining literally thousands of stocks right here and developing my own appreciation of 'good' and 'bad' investments. I do not claim to be more than an amateur seriously, but have learned quite a bit through this process.
In fact, I often come back to many of the same names over the years. These are the kind of stocks that I believe that Gene Walden, a favorite mentor of mine, might think worthy of inclusion in a 100 Best book of his. What these stocks represented were the companies that through wise management were able to offer America a product or service that could grow steadily over a long period of time and along with it, an appreciating stock price that would make holding shares worthwhile.
On July 15, 2005, I first wrote up Cintas (CTAS) when it was trading at $44.00/share. At that time I did not own any shares. On April 9, 2013, I purchased shares of Cintas (CTAS) at $44.49 in my Covestor Growth and Momentum Model which I manage on the Covestor Website. It is an interesting coincidence that I purchased shares years later when the stock was trading at virtually the same price. CTAS had a good day Friday, December 20, 2013, closing at $59.30 on a strong earnings report.
According to the Yahoo "Profile" on Cintas, the company
"...provides corporate identity uniforms and related business services for approximately 1 million businesses primarily in North America, Latin America, Europe, and Asia. The company operates in four segments: Rental Uniforms and Ancillary Products; Uniform Direct Sales; First Aid, Safety and Fire Protection Services; and Document Management Services."
Looking closer at that second quarter 2013 earnings report that I mentioned above, CTAS reported on December 20, 2013, that earnings came in at $.70/share, above the Zacks Estimate at 11.1% improvement over last year's $.63/share result. Revenue grew 7.9% from last year to $1.14 billion, also ahead of Zacks estimates. The company also raised guidance for the lower end of the range on both revenue for 2014 and earnings.
Reviewing longer-term results, the Morningstar 5 Years Financials shows that Cintas has grown its revenue from $3.78 billion in 2009 to $4.31 billion in 2013 and $4.39 billion in the trailing twelve months (TTM). Diluted earnings per share actually dipped from 2009 at $1.48/share to $1.40/share in 2010. However, since then earnings have steadily grown to $2.52 in 2013 and $2.56 in the TTM. Outstanding shares have declined as the company repurchased shares with 153 million shares in 2009 declining to 124 million shares in the TTM.
Morningstar reports the company's balance sheet as of May, 2013, showing $1.63 billion in current assets and $556 million in total current liabilities yielding a current ratio of 2.93. Free cash flow per Morningstar has been positive and steady with $363 million in free cash flow as of 2009 and $354 million in free cash flow in the TTM.
Examining some valuation numbes on Cintas as reported on the Yahoo "Key Statistics", we find that Cintas Corporation (CTAS) is a mid cap stock with a market capitalization of $7.11 billion. The trailing P/E is a moderat 22.71. Forward P/E is better (fye May 31, 2015 estimated) at 19.38. But the PEG ratio still remains somewhat rich at 2.01. Yahoo reports 119.82 million shares outstanding with 99.82 million that float. As of November 9, 2013, there were 6.89 million shares out short. Considering the average daily volume of 557,398 (past 3 months), this works out to a short interest ratio of 18.60. This is well above my own arbitrary '3 day rule' for significance. Thus, this past Friday when the company reported solid earnings (as discussed above), the stock climbed sharply. One can only wonder whether a bit of a 'short squeeze' was in action.
Cintas pays a forward dividend of $.77 with an estimated yield going forward of 1.30%. The company has a payout ratio of 29% suggesting some room for dividend boosts going forward. Cintas last split its stock in the form of a 3:2 stock split on March 8, 2000.
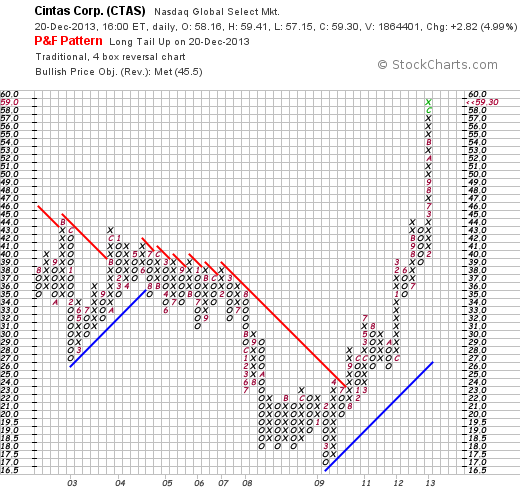
Over the years I have learned that one of the safest stocks to purchase was one in which the chart showed strength, which for me is a chart showing stock price appreciation. Looking at the Point & Figure Chart from StockCharts.com on Cintas, we can see that the stock price dipped after my initial write-up in 2005. In fact looking back at my own comments I wrote:
" I see what looks like a long-term declining trend in stock price from $56, all the way back in May, 2002, to the $44 level where it closed today. What concerns me is what appears to be a series of declining highs, but the recent move breaking through a resistance level is moderately encouraging. Certainly the stock chart is not ahead of itself, and I wouldn't call this one over-extended. Yet the question remains whether this shows any significant upward momentum at all!"
It certainly wasn't a good price entry back in 2008 and the chart looked awful! The chart looks much stronger today! Since dipping to as low of $17 in March, 2009, this stock has been on a tear climbing to its current levle of $59.30.
To summarize, Cintas is now a holding in one of my Covestor models, and has been showing price appreciation since purchase six months ago. The company has been steadily growing its uniform and business support enterprise with steady increases in revenue and earnings while gradually decreasing its outstanding shares. The company has a strong balance sheet and continues to generate solid free cash flow. In addition, the company pays a modest dividend.
The company is a bit richly priced based on P/E and PEG values so it may have gotten a little ahead of itself in terms of a new purchase. The chart is quite strong and there are lots of shares out short betting against the stock meaning they will need to be covered if the stock remains strong.
Thank you again for stopping by and a special thank you to the loyal visitors who have stopped by here year after year! Wishing you all the best of health and good fortune in 2014.
Yours in investing,
Bob
Saturday, 14 December 2013
Alexion Pharmaceuticals (ALXN)
Hello Friends! Thanks so much for stopping by and visiting my blog, Stock Picks Bob's Advice! As always, please remember that I am an amateur investor, so please remember to consult with your professional investment advisers prior to making any investment decisions based on information on this website.
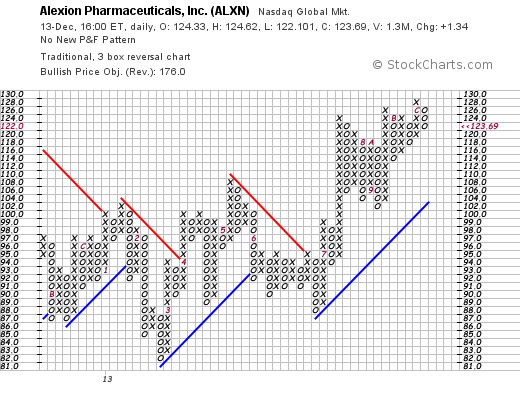
 On December 9, 2013, I purchased shares of Alexion Pharmaceuticals (ALXN) for my Covestor Healthcare Model at a cost of $126.24. ALXN closed Friday, 12/13/14 at $123.69, up $1.34 or 1.10% on the day yet is still trading at a couple of dollars below my own purchase price. Let's take a closer look at this stock and see if it remains a promising investment for my portfolio.
According to the Yahoo.com "Profile" on Alexion, the company is
"...a biopharmaceutical company, engages in the development and commercialization of life-transforming therapeutic products. The company offers Soliris (eculizumab), a therapeutic product for the treatment of patients with paroxysmal nocturnal hemoglobinuria (PNH), a blood disorder; and atypical hemolytic uremic syndrome (aHUS), a genetic disease. It also conducts Phase IV clinical trails on Soliris for its usage for the treatment of PNH  registry, and aHUS for pediatric and adult; and various Phase II clinical trails for its usage for the treatment of PNH pediatric trial, cold agglutinin disease, MPGN II/C3 nephropathy, hemolytic uremic syndrome, presensitized renal transplant, delayed kidney transplant graft function, ABO incompatible renal transplant, neuromyelitis optica, and myasthenia gravis. In addition, the company develops Asfotase alfa that is under Phase II clinical trail for the treatment of metabolic disorders, including hypophosphatasia; ALXN 1102/1103, which is in Phase I trial for PNH; and ALXN 1007, a novel humanized antibody for treating inflammatory disorders. Further, the company conducts preclinical trails on cPMP for treating metabolic disorders."
As you can see, there is little "Peter Lynch" about an investment in Alexion (ALXN) or other similar biotech companies. Investors are dependent on other analysts who may well be able to measure the potential of drugs like eculizumab unlike a company like Coca-Cola (KO) in which an investor could at least try a little over ice!
It is true that Alexion (ALXN) just entered into a voluntary recall of a couple of lots of its Soliris medication. However, this appears to be a short-term blip in this drug's sales. Recently, additional clinical evidence for the utility of Soliris for patients with atypical hemolytic uremic syndrome (aHUS) was presented at the American Society of Hematology. Alexion plays a key role in this rare but life-threatening disorder.
In terms of the latest quarterly results, Alexion (ALXN) reported third quarter 2013 results on October 24, 2013. Sales for the quarter increased 36% to $400.4 million compared to sales of $294.1 million the prior year. GAAP net income increased to $93.8 million or $.47/share compared to $92.2 million or $.46/share the prior year. These results exceeded expectations on both earnings and revenue as had been forecast by Zacks.
In terms of a longer-term view, we can see from the Morningstar.com 'financials' on Alexion that the company has rapidly grown revenue from $259 million in 2008 to $1.13 billion in 2012 and $1.43 billion in the trailing twelve months (TTM). Diluted earnings which spike from $.20/share in 2008 to $1.63/share in 2009, dipped back to $.52/share in 2010. However, since 2010, they have steadily climbed reaching $1.28/share in 2012 and $1.77/share in the TTM. During this time, Alexion has grown its shares outstanding modestly from 180 million shars in 2008 to 199 million in 2012 and in the TTM.
According to the Morningstar Balance Sheet numbers on Alexion, the company appears extremely solvent with current assets of $1.50 billlion compared to only $360 million in current liabilities, yielding a current ratio of 4.16.
Looking at the free cash flow history on Morningstar, we can see that the company has been generating a growing amount of free cash with $5 million reported in 2008, $389 million in 2012 and $365 million in the TTM.
In terms of valuation, Alexion (ALXN) is a large cap stock with a market capitalization of $24.25 billion according to the Yahoo "Key Statistics" on this stock. The trailing P/E is a very rich 69.96 (compared to the S&P 500 which currently trades with a P/E of 19.9!) However it is always important for an investor to consider what the future holds for a stock not just where it is now. In other words, if we take into consideration anticipated growth of earnings, the PEG ratio is much more down to earth with a level of 1.60 (5-yr expected).
Yahoo reports that the company has 196.3 million shares outstanding with only 1.07% held by insiders. As of October 31, 2013, there were 3.3 million shares out short and with average volume of 1.1 million shares traded, this yields a short interest ratio of 3.00--right at my own arbitrary cut-off for significance. No dividends are paid and the last stock split was on May 23, 2011, when the company declared a 100% stock dividend effecting a 2:1 stock split.
Examining the 'point & figure' chart from StockCharts.com on Alexion, we can see that the stock has demonstrated fairly significant price volatility in 2013 but has climbed from a low of $82 to a high of $128 earlier this month closing 12/13/13 at $123.69. Overall the chart looks strong and heading higher from my own amateur perspective!
In conclusion, I recently purchased Alexion Pharmaceuticals (ALXN) for my Covestor Healthcare Model that I manage and personally own the portfolio upon which it is based. Alexion has been growing rapidly selling orphan drugs for deadly diseases and has recently demonstrated additional evidence that its treatment is effective. Soliris has the dubious distinction of being one of the world's most expensive medications costing a patient about $400,000/year for treatment. The company has fundamental strength, technical price strength and hopefully will become a strong holding within my own portfolio.
Thank you again for visiting my blog. If you have any comments or questions, please feel free to leave them right here on the website.
Yours in investing,
Bob
Sunday, 8 September 2013
Prestige Brands (PBH)
Hello Friends! Thanks so much for stopping by and visiting my blog Stock Picks Bob's Advice! As always, please remember that I am an amateur investor, so please remember to consult with your professional investment advisers prior to making any investment decisions based on this website.
 I don't spend a lot of time talking about how I got interested in investing years ago, but I give credit mostly to my father, the late Lt. Col. Sumner Freedland, who taught me to look at labels, read stock prices, and buy equities. I purchased my first shares 46 years ago this month and have followed the market since.
In his own Peter Lynch style, my father like to invest in things he understood. I remember that his favorite investments were AT&T (T) (way prior to the spin off of all of the 'baby bells'), and Merck (MRK). He used to enjoy showing me all of his stock certificates and the many splits he had received over the years. He convinced me!
Like my father, I occasionally get on what might be called 'health kicks'. I have been convinced of the helpfulness of Vitamin D in the diet and take a supplement, I take some Omega 3's (being aware of recent controversy about Omega 3's and Prostate Cancer), and I use a fiber supplement for those benefits.
I will attest to greater compliance attributable to gummies even as an adult. I am not put off by another pill or two to swallow when given the alternative of a good tasting gummy instead! There are some anecdotal suggestions that compliance in vitamin regimens will be improved as the vitamins are available in a pleasant tasting form.
 Two of the brand names that I consume include vitafusion for multiple vitamins and Fiber Choice for a fiber supplement. It turns out that vitafusion is produced by Northwest Natural Products which is now owned and produced by another one of my favorite companies, Church & Dwight (CHD). However, Fiber Choice is now owned by Prestige Brands (PBH). In some ways this is a 'revisit' of a stock pick because the original owner of Fiber Choice was a company CNS (CNXS) that I reviewed back in April, 2005.
On October 16, 2005, GlaxoSmithKline (GSK) announced its purchase of CNS, Inc. for $566 million. In December, 2011, GlaxoSmithKline sold 17 over-the-counter medicines to Presige Brands Holdings (PBH) where Fiber Choice ended up today. Thus the circuitous route of this supplement to my medicine cabinet!
I do not currently own any shares of Prestige Brands (PBH) although I briefly held some shares this past month but sold them as the market weakened. Prestige Brands closed at $31.81 on September 6, 2013.
According to the Yahoo "Profile" on PBH, the company
"....through its subsidiaries, engages in the marketing, sale, and distribution of over-the-counter healthcare and household cleaning products in North America and internationally. It operates through two segments, Over-The-Counter Healthcare and Household Cleaning. The Over-The-Counter Healthcare segment offers a portfolio of OTC products under 14 primary OTC brands, including Chloraseptic sore throat remedies, Clear Eyes eye drops, Compound W wart removers, Little Remedies pediatric healthcare products, The Doctor’s brand of oral care products, Efferdent and Effergrip denture products, Luden's cough drops, PediaCare pediatric healthcare products, Dramamine motion sickness products, BC and Goody's Analgesic powders, Beano gas prevention, Gaviscon antacids, and Debrox ear drops. The Household Cleaning segment markets household cleaning products, such as Chore Boy scrubbing pads and sponges; Comet abrasive powders, creams, liquids, and non-abrasive sprays; and Spic and Span dilutables, sprays for counter tops, glass cleaners."
On August 1, 2013, Prestige Brands Holdings (PBH) announced 1st quarter 2014 results. Adjusted revenue for the quarter actually dipped 1.9% to $143.0 million from last year's $145.8 million. Net income, however, came in at $20.7 million or $.40/diluted share, up 41.2% from the prior year's result of $14.7 million or $.29/diluted share. Analysts had been expecting $.38/share which the company beat, but they had also expected revenue of $147.1 million below expectations. Altogether, a bit of a mixed quarter.
Reviewing the Morningstar.com financials on Prestige Brands Holding (PBH), we can see that revenue has grown from $313 million in 2009, dipping to $302 million in 2010, then steadily climbing to $624 million in 2013 before the dip to $620 million in the latest twelve months (TTM).
Diluted earnings per share have improved from a loss of $(3.74) in 2009 to $1.27 in 2013 and $1.38 in the TTM. During this period outstanding shares have been fairly constant at 50 million in 2009 increasing to 51 million in 2013 and 52 million in the TTM.
Free cash flow has improved from $66 million in 2009, dipping to $59 million in 2010, and increasing to $127 million in 2013 and $135 million in the TTM.
In terms of a simplified view of the balance sheet, Morningstar reports PBH with $164 million in current assets as of March, 2013, and $97 million in total current liabilities. This results in a healthy current ratio of 1.69.
Looking at the Yahoo "Key Statistics" on Prestige Brands to get a feel for some valuation numbers, we can see that the stock is a small cap stock with a market cap of $1.63 billion. The trailing P/E is moderate at 23.05 with a forward P/E (fye Mar 31, 2015) a little better at 17.29. Still the growth rate is expected to fail to reduce the PEG into what I would consider a reasonable range (under 1.5) with a current PEG reported at 1.95.
Prestige Brands has 51.17 million shares outstanding with 50.81 million that float. Currently there is a modest number of shares out short reported to be 442,730 shares as of August 15, 2013. This results in a similarly modest short interest ratio of 1.60. (Generally I use 3.0 days to cover as suggestive of significance---my own arbitrary cut-off.) The company does not pay a dividend and no stock splits are reported on Yahoo.
Examining the 'point & figure' chart on PBH from StockCharts.com, we can see what appears to be a very strong technical chart with a sharp ascent in stock price from early 2009 when it was trading at around $4.25 to its current level of $31.81. Currently the stock is consolidating but appears (if I may be free to speculate here) that the stock is poised to move higher.

In summary, this stock market idea took a circuitous route from my bathroom medicine cabinet to this blog! Prestige Brands, a little like Church & Dwight (CHD), is putting together a large group of familiar household brands and is doing so without an excessive increase in outstanding shares or excessive debt. In addition, as this Motley Fool article points out, they are generating plenty of free cash flow that can be used for enhancement of shareholder value or perhaps a dividend (?) down the road.
The stock appears to be fairly fully priced but does have a very strong chart as well making it attractive from my perspective. I do not own any shares, but this one certainly is on my horizon and I hope to revisit this as a shareholder in the future.
Thank you again for stopping by and visiting my blog! If you have any comments or questions, please feel free to leave them here and I shall try to respond the best I can.
Yours in investing,
Bob
Wednesday, 26 June 2013
Heartland Payment Systems (HPY)
Hello Friends! Thanks so much for stopping by and visiting my blog, Stock Picks Bob's Advice! As always, please remember that I am an amateur investor, so please consult with your professional investment advisers prior to making any investment decisions based on information on this website.
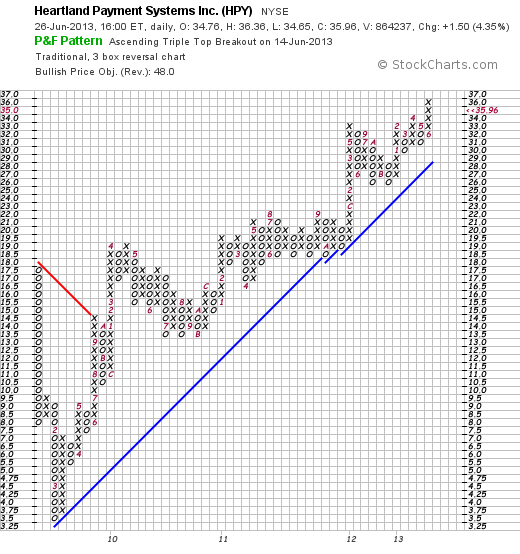
 With the market's recent correction, I found myself selling a couple of recent purchases including Interxions Holdings NV (INXN) after accruing a small loss after my initial purchase in my Covestor Growth and Momentum Model. However, with the stock market rebounding on realization that the sky was indeed not falling, I found myself looking around for a new position and decided upon Heartland Payment Services (HPY). On June 25, 2013, I picked up shares of Heartland Payment Systems (HPY) at a cost of $34.46. HPY closed at $35.96 on 6/26/13, up $1.50 or 4.35% on the day. Thus far, it has been a good purchase for the portfolio.
According to the Yahoo "Profile" on HPY, the company
"...provides bankcard payment processing services in the United States  and Canada. It facilitates the exchange of information and funds between merchants and cardholder’s financial institutions; and offers end-to-end electronic payment processing services, including merchant set-up and training, transaction authorization and electronic draft capture, clearing and settlement, merchant accounting, merchant assistance and support, and risk management to merchants. The company also provides other merchant services comprising payroll processing, gift and loyalty programs, and prepaid and stored-value solutions; paper check processing; payroll and related tax filing services; and secure point-of-sale solutions, as well as sells and rents point-of-sale devices and supplies."
On April 30, 2013, Heartland Payment Services announced 1st quarter 2013 results. Revenue came in at $501.2 million, up 7% from the prior year's $467.6 million. This was slightly under analysts expectations of $511.5 million. Earnings, however, came in at $.41/share (after stock-based compensation and other items) ahead of analysts' expectations of $.40/share. Net income climbed 42% year-over-year to $19.6 million or $.51/share compared to the prior year result of $13.8 million or $.34/share.
The company also raised guidance for 2013 results to adjusted earnings between $2.29 and $2.33/share ahead of analysts who had been expecting earnings of $1.94/share. All-in-all a very solid report in a relatively weak economic environment.
Longer-term, reviewing the Morningstar.com "Financials" on Heartland Payment Systems, we can see that revenue has grown steadily from $1.54 billion in 2008 to $2.013 billion in 2012 and $2.047 billion in the trailing twelve months (TTM). Operating income came in at $71 million in 2008 then dipped to $46 million in 2010 then rebounded strongly to $78 million in 2011, $110 million in 2012 and $114 million in the TTM.
Similarly earnings per share dipped from $1.08 in 2008 to a loss of $(1.38) in 2009, then rebounded sharply to $.88/share in 2010, $1.09/share in 2011, $1.64/share in 2012 and $1.81/share in the TTM.
Looking at the HPY "Balance Sheet" figures from Morningstar.com, this company is reported to have total current assets of $409 million and total current liabilities of $495 million, yielding a Current Ratio of .83, a bit below a minimum of 1.0 suggesting that the company might have some financial stress meeting current obligations. Free cash flow of $106 million in the TTM however suggests that the company is generating enough cash to pay its current obligations and also pay a dividend. In fact, the company has been paying a dividend since 2006 and has been raising iton a regular basis as this payment history reflects.
In terms of valuation, examination of some of the Yahoo "Key Statistics" on Heartland reveals that the company is a small cap stock with a Market Capitalization of only $1.31 billion. The trailing P/E is a moderate 19.77 with a forward P/E (fye Dec 31, 2014) estimated at 16.35. With its rapid growth in earnings, the "G" in the PEG ratio is large enough that the PEG ratio works out to a modest 1.13.
Yahoo reports only 36.33 million shares outstanding with 35.02 million that float. As of May 31, 2013, there were 9.54 million shares out short creating a very significant short interest ratio of 13.20. (Generally I arbitrarily view 3 days as my own 'cut-off' for significance). With good news and an increasing stock price, we may be setting the stage for a 'squeeze' on short-sellers of this stock. As a holder of these shares, one can only hope!
Heartland Payment Systems (HPY) pays a forward estimated dividend of $.28/share with a modest yield of 0.80%. This is ahead of the trailing dividend of $.26/share. No stock splits are reported on Yahoo.
Examining the 'point and figure' chart on HPY from StockCharts.com, we can see that after a sharp sell-off in early 2009 from $17.50/share to a low of $3.50/share in February, 2009, HPY has had a remarkable record of price appreciation to its current level of $35.96. This is a very strong technical chart in my amateur perspective.
If we put this all together we have an interesting company involved in credit card processing and online payment processing for businesses that recently reported a strong quarter that while coming in a bit under expectations in terms of revenue, exceeded analysts' views in terms of earnings. The company confidently raised guidance for the year ahead of what was expected. This all done in a relatively weak economic environment.
Looking at some of the financials from Morningstar, the company has grown its revenue and earnings in a very strong fashion the past few years. Their current ratio is a bit weak which deserves some attention but the strong free cash flow and the confidence the company has demonstrated with boosting its cash dividend and expanding its share buyback, suggest that this isn't very significant. Furthermore, the valuation is really modest with the strong growth in earnings giving us a PEG just over 1.0. To top it off, there are a lot of naysayers outstanding with a large short interest ratio suggesting lots of shares that are waiting to be covered with purchases likely to support the stock price appreciation.
There aren't any perfect stocks. I suppose like there aren't any perfect investors. Yours truly included. I also get anxious as markets decline and confess to occasional euphoria as they climb. I will maintain my discipline of selling stocks, even ones like this, if they do decline in the market to limit my losses. However, if we as investors can get a bit lucky and get ahead of the stock price we may be able to ride a stock higher as it grows hopefully for a very long time.
Thanks so much for stopping by and visiting my blog! If you have any comments or questions, please feel free to leave them right here.
Yours in investing.
Bob
Monday, 17 June 2013
Medtronic (MDT)
Hello Friends! Thanks so much for stopping by and visiting my blog, Stock Picks Bob's Advice! As always, please remember that I am an amateur investor, so please remember to consult with your professional investment advisors prior to making any investment decisions based on information on this website.
 One of my recent purchases for my Covestor Healthcare Model is Medtronic, Inc. (MDT). I purchased shares May 1, 2013, at an effective cost of $47.00. Medtronic closed at $53.51, up $.59 or 1.11% on the day (June 17, 2013). This is already a strong performer in my portfolio.
Being located in the midwest, I am always proud of America's most innovative companies originating in the 'heartland'. Medtronic is headquartered just north of Minneapolis in the city of Fridley.
Medtronic has a classic history of American innovation. As the Medtornic website relates:
 "Today, we are the world's largest medical technology company, but we come from humble beginnings. Medtronic was founded in 1949 as a medical equipment repair shop by Earl Bakken and his brother-in-law, Palmer Hermundslie.
Did these two men set out to change medical technology and the lives of millions of people? No. But they did have a deep moral purpose and an inner drive to use their scientific knowledge and entrepreneurial skills to help others."
According to the Yahoo "Profile" on Medtronic, the company
"...provides products to diagnose, treat, and manage heart rhythm disorders and heart failure, including implantable cardiac pacemakers, implantable cardioverter defibrillators, cardiac resynchronization therapy devices, arctic front cardiac cryoablation catheters, arctic front cardiac cryoablation catheters, and patient management tools. The company also offers cardio vascular products, such as percutaneous coronary intervention device that is used to treat  patients with coronary artery disease; renal denervation for the treatment of chronic uncontrolled hypertension; endovascular stent grafts to treat abdomen and thoracic regions of the aorta; peripheral vascular intervention that encompasses various procedures to treat patients with peripheral vascular disease; surgical valve replacement and repair products for damaged or diseased heart valves; transcatheter heart valves; a line of blood-handling products used in arrested heart surgeries; positioning and stabilization technologies that assist physicians performing beating heart surgery; and surgical ablation system, which allows cardiac surgeons to create ablation lines during cardiac surgery. In addition, it provides medical devices and implants that are used in the treatment of the spine and musculoskeletal system comprising thoracolumbar, cervical, and biologics products; neurostimulators for chronic pain, implantable drug delivery systems, and deep brain stimulation systems, as well as urology, fecal, and gastroenterology devices; and integrated diabetes management solutions. Further, the company offers products and therapies to treat diseases and conditions of the ear, nose, and throat, as well as certain neurological disorders; and image-guided surgery and intra-operative imaging systems."
Medtronic (MDT) has been a favorite on my blog. I first wrote up Medtronic on November 13, 2003 (excuse the typo on the entry that says incorrectly 2002). I then revisited this stock pick on November 29, 2009. One has to be impressed with the wide breadth of medical technology products coming out of this company and the continued innovation. In fact, in 2010 Medtronic was recognized by the Massachusetts Institute of Technology Review as one of the 50 most innovative companies in the world.
What really attracted me to the company last month was the strong technical strength of the stock as it began to clear past stock price 'highs' set in 2007 and 2008. As this StockCharts.com 'point & figure' chart shows, the company has had a superb performance since bottoming out at about $21 in March, 2009, and has moved strongly ahead, at first with a sharp correction in May, 2011.
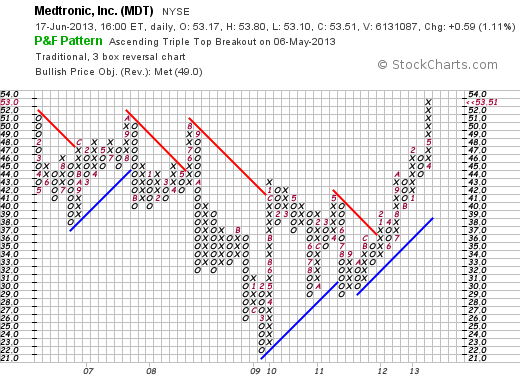
To be sure, Medtronic (MDT) has found itself embroiled in controversy over the years with the Medtronic Infuse scandal being typical as accusations of payments from Medtronic to investigators publishing review articles. In May, 2012, the Department of Justice closed their investigation of Medtronic without finding any wrongdoing in regards to the Infuse Bone Graft product. For the most part this 'overhang' of litigation that has suppressed the stock price, from my perspective, has been removed. However, trial attorneys are still seeking plaintiffs for continued litigation against the company. In any case, the above chart suggests that investors have breathed a collective sigh of relief with the Justice Department decision and the company stock appears to be continuing to appreciate to multi-year highs.
Part of the continued bump in the stock price has been the company's latest financial results. On May 21st Medtronic (MDT) reported 4th quarter results. Net income came in at $969 million, or $.96/share ahead of last year's $991 million or $.94/share. Sales also grew to $4.46 billion against last year's $4.3 billion. Adjusted earnings were $1.10/share ahead of analysts' estimated $1.03 in earnings. Sales also exceeded expectations of $4.38 billion. The company raised guidance for revenue to $17.1 billion to $17.3 billion in 2014 ahead of FactSet estimates of $16.9 billion.
Reviewing the Morningstar.com financials on MDT, we can see that Medtronic is continuing to grow its revenue with $13.5 billion reported in 2008 increasing to $16.2 billion in 2012 and $16.4 billion in the trailing twelve months (TTM). More recently the rate of revenue growth has decreased from rates of growth between 2008-2010.
Diluted earnings per share have grown from $1.95/share in 2008 to $3.41 in 2012 and a slight dip to $3.38 in the TTM. Outstanding shares have steadily decreased from 1.14 billion in 2008 to 1.03 billion in the TTM. Medtronic continues to actively buy back its own shares supporting some of the 'per share' results noted.
In terms of the balance sheet, Morningstar reports Medtronic with current assets of $9.5 billion, and current liabilities of $5.9 billion yielding a Current Ratio of 1.61. Medtronic has nicely grown free cash flow from $2.88 billion in 2008 to $3.97 billion in 2012 and $4.28 billion in the TTM.
Looking at some Key Statistics on Medtronic from Yahoo, we can see that this is a large cap stock with a market capitalization of $54.37 billion. The trailing P/E is a moderate 15.88 with a forward P/E (fye Apr 26, 2015) working out to 12.99. The PEG ratio, however, remains rich at 2.03 with only a modest growth in earnings expected.
Yahoo reports 1.02 billion shares outstanding with 1.01 billion that float. As of May 31, 2013, there were 10.64 million shares out short yielding a short interest ratio of only 2.0. (Under my own arbitrary 3 day rule for significance). The company pays a nice dividend of $1.04 yielding 2%. The payout ratio is a moderate 31% suggesting ample room for further dividend boosts. The last time the stock was split was back in September, 1999, when shareholders got a 100% stock dividend for a 2:1 stock split.
To summarize, Medtronic has over the past several years been embroiled in some controversy regarding research results and payments to investigators. The Justice Department has found no evidence of significant wrongdoing and has closed its case. The company meanwhile has continued to generate very large amounts of cash, using it to pay an increasing stock dividend and purchase back its own shares.
The company produces many innovative products spanning multiple fields of medicine from Orthopedics, to Cardiology to Nephrology. It is unnecessary to remind anyone that as our population ages and as more people in this country through the Affordable Care Act ('Obamacare") and overseas through growing middle class populations in nations like India and China find their access to healthcare improving, that purchases of medical devices by practitioners is likely to continue to grow.
Finally, after years of essentially going 'nowhere' the stock appears to be breaking out to multi-year highs and demonstrates strong price momentum. I liked this stock enough to buy some shares and thus far it appears to be a good decision. Like all of my purchases, I always reserve the right to sell any position on either technical or fundamental weakness, a discipline I believe is essential to success in investing.
Thank you so much for stopping by and visiting this website once again. If you have any comments or questions, please feel free to leave them right here.
Yours in investing,
Bob
Posted by bobsadviceforstocks at 10:44 PM CDT
|
Post Comment |
Permalink
Updated: Monday, 17 June 2013 10:47 PM CDT
Sunday, 9 June 2013
Tile Shop Holdings, Inc. (TTS)
Hello Friends! Thanks so much for stopping by and visiting my blog, Stock Picks Bob's Advice! As always, please remember that I am an amateur investor, so please remember to consult with your professional investment advisors prior to making any investment decisions based on this website.
 Last week I purchased shares of Tile Shop Holdings, Inc. (TTS) in my Covestor Growth and Momentum model. The shares were acquired on June 6, 2013, at a cost of $27.12/share. TTS closed at $28.78 on June 7th, 2013, for a gain of $1.66 or 6.12% on the day.
The Tile Shop appears to be benefiting from the housing rebound and the recent news of a rebound in the price of housing in the United States. A similar argument could made for Lumber Liquidators (LL) that I reviewed here previously and is a strong performer in my Covestor Growth and Momentum Model already. This same housing rebound is driving other stocks like Home Depot to all-time highs.
 According to the Yahoo Profile on Tile Shop Holdings, the company
"...operates as a specialty retailer of manufactured and natural stone tiles, setting and maintenance materials, and related accessories in the United States. It offers floor, wall, natural stone, ceramic, porcelain, glass, and metal tile products; tile patterns; basins; fixtures; listellos/borders; and profiles. The company also provides installation products consisting of heated floors, shower pans, tile threshold and edging products, sealants and caulks, tile maintenance and cleaning products, adhesives, substrates, and recessed shelves, as well as installation, cutting, and grout tools; and care and maintenance products. As of January 2, 2013, it operated 68 stores in 21 states."
On May 1, 2013, The Tile Shop (TTS) reported 1st quarter 2013 results. Net sales increased 23.9% to $56.8 million for the quarter ended March 31, 2013 up from $45.9 million in sales for the same quarter the prior year. Importantly, comparable store sales grew 10.4%, and sales in new stores added $6.2 million. Adjusted EBITDA grew 17.9% to $16.4 million, up from $13.9 million the prior year. However, going forward analysts have decreased their estimates for the next quarter to a profit of $.15 from $.16 and for the year estimates have dropped to $.51/share from $.55/share previously estimated.
Reviewing the Morningstar.com Financials on TTS, we can see that the data is limited as the company went public in 2012.The Tile Shop is not a new outfit as it dates back to 1985 when it opened its first shop in Rochester, Minnesota. In 1992, the company expanded outside of Minnesota and has continued to add stores and expand its business territory since.
The Morningstar report shows that the company increased its revenue from $183 million in 2012 to $194 million in the trailing twelve months (TTM). Earnings have actually decreased as the company is still losing money with $(1.31) reported in 2012, and $(2.61) reported in the TTM. The company has increased its float from 6 million shares in 2010 to 36 million in 2012 and 39 million in the TTM.
In terms of the Morningstar-reported balance sheet for TTS, the company has $72 million in total current assets and $36 million in total current liabilities yielding a current ratio of 2.0. The company is generating postive free cash flow as reported by Morningstar, with $18 million reported in 2012 and $12 million in the TTM.
In terms of some valuation numbers, referring to the Key Statistics on Yahoo for Tile Shop Holdings (TTS), Tile Shop Holdings is a small cap stock with a market capitalization of $1.53 billion. With a trailing loss, there is no P/E ratio, but going forward the PEG ratio (5 yr expected) is a bit rich at 2.26. There are 53.13 million shares outstanding with 20.35 million that float. As of May 15, 2013, there were 421,830 shares out short yielding a short interest ratio of 2.20. (This is below my own arbitrary 3 day rule for significance.) No dividends are paid and no stock splits are reported by Yahoo.
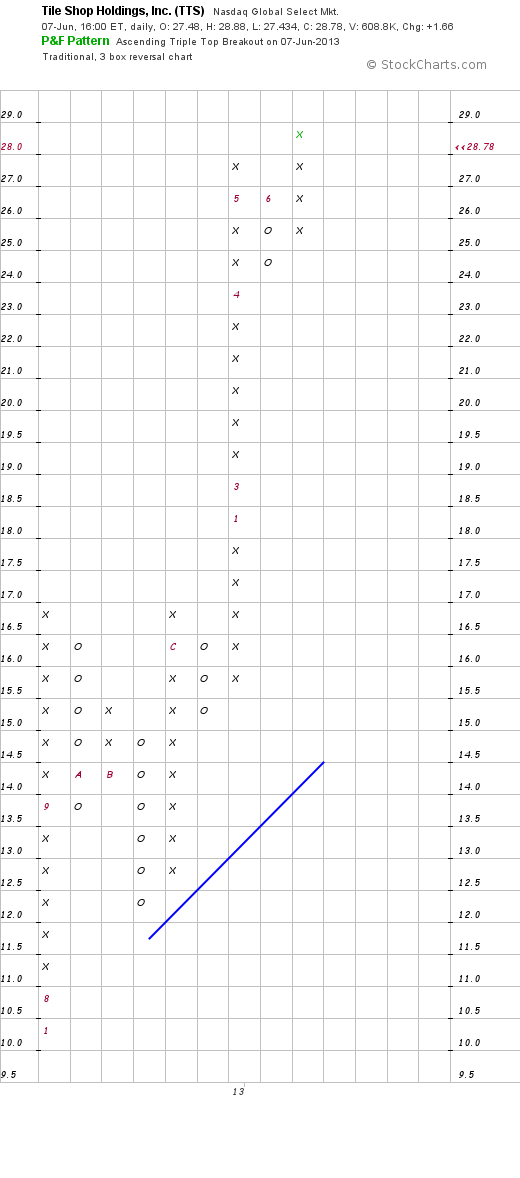
Looking at the 'point and figure' chart on Tile Shop Holdings (TTS) from StockCharts.com we can see a very strong but limited chart.
Reviewing some of the recent analyses on Tile Shop Holdings, Motley Fool published a nice article on this company's ability to play 'America's Housing Boom'. Josh Arnold also wrote a nice review of The Tile Shop on Seeking Alpha.
To summarize, I am a recent purchaser of Tile Shop Holdings (TTS) stock in my Covestor Growth and Momentum Model. This is a very small company that is growing quickly and participating in the rebound of real estate, especially housing in this country. This strategy has worked well with my purchase of Lumber Liquidators (LL) which also is involved in flooring but hardwood floors rather than tile sales. In general, I am a big advocate of identifying retail concepts that can be 'rolled out' from a small base to a larger number of stores in a broader geographic area. The fact that TTS has done so this past year with strong (10%+) same-store-sales growth is very encouraging.
On the negative side, the company is still losing money and even going five years out, the current valuation is a bit rich as estimated by the PEG ratio reported.
With the very strong chart and technical strength and with a 'story' that is quite compelling, I added a position to my own holdings and am optimistic that this will prove to be a good move. Like any of my purchases, if the stock incurs a loss, I shall be quick to part company regardless of my belief in the long-term outlook.
Thank you so much for stopping by and visiting. If you have any comments or questions, please feel free to leave them right here.
Yours in investing,
Bob
Saturday, 30 March 2013
Lumber Liquidators (LL)
Hello Friends! Thanks so much for stopping by and visiting my blog, Stock Picks Bob's Advice! As always, please remember that I am an amateur investor, so please remember to consult with your professional investment advisers prior to making any investment decisions based on information on this website.
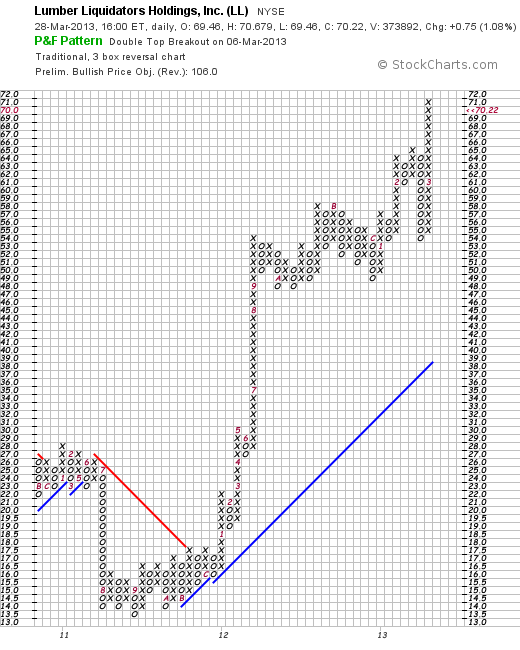
 Lumber Liquidators represents the strongest holding in my Covestor "Growth and Momentum" model. (This model was formerly called "Buy and Hold Value" but was renamed to reflect the underlying strategy more accurately.) I first purchased shares of Lumber Liquidators (LL on June 26, 2012 at a cost of $32.46 and subsequently took some profits by selling a few shares on September 11, 2012 at $48.13 and again sold a few shares at $65.25 on March 8, 2013. Lumber Liquidators (LL) closed at $770.22, up $.75 or 1.08% on the day on March 28, 2013.
Examining the 'point & figure' chart on LL from StockCharts.com, we can see the initial sell-off in shares from $24 in July, 2011, to a low of $13.50 in October, 2011. The stock took off in December, 2012, spiking to $53/share in September, 2012 and has steadily built on that climb since that time.
According to the Yahoo "Profile" on Lumber Liquidators (LL), the company
"...operates as a specialty retailer of hardwood flooring, and hardwood flooring enhancements and accessories. The company provides various wood flooring products, including prefinished domestic and exotic hardwoods,  engineered hardwoods, unfinished hardwoods, bamboo, cork, and laminates, as well as resilient flooring products. It also offers flooring enhancements and installation accessories comprising moldings, and noise-reducing underlays and tools. The company markets its products to homeowners or to contractors under the brand name of Bellawood through its integrated sales channels, such as stores, a call center, and a catalog, as well as through its Website, lumberliquidators.com. As of December 31, 2012, it operated 279 retail stores in the United States; and 9 retail stores in Ontario, Canada."
After a long period of weakness, the real estate market in America is starting to rebound and recent housing starts reports are encouraging. Companies that are involved in housing construction and renovation appear to be 'on a roll' and these include stocks like Home Depot (HD) and Beacon Roofing (BECN) among others that have shown tremendous price strength. I do not currently own shares of HD or BECN.
On February 20, 2013, Lumber Liquidators announced earnings for the quarter ended December 31, 2012. As the Motley Fool site reported, the company reported revenue of $210.7 million, beating expectations of $197.4 million. These sales were up by 21% over the prior-year same quarter result of $174.5 million.
Earnings came in at $.50/share and were also easily ahead of expectations of $.43/share. The GAAP earnings of $.50 were also ahead of the prior year's results of $.30/share by 67%. Certainly strong growth in financial results that are also ahead of what analysts are expecting are a good sign from my perspective for a stock that might be appreciating in price going forward to 'adjust' for the new financial results. And the stock did exactly that!
Reviewing the Morningstar.com '5-Yr Financials' on Lumber Liquidators (LL), we can see that the company has been steadily growing revenue results from $482 million in 2008 to $813 million in 2012. Earnings during this period have grown nicely from $.82/share in 2008 to $1.68/share in 2012, although growth in earnings was relatively stagnant between 2009 and 2011. Outstanding shares have been very stable with 27 million fully diluted shares according to Morningstar in 2008 and and increase to 28 million by 2012.
Looking briefly at the Morningstar-provided balance sheet reveals the company with $288 million in total current assets balanced against $101 of total current liabilities yielding a current ratio of 2.85. From my perspective a current ratio of over 1.0 is adequate and over 2.0 quite 'healthy' in terms of the ability to meet current cash needs to pay liabilities.
Morningstar reports that free cash flow has also been improving recently with $2 million reported in 2008, dipping to $(4) million in 2010 and then improving to $27 million in 2011 and $34 million in 2012.
Financially, the latest 'good results' reported in the latest quarter do not appear to be an unusual or exceptional development. The company has been doing a good job growing revenue and earnings, free cash flow, and maintaining a healthy balance sheet.
In terms of valuation, we can see from the Yahoo "Key Statitstics" on Lumber Liquidators (LL) that with a market capitalization of $1.91 billion, this is a small cap stock. (For comparison, we can see that Home Depot (HD) has a market cap of $103.2 billion, more than 50x the size of Lumber Liquidators).
Lumber Liquidators (LL) has a trailing p/e that is certainly 'rich' at 41.80 and even with the rapid growth expected, the forward P/E (fye Dec 31, 2014) still comes in at 27.01. Thus the PEG works out to a fairly rich 2.18. (I generally prefer to pay up to a PEG of 1.5 for a stock.)
Yahoo reports that there are 27.16 million shares outstanding with 25.84 million that float. As of February 28, 2013, there were 4.17 million shares out short representing a short interest ratio of 5.4 days of average trading volume, ahead of my own '3 day rule' for significance. A large short interest ratio may be a bullish indicator if the company actually reports an unexpected piece of good news forcing the short sellers to buy shares in a 'squeeze'.
The company does not pay a dividend and no stock splits are reported on Yahoo.
To summarize, the American economy has been in a 'funk' for several years since the financial crisis of 2008. With Congress in a stalemate unable toact to provide a fiscal stimulus, Ben Bernanke and the Federal Reserve have been utilizing quantitative easing and associated monetary policy to keep interest rates low and encourage economic activity. With economic weakness and an accomodative Federal Reserve, rates have stayed low and one of the key beneficiaries of this policy has been the housing market which indeed is starting to come alive.
Lumber Liquidators (LL) is sitting in the middle of this rebound and is a company and a stock that has been helped by the real estate mini-boom developing.
Thank you for visiting my blog! If you have any comments or questions, please feel free to leave them right here!
Yours in investing,
Bob
Posted by bobsadviceforstocks at 2:43 PM CDT
|
Post Comment |
Permalink
Updated: Saturday, 30 March 2013 2:45 PM CDT
Sunday, 24 March 2013
Valeant Pharmaceuticals International, Inc. (VRX)
Hello Friends! Thanks so much for stopping by and visiting my blog, Stock Picks Bob's Advice! As always, please remember that I am an amateur investor, so please consult with your professional investment advisers prior to making any investment decisions based on information on this website.
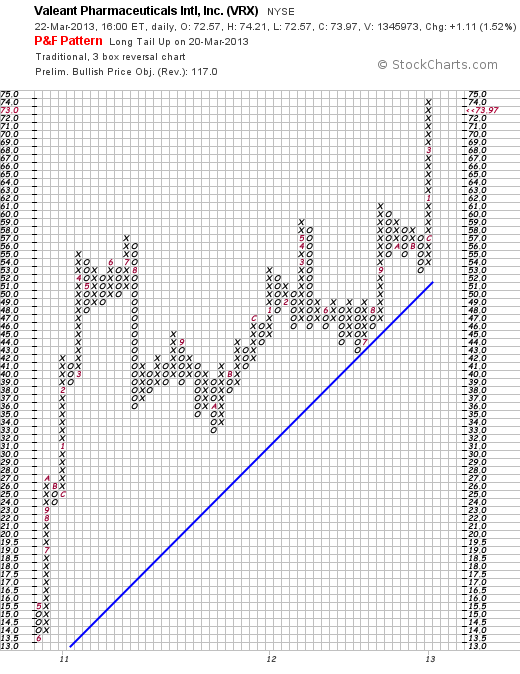
 Valeant Pharmaceuticals (VRX) is a holding of mine in the Covestor "Sustained Momentum" model. In fact, it is the strongest performing stock withing that eleven stock model. On December 27, 2011, I purchased shares of Valeant (VRX) at a cost of $46.93/share in this account. VRX closed at $73.97/share, up $1.11 or 1.52% on the day on March 22, 2013.
My "Sustained Momentum" Model is based on my Marketocracy "RMF Fund" that is a simulated fund that I have been 'managing' since 2004. Valeant is the number one holding in that simulation having appreciated 135.16% since being included in that stock market game model. I have literally used my stock market simulation portfolio to build a real portfolio on Covestor. I currently am populating my "Sustained Momentum" model on Covestor with the top eleven of my Marketocracy holdings.
Let's take a closer look at Valeant (VRX) which has led the Sustained Momentum Model to a strong performance since inception.
According to the Yahoo "Profile" on Valeant (VRX), the company
"...develops, manufactures, and markets pharmaceutical products and medical devices in the areas of neurology, dermatology, and branded generics. It offers dermatology products, such as Zovirax Ointment, Xerese, Retin-A Micro, Elidel, Carac, Acanya gel, Sculptra and Sculptra Aesthetic, Atralin, Solodyn, Zyclara, Ziana, Vanos, Restylane family of products, and Dysport; over-the-counter (OTC) products, including CeraVe and  AcneFree; dentistry products, such as Arestin and Teeth Whitening System; ophthalmology products, including Timoptic, Timoptic, Macugen, and Visudyne; and neurology and other products, such as Wellbutrin XL and Xenazine in the United States. The company also provides pharmaceutical products, including Tiazac XC, Wellbutrin XL, Zovirax, Benzaclin, and Penlac; and Cold-FX, an OTC product in Canada, as well as Duromine/Metermine, Difflam, Duro-Tuss, and Rikodeine in Australia. In addition, it offers a range of treatments, including antibiotics, treatments for cardiovascular and neurological diseases, dermatological products, and diabetic therapies, as well as a range of various OTC products in Europe; and products for a range of therapeutic classes, including vitamin deficiency, antibacterials, and dermatology in Mexico and Brazil. Further, the company provides Duromine, Andolex, and Pholtex products in South Africa; and Difflam, Duro-Tuss, Tambocor, and Norgesic in Asia."
The history of Valeant (VRX) dates back to the 1990's when its forerunner company ICN Pharmaceuticals was in business, founded by Milan Panic. In 2002 ICN changed its name to Valeant Pharmaceuticas (VRX). Since that time Valeant has acquired other pharmaceutical companies including Tecnofarma in 2009, Aton Pharma in 2010, Vital Science Corp. in 2010, and Instituto Branded Generics in Brazil in 2010. Other acquisitions included iNova, Dermik, Sanitas Group, Dermik, and PharmaSwiss S.A. in 2011, Medicis Pharma, OraPharma, Pedinol, Natur Produkt in Russia, and Probiotica in Brazil in 2012. More recently, on March 21, 2013, Zacks reported on Valeant's acquisition of Obagi Medical Products, Inc. (OMPI) for $19.75/share. The Obagi acquisition should be accretive to earnings according to Valeant, and adds to the company's dermatologic products.
Valeant reported fourth quarter 2012 results on March 1, 2013. According to Zacks, the $1.21/share reported came in shy of estimates of $1.25/share but still represented a very strong growth from the $.90/share reported the prior year same period. Revenue for the quarter came in at $986 million, up 43% from the prior year. This was due to 'higher product sales' and beat the Zacks estimate of $959 million. For the full year of 2012, revenues came in at $3.55 billion, up 44% from the prior year and beat consensus estimates of $3.51 million. Earnings for the year of $4.42/share were shy of the Zacks Consensus Estimate of $4.47 but still were 61.9% (!) higher than the prior year.
Valeant reaffirmed strong sales guidance of $4.4 to $4.8 billion in revenue for 2013 representing a 30% increase and earnings per share are projected to come in between $5.45 to $5.75/share.
Reviewing the Morningstar.com "5 Years Financials" on Valeant (VRX), we can see that revenue has grown strongly with $757 million reported in 2008, increasing to $3.55 billion by 2012. Diluted earnings per share have actually dipped from $1.25/share reported in 2008 to a loss of $(.38)/share in 2012. Diluted shares have grown from 160 million in 2008 to a peak of 326 million in 2011 before dipping slightly to 305 million in 2012.
The Morningstar site reports that VRX has $2.78 billion in current assets as of the close of 2012, with $1.8 billion of current liabilities generating a current ratio statistic of 1.5 still quite healthy from my perspective. The company has improved its free cash flow from $182 million in 2008 to $475 million in 2012.
In terms of valuation, looking at the Yahoo "Key Statistics" on Valeant, we can see that this company is a large cap stock with a market capitalization of $22.6 billion. With losses reported there is no P/E or PEG to analyze. There are currently 305.76 million shares outstanding and 268.51 million that float. There are 6.52 shares out short as of 2/28/13, representing a short interest ratio of 5.9 days. (This is significant from my perspective as I arbitrarily use 3 days as a cut-off.) No dividends are paid and the last stock split was in October, 2000.
Probably one of the most impressive parts of this particular investment is the price chart of this stock! Looking at the 'point & figure' chart on Valeant (VRX) from StockCharts.com, we can see the price climbing sharply from a low of $13.50 in June, 2010, to a high of $56 in July, 2011, before3 slipping back to consolidate in the $35 range in October, 2011, before once again starting to climb to its current level of $73.97. If anything the price appears technically a bit over-extended but still a very strong chart from my amateur perspective.
To summarize, Valeant (VRX) has been assembled over the past 10-15 years from a variety of pharmaceutical companies including the former ICN Pharma and Biovail corporations. Management has done what appears to be a superb job of fitting these pieces together and they have grown revenue and earnings (at least adjusted earnings) at an impressive pace. They do not appear to be done adding the pieces to this puzzle but the picture they have been creating has been a good one, at least thus far, for this investor!
Thank you very much for stopping by and visiting my blog! If you have any questions or comments please feel free to leave them here on this website.
Yours in investing,
Bob
Saturday, 16 March 2013
CareFusion (CFN)
Hello Friends! Thanks so much for stopping by and visiting my blog Stock Picks Bob's Advice! As always, please remember that I am an amateur investor, so please remember to consult with your professional investment advisers prior to making any investment decisions based on information on this website.
 On February 1, 2013, I purchased shares of CareFusion (CFN) at a cost of $31.43 for my Healthcare Covestor Model. CareFusion closed at $34.31 on March 15, 2013, so thus far it has been a good move. Let's take a look 'under the hood' on this stock and see if it makes sense for this blog and for my own portfolio.
First of all, according to the Yahoo "Profile" on CFN, the company
"... operates in two segments, Medical Systems and Procedural Solutions. The Medical Systems segment develops, manufactures, and markets capital equipment and related supplies for medication management. It offers IV medication safety and infusion therapy  delivery systems, including dedicated disposables, software applications, and related patient monitoring equipment; automated dispensing machines and related applications for distributing and managing medication and medical supplies; and respiratory ventilation equipment and dedicated circuits for respiratory therapy, as well as develops data mining surveillance software that enables hospitals to identify adverse drug events and healthcare associated infections. This segment provides its products under the Alaris, Pyxis, Rowa, AVEA, Vela, and LTV Series brands. The Procedural Solutions segment develops, manufactures, and markets single-use skin antiseptic products and other patient-preparation products; hair-removal and skin-care products, and non-dedicated disposable IV infusion administration sets and accessories; surgical instruments; interventional specialty products, such as diagnostic trays and biopsy needles, drainage catheters, and vertebral augmentation products; and non-dedicated disposable ventilator circuits and oxygen masks used for providing respiratory therapy."
In other words, this company supplies hospital and medical clinics supplies for delivery of pharmaceuticals and patient care.
Let's take a look at their latest quarterly results. On February 7, 2013 CareFusion (CFN) reported their 2nd quarter results. Revenue for the second quarter came in $909 million, up 2% from the $890 million reported the prior year same period. Operating income grew 20% to $171 million from the $143 million reported the prior year. Income from continuing operatings came in at $108 million or $.48/share. The 'adjusted income' from continuing operatings increased 9% to $121 million or $.54/diluted share. These are reasonably good results but what about longer-term?
Reviewing the Morningstar.com "5-Yr Financials" on CFN, we can see that revenue has actually decreased from $4.5 billion in 2008 to $3.5 billion in 2011, and now has started increasing to $3.6 billion in 2012 and $3.62 billion in the trailing twelve months (TTM). Diluted earnings/share however, have shown strong growth with $.87/share reported in 2007 increasing strongly to $1.30/share in 2012 and $1.42/share in the TTM. Outstanding shares have been stable with 223 million shares outstanding in 2010 and 225 million shares in the TTM. Thus while revenue has decreased over the last 5 years, the company has been becoming more profitable with rapidly increasing earnings while revenue has been turning around as well.
In terms of their 'balance sheet', the Morningstar.com site shows that the company has $3.1 billion in total current assets as opposed to $933 million in total current liabilities yielding a current ratio of over 3.0. The company appears to be quite solvent.
Morningstar.com reports that the CareFusion's free cash flow has ranged from $563 million in 2010, dipped to $177 million in 2011, and increased back to $545 million in 2012.
In terms of valuation, this company is a mid cap stock with a market capitalization of $7.64 billion according to the Yahoo"Key Statistics" on CFN. The trailing p/e is a moderate 24.01, the forward p/e (fye June 30, 2014) is estimated at 14.18, yielding a reasonable PEG of 1.41. Yahoo reports 222.59 million shares outstanding with 222.04 million that float. As of February 28, 2013 there were 2.21 million shares out short yielding a relatively insignificant (from my perspective) short interest ratio of 1.10. The company does not pay a dividend and there is no record of a stock split on Yahoo.
And how has the stock price been doing? Examining the 'Point and Figure' chart on CFN from StockCharts.com, we can see that the stock experienced a sharp decline from $35 in July, 2007 to a low of $15 in March, 2009. Since that low, the stock has moved higher, consolidating at around $25 between Novembe, 2009, until August, 2012. More recently the stock has been moving higher heading back towards the $35 range.
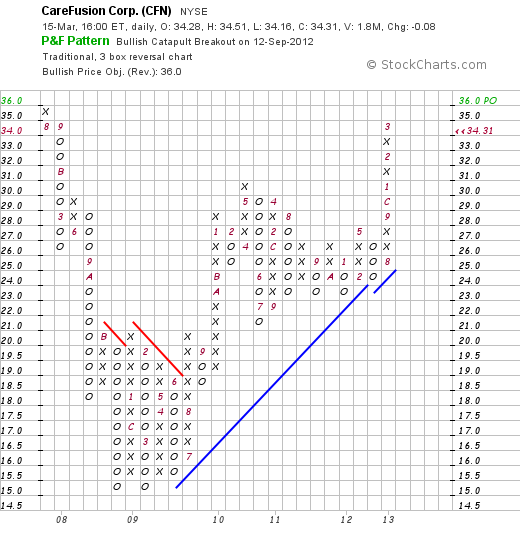
CareFusion (CFN) has been enjoying a strong stock performance as part of a very strong Healthcare Sector. Thus far the stock has been performing well within my own portfolio and hopefully the stock's momentum both technically and fundamentally will lead the stock price higher in the future.
Thanks so much for stopping by and visiting my blog! If you have any comments or questions, please leave them here.
Yours in investing,
Bob
Posted by bobsadviceforstocks at 4:57 PM CDT
|
Post Comment |
Permalink
Updated: Saturday, 16 March 2013 5:33 PM CDT
Friday, 4 January 2013
FleetCor Technologies (FLT)
Hello Friends! Thanks so much for stopping by and visiting my blog, Stock Picks Bob's Advice! As always, please remember that I am an amateur investor, so please consult with your professional investment advisers prior to making any investment decisions based on information on this website.
I would like to apologize to my friends and readers for my long hiatus here on this blog. I am definitely an amateur blogger and know that successful blogging requires a consistent post or two. If I can make this a New Year's resolution.... That being said, I wish all of you a happy and healthy 2013.
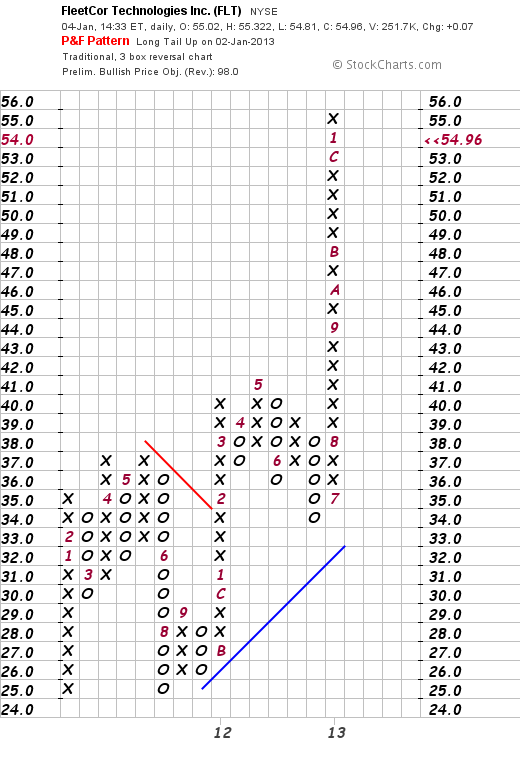
 One of the strongest holdings in my Covestor 'Buy and Hold' Value model is my position in FleetCor (FLT). I purchased shares of FLT on September 12, 2012 at a price of $44/share. Today (1/4/13) FleetCor is trading at $55.05, up $.16 or .29% on the day. Let's take a closer look at this investment and try to understand what it does, how it's doing, and what kind of valuation this stock price represents.
According to the Yahoo "Profile" on FleetCor, the company...
"...provides specialized payment products and services to businesses, commercial fleets, oil companies, petroleum marketers, and government entities in North America, Europe, South Africa, and Asia. It sells a range of customized fleet and lodging payment programs; and offers various card products to purchase fuel, lodging, and related products and services at participating locations. The company also offers prepaid fuel and food vouchers and cards, as well as a telematics solution that enables fleet operators to monitor the capacity utilization and movement of vehicles and drivers."
First of all let's take a look at the latest quarter. Zacks reported on their 3rd quarter results on November 9, 2012. Revenues for the quarter came in at $186.9 million, up 32% over the prior year same quarter. Revenue growth largely was due to international results which climbed 107.3% year over year, and moderate growth domestically, up 9.1% year over year.
Adjusted earnings came in at $.83/share, up 48% from $.56/share the prior year and exceeding the Zacks Consensus Estimate by 20.1%. The company also raised revenue guidance for 2012 to $678-$682 million from prior guidance fo $665-$675 million.
In terms of longer-term results, reviewing the Morningstar.com '5 Years Financials', we can see that revenue has grown steadily from $341 million in 2008 to $520 million in 2011 and to $645 million in the trailing twelve months (TTM). Net income has improved from, $97 million in 2008 to $147 million in 2011 and $194 million in the TTM. On a diluted earnings per share basis, Morningstar reports FLT reported $1.34/share in 2010, $1.76 in 2011, and $2.27/share in the TTM. Outstanding shares were 81 million in 2010 and have grown slightly to 85 million in the TTM.
Looking briefly at their balance sheet on Morningstar, we can see that the company as of December 2011, had $1,123 million in total current assets compared to $1,122 in total current liabilities giving it a current ratio of just over 1.0.
Free cash flow has improved from $52 million in 2008 to $266 million in 2011 and dipped to $224 million in the TTM.
Looking at Yahoo "Key Statistics" for some valuation numbers, we can see that this is a Mid Cap Stock with a market capitalization of $4.65 billion. The company sports a moderate trailing P/E of 24.22 and a forward P/E of 16.62. With rapid growth estimated the PEG Ratio (5 yr expected) comes in very reasonably at 1.15. Yahoo reports the company with 84.53 million shares outstanding with only 56.62 million that float. There are 1.84 million shares out short as of 12/14/12, resulting in a 'Short Ratio' of 2.20, under my own arbitrary 3 day level for significance. The company does not pay a dividend.
In terms of technical strength, looking at the StockCharts 'Point & Figure' chart on FLT, we can see that FleetCor (FLT) which has a trading record since 2011, has fairly steadily increased its price from $25 to its current level of $55 where if anything it appears a bit over-extended short-term.
As the economy rebounds from the recession, the trucking industry is also rebounding. Recently, one of my favorite sources for new ideas for stocks has been the Monday Edition of the IBD which lists the Investor's Business Daily top 50 stocks. Not every stock on that list meets my own requirements for inclusion. However, FleetCor (FLT) has been an IBD 50 favorite for some time and the underlying strong earnings growth and revenue record, reasonable valuation, and strong technicals along with sitting in a rebounding industry make it very attractive.
Thank you for your continued interest and loyal readership. If you have any questions or comments, please feel free to leave them right here.
Yours in investing,
Bob
Newer | Latest | Older


