


Hello Friends! Thanks so much for stopping by and visiting my blog, Stock Picks Bob's Advice. As always, please remember that I am an amateur investor, so please remember to consult with your professional investment advisors prior to making any investment decisions based on information on this website.
 Looking through the list of top % gainers on the NASDAQ today, I came across NutriSystem (NTRI), which as I write, is trading at $26.63, up $1.61 or 6.43% on the day in an otherwise 'sloppy' market. I do not own any shares nor do I have any options on this company.
 According to the Yahoo "Profile" on NTRI, the company "...and its subsidiaries provide weight management and fitness products and services. The company's weight management program consists of support for dieters and a prepackaged food program."
On July 27, 2005, NTRI announced 2nd quarter 2005 results. Revenue climbed 346% to $40.9 million in the second quarter ended June 30, 2005, compared with $9.2 million the prior year same quarter. Net income climbed to $4.3 million from $.8 million last year, and on a per diluted share basis this worked out to $.12 this year, compared with $.02/share last year.
How about longer-term? Taking a look at the "5-Yr Restated" financials from Morningstar.com, we can see that revenue was actually very flat between 2000 and 2003 when it grew from $20.2 million to $22.65 million. However, since then, revenue has been climbing...first to $38 million in 2004 and now $93.9 million in the trailing twelve months (TTM).
Earnings have also been a bit erratic, improving from a loss of $(.50)/share in 2000, increasing only to $.03/share in 2004, and now to $.20/share in the TTM.
Free cash flow, which was small and fluctuating, with $3 million in 2002, dropping to $(2) million in 2003, and $2 million in 2004, has now improved to $6 million in the TTM.
The balance sheet is superb with $37.7 million reported in cash, enough to cover both the $9.3 million in current liabilities AND the $.4 million in long-term liabilities almost four times over. In addition, Morningstar reports the company with an additional $15.8 million in other current assets.
 Looking at Yahoo "Key Statistics" on NTRI, we can see that this is a mid cap stock with a market capitalization of $805.98 million. The trailing p/e is huge at 123.63, but the company is just turning profitable in a big way....thus the forward p/e (fye 31-Dec-06) is estimated at 38.52. Thus, the PEG (5 yr expected) isn't that bad at 1.65.
 Looking up the price/sales comparisons for NTRI in the Fidelity.com website, we find that NTRI is the "priciest" of the industrial group "Business Services". (That streams like a strange place for a diet food company....?) NTRI tops out the group with a price/sales ratio of 9.3, followed by Global Payments (GPN) at 4, Equifax (EFX) at 3.4, Cintas (CTAS) and Certegy (CEY) at 2.3, and IPAYMENT (IPMT) at 1.3.
Looking at some other numbers on Yahoo, we can see that the company has only 34.09 million shares outstanding. There were 3.35 million shares out short as of 9/12/05 representing 11.70% of the float or 7.3 days of average volume (the "Short Ratio"). Thus, using my 3 days of volume as a cut-off, this appears significant, and we may be seeing a bit of a "squeeze" on the short sellers who may be hustling to find some shares to purchase to close out their position.
No cash dividend and no stock dividend are reported on Yahoo.
What about a chart? Looking at a "Point & Figure" chart on NTRI from Stockcharts.com:
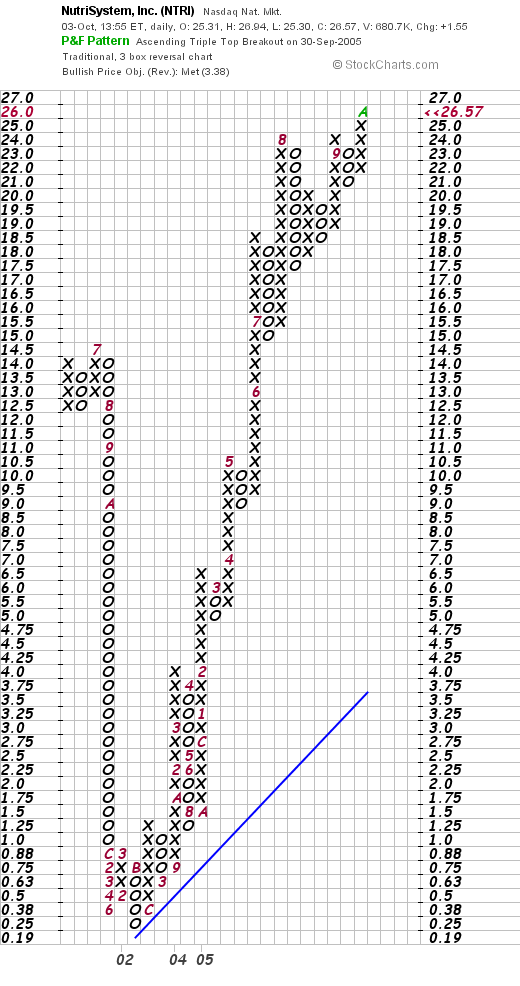
We can see the picture of an extremely volatile stock which plunged in price from $14.50 in July, 2001, bottoming at $.38/share in June, 2002, and then climbing steadily and strongly to its current level. In conjunction with knowing the current earnings picture and apparent company turn-around, this chart looks very strong to me. So what do I think? Well, the last quarter's result was phenomenal! If the company can maitain any sort of the momentum from this rate of growth, the stock might just move higher. However, valuation is a bit rich, with a p/e over 100. However, the PEG is just slightly elevated, and again, if the company can grow its earnings ever so much, valuation will quickly fall into place. Otherwise, the rest of Morningstar looks nice for NTRI with growing earnings, free cash flow, and a healthy balance sheet. To top it off the chart looks nice as well. Now, if I only was under 24 positions, I might be nibbling on this one :(. In the meantime, I shall stay sitting on my hands so to speak and hold off any purchases.
Thanks again for stopping by and visiting. If you have any comments or questions, please feel free to leave them on the blog or email me at bobsadviceforstocks@lycos.com.
Have a wonderful week everyone!
Bob