


Hello Friends! Thanks so much for stopping by and visiting my blog, Stock Picks Bob's Advice. As always please remember that I am an amateur investor, so please remember to consult with your professional investment advisors prior to making any investment decisions based on information on this website.
One of the things I like to do on this blog is to share with you my actual trades in my trading account. I do this to help you understand that what I talk about are things that I actually implement, to provide you with an insight on my strategy and the successes or failure associated with them. I do not post them so that you can copy my trades; in fact, I would discourage that, but instead hopefully you will learn to pick stocks and invest in ways that are most suitable for you!
My own strategy of selling stocks includes selling portions of the stocks I own as they appreciate in price. I like to say that I like to sell losing stocks quickly and completely, and sell gaining stocks slowly and piecemeal.
I have adjusted my selling program to sell only 1/6th of my holding (instead of the previous 1/4 postion) at each of my targeted appreciation points. When I worked on the mathematics behind this, by simply setting up a theoretical position, I found that as I suspected, if I continued selling 1/4 of my position, then the position would gradually dwindle in size. Selling 1/6th left the position intact for multiple sell points.
Currently my targeted appreciation points, which are clustered in groups of four, are at 30, 60, 90 and 120%; and then by 60% intervals: 180, 240, 300, and 360%; and then by 90% intervals: 450, 540, 630, 720, and then by 120% intervals, etc. At each of these points, I plan on selling 1/6 of my remaining shares of the stock in question. I haven't hit all of those higher points, but I have sold shares of QSII at a 450% appreciation level. These sale points are not entirely theoretical.
I recently had an email by a reader who asked about how I monitored my stocks and implemented sales. I am sure there are much better ways than what I do, but I just simply look at my holdings, and my Fidelity account allows me to see the percentage gainers as well as the previous sales on each holding. I do the 'mental math' figuring out the # of sales and the % targeted gain, and usually can easily figure out when it is time to sell.
 In fact earlier this morning, in spite of the weak market, my Starbucks (SBUX) stock hit a sale point. I had 70 shares remaining in my portfolio, so rounding down 1/6 of 70, worked out to 11 shares. And I sold 11 shares this morning at $31.95. These shares had been purchased 1/24/03, slightly before I started by blog, at a cost basis of only $11.40/share. Thus, I had a gain of $20.55 or 180.3% on the investment. This was my fifth sale of Starbucks, having sold shares 9/8/03, 1/23/04, 6/18/04, and 12/03/04. Thus, having sold at the 30, 60, 90, and 120% level of appreciation, my target was a 180% level, and the stock just hit that target! You will note that instead of selling 1/4 of my position, I only sold 1/6th!
What will be my next sale point on SBUX? Assuming the stock does not announce some fundamentally bad news, that would push me to arbitrarily sell the shares, I will be selling 1/6th of my position on the upside if the stock hits a 240% gain....which would amount to 3.4 x $11.40 = $38.76. If the stock should decline, I plan on selling ALL of the remaining shares at 50% of the highest gain, that is at a 90% appreciation point = 1.9 x $11.40 = $21.66.
Going a bit further, since I am under my 25 position maximum, even though the market is in a bit of a funk as I write, (the Dow is down 57.14 at 10,820.37, and the NASDAQ is down 18.41 at 2,254.96), this sale gives me permission to add a position. And there are almost always candidates to purchase that fit my strategy :).
With that nickel burning a hole in my pocket I went right away over to the percentage gainers lists. Looking through the list of top % gainers on the NASDAQ, I recognized a stock that I had reviewed previously. Dynamic Materials (BOOM) was reviewed on Stock Picks Bob's Advice on May 23, 2005. I went ahead and purchased 240 shares of BOOM for my trading account at $28.27 a short while ago. As I write this, BOOM is trading at $28.84, up $4.69 or 19.42% on the day.

Let's briefly review some of the recent information on BOOM and I will show you why I think it fits my strategy!
First the Yahoo "Profile" on Dynamic Materials:
Dynamic Materials Corporation engages in metalworking business in North America, western Europe, Australia, and the Far East. The company operates in two segments, Explosive Metalworking and Aerospace. The Explosive Metalworking segment utilizes explosives to perform metal cladding and shock synthesis. Its principal product is a explosion welded clad metal plate, which is used in the construction of heavy, corrosion resistant pressure vessels, and heat exchangers for petrochemical, refining, and hydrometallurgy industries. The Aerospace segment provides welding services principally to the commercial and military aircraft engine markets, and to the power generation industry.And the news on Boom: As reported today:
CHICAGO, Dec 5 (Reuters) - Metalworking company Dynamic Materials Corp. (BOOM.O: Quote, Profile, Research) on Monday said its AMK Welding division has entered a five-year supply agreement with General Electric Co. (GE.N: Quote, Profile, Research) , sending shares to an all-time high.Clearly the street liked this piece of good news and the stock charged higher in the face of an overall weak equity market!
And the last quarter result? (even without this news): On November 8, 2005, BOOM reported 3rd quarter 2005 results. Revenue came in at $20.2 million, up 68% from last year's $12.1 million. Profit came in at $3.15 million or $.52/share, compared with $834,000 or $.16/share the prior year. This is a growth of over 200% in net income!
And the Morningstar results? Looking at the "5-Yr Restated" financials on BOOM from Morningstar.com, we can see an almost perfect (except for a dip from 2002 to 2003), growth in revenue from $24.3 million in 2000 to $76.1 million in the trailing twelve months (TTM).
Earnings have been erratic, dropping from $.27 in 2001 down to a loss of $(.06) in 2003, then increasing to the current $.79/share in the TTM.
Free cash flow has remained positive with $4 million reported in 2002, $2 million in 2003, $3 million in 2004 and $4 million reported in the TTM.
The balance sheet, as reported by Morningstar.com, looks solid with $1.4 million in cash and $29.2 million in other current assets, easily covering both the $12.0 million in current liabilities and the $6.8 million in long-term liabilities.
And a chart? Looking at a "Point & Figure" chart on BOOM from Stockcharts.com:
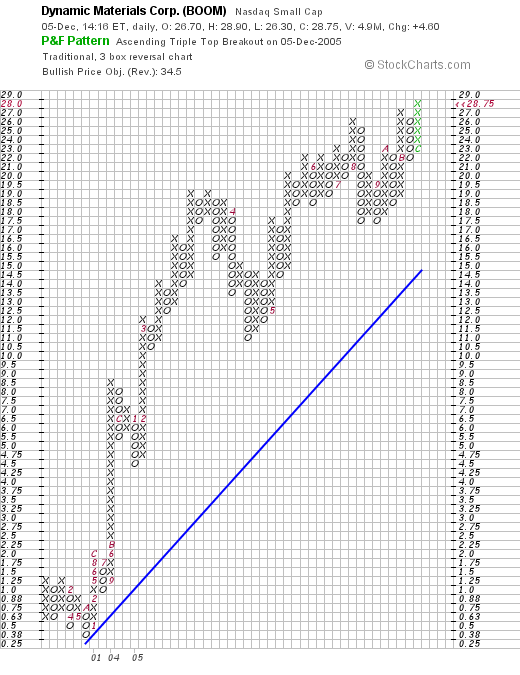
We can see a very strong stock chart with the stock price dipping to $.38/share in November, 2000, then climbing steadily and dynamically to the current $28.75 level.
Anyhow, I sold some SBUX and picked up some shares of BOOM. The rest is all of the details :).
Thanks again for stopping by! Please write me at bobsadviceforstocks@lycos.com or just write a note on the blog! Hope that you have a great week!
Bob