Hello Friends! Thanks so much for stopping by and visiting my blog, Stock Picks Bob's Advice. As always, please remember that I am an amateur investor, so please remember to consult with your professional investment advisors prior to making any investment decisions based on information on this website.
 Looking through the list of top % gainers on the NASDAQ today, I came across Metrologic (MTLG) which had a great day, closing at $23.57, up $3.41 or 16.91% on the day.
Metrologic is an old favorite of mine on this blog, having written up MTLG on Stock Picks Bob's Advice on July 2, 2003, when it was trading at $35.60. MTLG has split twice since posting, first with a 3:2 split on July 7, 2003, and then a 2:1 split on October 31, 2003. Thus, the effective 'pick price' is actually $35.60 x 2/3 x 1/2 = $11.87/share. Thus, the stock has an actual appreciation of $11.70 or 98.6% since posting!
What drove the stock higher today, was the announcement of 4th quarter 2005 results after the close of trading yesterday. Sales for the quarter ended December 31, 2005 increased 14.8% to $61.0 million compared with $53.1 million for the same period in the year earlier. Net income for the quarter was $9.0 million, or $.39/fully diluted share, compared with net income of $8.7 million or $.38/diluted share the prior year. Although only a small growth in earnings, the results are still positive with both revenue and earnings growing.
Let's take a closer look at this company. First of all, as to their business, the Yahoo "Profile" on Metrologic Instruments reports , shows that the company
"...together with its subsidiaries, engages in the design, manufacture, and marketing of bar code scanning and high-speed automated data capture systems using laser, holographic, and vision-based technologies."And how about longer-term financial results?
Reviewing the Morningstar.com "5-Yr Restated" financials, we can see that revenue which was $116 million in 2002, has grown each year to $178 million in 2004 and $203 million in the trailing twelve months (TTM).
Earnings, which were erratic early on, with $.16/share in 2000 reported, dropping to a loss of $(.47)/share in 2001, then turned profitable at $.10/share in 2002 and increased steadily to $.99/share in 2004 and $1.08 in the TTM.
Free cash flow has been positive, if inconsistent, with $18 million reported in 2002, dropping to $5 million in 2003, and $23 million in 2004, and $18 million in the TTM.
The balance sheet looks solid with $72.2 million in cash, enough to cover both the $48.5 million in current liabilities and the $7.1 million in long-term debt combined. In addition, the company has another $73.9 million in "other current assets."
How about some valuation numbers on this stock?
Looking at Yahoo "Key Statistics" on MTLG, we find that this is just barely a mid-cap stock with a market capitalization of $524.39 million. The trailing p/e is reasonable at 21.80, with a forward p/e (fye 31-Dec-06) at 21.23. The PEG is a very nice 1.07.
Fidelity.com puts Metrologic in the "Computer Peripherals" industrial group. Within this group, MTLG has a Price/Sales ratio of 2.2. This is one of the cheapest in this stock group led by Foundry Networks (FDRY) at 5.0, Secure Computing (SCUR) at 4.6, Emulex (ELX) at 3.7, Nice Systems (NICE) at 3.4, Metrologic (MTLG) at 2.2, and Lexmark (LXK) at 1.1.
Looking at other "key statistics", we find that there are 22.25 million shares outstanding, but only 12.12 million that float. 523,700 shares are out short as of 1/10/06, representing 3.80% of the float or 3.6 trading days of volume.
As noted above, the last stock split was a 2:1 split on 10/31/03. No cash dividends are reported by Yahoo.
And how about a chart?
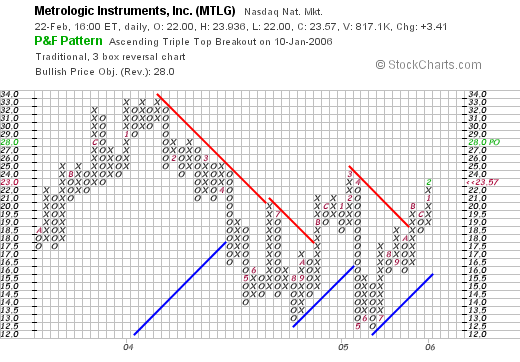
Looking at the "Point & Figure" chart from StockCharts.com:

we can see that for the period documented, this stock which was initially doing well climbing to a peak of $33, then proceeded to break down in price bottoming at $12.50/share in June, 2005. The stock has subsequently been acting better, breaking through resistance in October, 2005 at $18.50, and has climbed now to $23.57 range.
So what do I think? Well the stock sure has performed well since my pick back in early 2003. However, the price has been flat for this past year. The latest quarterly report was strong and the Morningstar.com report looks nice for the past few years. Valuation-wise, the p/e is relatively low, the Price/Sales ratio is at a good valuation, and the PEG also looks nice. Revenue has also shown steady growth and the balance sheet is solid. Overall, not much to dislike about this stock, except for the relatively unimpressive chart, which recently has broken through resistance into positive territory.
Thanks so much for visiting! If you have any comments or questions please feel free to email me at bobsadviceforstocks@lycos.com or leave them right on the blog.
Bob


