Hello Friends! Thanks so much for stopping by and visiting my blog, Stock Picks Bob's Advice. As always, please remember that I am an amateur investor, so please remember to consult with your professional investment advisors prior to making any investment decisions based on information on this website.
 I was looking through the list of top % gainers on the NASDAQ today and came across CAS Medical (CASM) which, as I write, is trading at $12.60, up $1.02 or 8.81% on the day, in an otherwise weak market. I do not own any shares of CASM nor do I have any options.
 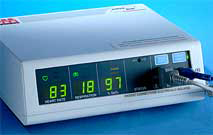 So what does CAS Medical do anyway?
According to the Yahoo "Profile" on CASM, the company
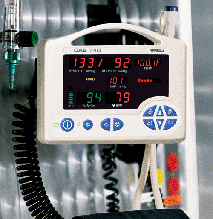
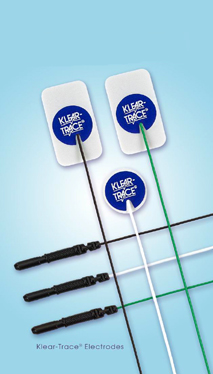
"...engages in the development, manufacture, and distribution of diagnostic equipment and medical products for use in the healthcare and medical industry. The company principally offers blood pressure measurement technology MAXNIBP, vital signs measurement equipment, cardio-respiratory monitoring equipment, and supplies for neonatal intensive care. It also develops, assembles, and sells blood pressure cuffs, liquid infusion devices, and blood transfusion filters."
 And how about the latest quarterly result?
This was a little harder to find, but as often is the case is readily available on the CAS Medical website in the 2005 Archives.
On October 27, 2005, CASM reported their 3rd quarter 2005 results. Revenues for the quarter ended September 30, 2005, came in at $7.48 million, a 48% increase over the $5.04 million reported in the same quarter the previous year. (The company noted that these results included the recent acquisition of Stacorp, Inc.) Net income for the quarter increased to $433,000 or $.04/diluted share, up from $384,000 or $.03/diluted share in the same quarter last year. In the same announcement, the company guided 2005 earnings higher to $.12-$.14/share.
And how about longer-term results?
Reviewing the Morningstar.com "5-Yr Restated" financials, we can see that revenue has grown steadily from $12.1 million in 2000 to $19.9 million in 2004 and $23.8 million in the trailing twelve months (TTM).
 Earnings, however, have been quite erratic (which is a common observation in these tiny companies) dropping from $.06/share in 2000 to a loss of $(.03)/share in 2002, and increasing subsequently to $.05 in 2003, $.11 in 2004 and $.13/share in the TTM.
Free cash flow has been either nil or positive with $0 in 2002 increasing to $2 million in 2004, and back to $0 in the TTM.
The balance sheet, as presented on Morningstar.com, looks solid with $1.1 million in cash and $10.4 million in other current assets balanced against $4.3 million in current liabilities, resulting in a "current ratio" of almost 3. The combined current assets are more than enough to pay off both the $4.3 million in current liabilities and the $5.3 million in long-term liabilities combined.
 And what about valuation numbers?
Looking at Yahoo "Key Statistics" on CAS Medical, we can see that this is a very small company with a market capitalization of only $126.29 million. The trailing p/e is quite rich at 96.92. There is no forward p/e reported on Yahoo (probably due to the lack of analysts making estimates on future earnings.)
CAS Mecical is in the "Medical Instruments/Supplies" industrial group of stocks according to the Fidelity.com eResearch website. Within this group, CASM is moderately priced with a Price/Sales ratio of 5.7. Leading off this group is Alcon (ACL) with a Price/Sales ratio of 8.3, followed by Guidant (GDT) at 7.2, then CAS Medical (CASM) at 5.7, Stryker (SYK) at 4.1, Boston Scientific (BSX) at 3.2 and Baxter (BAX) at 2.4.
Going back to Yahoo for some more numbers, we find that CASM has only 10.02 million shares outstanding with 6.33 million of them that float. As of 1/10/06 there were only 33,500 shares out short representing 0.4 trading days of volume (the short ratio). This short interest is only 0.50% of the float so all-in-all the short shares are not much of a factor with this stock as far as I can tell.
Yahoo did not report any dividends nor any stock splits.
What about a chart? Looking at a "Point & Figure" chart from StockCharts.com on CASM:
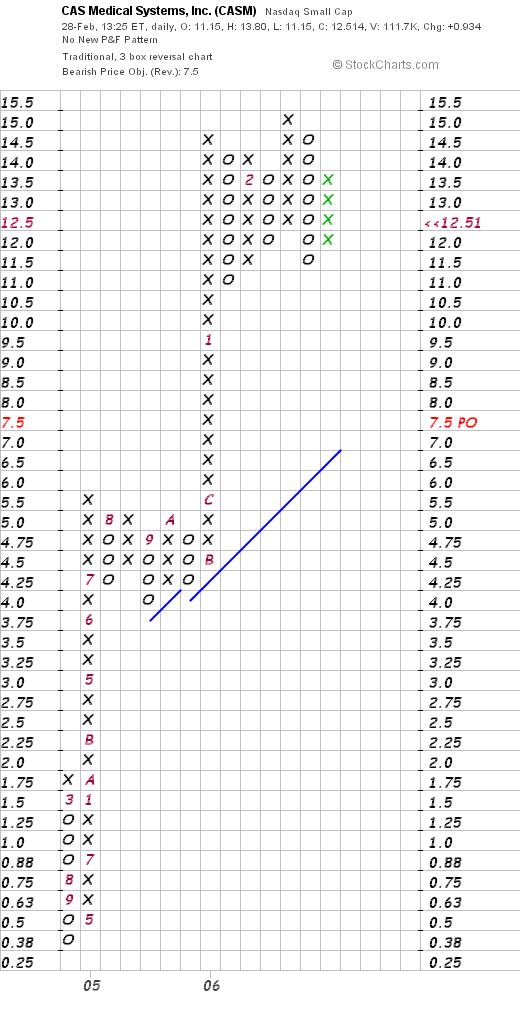
We can see that this chart is extremely strong with a stock climbing sharply from $.38/share in September, 2004, to the current $12.51 level today. This has been a meteoric rise for this stock which if anything, might be a tad over-extended after climbing so far so fast!
So what do I think? Well, I like this stock. The latest quarter was strong, the Morningstar.com evaluation looks good, and I like the raised guidance. Valuation-wise, the p/e is certainly rich, but the company is just starting to have positive earnings and that is a bit hard to tell. The Price/Sales is also a bit rich but not bad relative to other stocks in its group. Finally the chart is very strong. However, whenever I find myself dealing with very small companies, I often find the volatility a bit threatening, so be prepared to buckle your seat belts and hang on :).
Thanks again for stopping by and visiting! Remember to always check with professionals prior to following any of my "advice". That would make me happy :). If you have any comments or questions, please feel free to leave them on the blog or email me at bobsadviceforstocks@lycos.com.
Bob


