


Hello Friends! It seems like we have been going through a bit of a "dry spell" around these parts. I have been successfully been "sitting on my hands" trying to avoid breaking my own trading rules in my "Trading Portfolio" which I really need to update on the website. As you probably know, I am an amateur investor, so PLEASE consult with your professional investment advisors prior to making any investment decisions based on any information on this website. As always, if you have any comments or questions, please feel free to email me at bobsadviceforstocks@lycos.com and I will try to get back to you, usually by posting a response on this blog. If you use the links to the left side of the main website, "Bob's Advice for Stocks", you may find it interesting to browse through the over 600 entries on this blog (can you believe it?). Hopefully, as that old Ronald Reagan joke goes, "There is a pony in there somewhere!"
 Scanning through the USA Today list of top % gainers on the NYSE, I came across Lowe's Companies (LOW), which as I write is trading at $49.11, up $2.46 or 5.27% on the day. I do NOT own any shares nor have any options on this stock. Lowe's is a competitor to Home Depot (HD), which I posted on Stock Picks Bob's Advice on May 20, 2003. According to the Yahoo "Profile" on Low, this company "...is a home improvement retailer, with a specific emphasis on retail do-it-yourself (DIY) and commercial business customers."
 Just a few moments ago, LOW reported 2nd quarter 2004 results. Total sales rose 17% to $10.2 billion, and sales in stores open at least a year, rose 5.1%, which although below Lowe's expected 6 to 7% estimate, firmed towards the end of the quarter, and Lowe's went ahead and indicated current sales were running ahead of guidance. Net income was $704 million, or $.89/share, compared with $597 million, or $.75/share the prior year. These results were good enough to push the stock higher in trading today!
 If we take a look at Morningstar.com "5-Yr Restated" financials, we can see the steady and impressive growth in revenue from $15.4 billion in 2000 to $32.4 billion in the trailing twelve months (TTM). Earnings have also steadily increased from $.88/share in 2000 to $2.38 in the TTM. Just as nice, LOW has paid a dividend and raised its dividend each and every year from $.06/share in 2000 to $.12/share in the TTM.
Free cash flow, which was a negative $(600) million in 2002, has improved and is currently at $575 million in the TTM.
The balance sheet shows $2.0 billion in cash and $6.1 billion in other current assets, plenty to cover the $5.9 billion in current liabilities and make a large dent in the $4.4 billion in long-term liabilities.
What about valuation? Looking at "Key Statistics" from Yahoo.com, we can see that the market cap is a large $38.30 billion. The trailing p/e isn't bad at 20.75, the forward p/e (fye 30-Jan-06) is even nicer at 14.66. The PEG (5 yr expected) is gorgeous at 0.78. (I really like a PEG under 1.0), and Price/sales is reasonable at 1.12.
There are currently 779.63 million shares outstanding with 771.80 million that float according to Yahoo. As of 7/8/04, there were 14.99 million shares out short, representing 4.807 trading days, or 1.94% of the float. I like to use 3.0 trading days as a point of reference, and thus, at least in my opinion, this is a significant number of shares out short, and may contribute to upward buying pressure as we are seeing today on good news.
As noted earlier, the company pays a dividend of $.16/share yielding 0.34%. The last stock split was a 2:1 in July, 2001.
How about Technicals? If we look at a Point and Figure chart from Stockcharts.com:
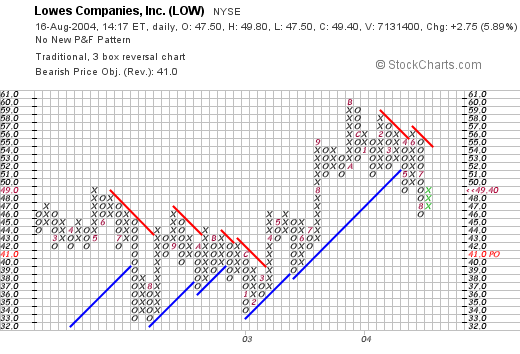
we can see that this chart has actually broken through its support level at around $52 in May, 2004, and has traded lower recently. It may be forming a new support level, but it would be nice to see this get through the $54 level, the current resistance line, to confirm the breakout to new heights. Again, I am not a technician, so please review and be aware of the current graph!
So what do I think? Well, I have never shopped at Lowe's so on a Peter Lynch level, I can't say much. However, the earnings report is good, I especially like today's announcement raising guidance, the Morningstar 5-yr record is beautiful. The free cash flow and balance sheet is very nice. The PEG is under 1.0 and the P/E itself is just over 20.0. Except for the graph, which is reflecting the current market's malaise, everything looks nice for LOW. As you know, I am not in the market to buy ANYTHING until I get a "signal" from my current portfolio telling me to buy. (My signal occurs when a portion of an existing position is sold at a gain!).
Thanks so much for stopping by and visiting. I really do appreciate all of you who visit and especially write, which lets me know about who you guys are and what you all are thinking! If you have any comments or questions, please feel free to email me at bobsadviceforstocks@lycos.com Have a great week everyone!
Bob
Updated: Monday, 16 August 2004 1:25 PM CDT