Hello Friends! Thanks so much for stopping by. In spite of my less than perfect satisfaction with the election results, it was nice today to have a post-election rally. In fact, I was able to sell my first 1/4 position in AMHC at a very nice gain, and to go ahead and ADD a position, picking Cal Dive (CDIS) which showed up today! Thus, As always, please remember that I am an amateur investor so please consult with your professional investment advisors prior to making any decisions to make sure all investments are timely, appropriate for your needs, and likely to be profitable for you. If you have any questions, comments, or words of encouragement, please feel free to email me at bobsadviceforstocks@lycos.com .
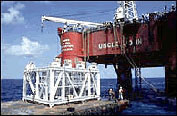
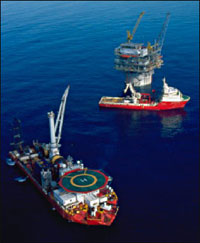
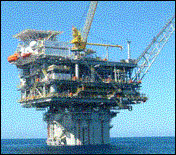
 Looking through the list of top % gainers on the NASDAQ today, I came across Cal Dive International (CDIS) which closed at $38.25, up $4.24 on the day or 12.47%. Having just sold a portion of my AMHC today at a gain, I went ahead and picked up 200 shares of CDIS today, so I AM a holder of this stock. According to the CNNMoney "snapshot", Cal Dive's principal activity "...is to provide services to offshore oil and gas exploration and pipeline companies."
 This is earnings season and what drove the stock higher was a 3rd quarter earnings report. For the quarter, revenue jumped 27% to $131.9 million from $103.9 million last year. Earnings for the quarter rose to $22.8 million or $.59/share, up from $8.9 million or $.24/share last year. They came in $.10 ahead of estimates of $.49/share; however, revenue came in a little light as the street was expecting revenue fo $133.6 million. In addition, CDIS raised estimates for 2004 to $1.90 to $2.00/share from an earlier forecast of $1.30 to $1.70/share. This was exactly the kind of earnings I like to see, an announcement coupled with more aggressive expectations of revenue and earnings.
 How about longer-term? Taking a look at Morningstar.com "5-Yr Restated" financials, we can see that revenue has grown steadily from $161.0 million in 1999 to $453.9 million in the trailing twelve months (TTM).
Earnings have been steady except for a dip in 2002, and have increased from that point in time starting at $.55/share in 1999, to $1.31 in the TTM.
Free cash flow, which was a negative $(54) million and $(91) million in 2002, improved to $5 million in 2003 and $110 million in the trailing twelve months.
 How about valuation questions? Looking at "Key Statistics" from Yahoo, we can see that this is a mid-cap stock with a market cap of $1.46 billion. The trailing p/e is a big rich at 29.88, however the forward P/E (fye 31-Dec-05) is more reasonable at 17.79. The PEG, with the fast growth rate, came in at .77.
 Yahoo shows 38.28 million shares outstanding with 35.70 million that float. There are 1.01 million shares out short as of 10/8/04, representing 1.867 trading days of volume. Not very significant imho.
No cash nor any stock dividends are reported by Yahoo.com.
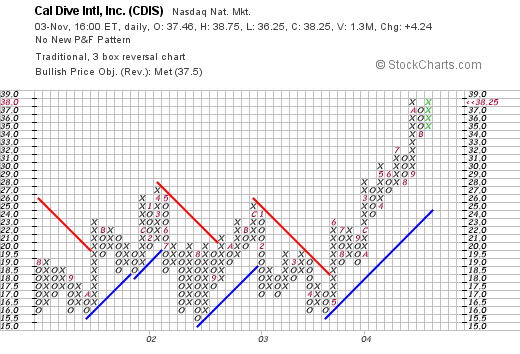
How about technicals? If we look at a "Point & Figure" chart from Stockcharts.com:

Here we can see that this stock was actually going nowhere betwen 2001 and 2003, until in May, 2003, when the stock broke through a resistance level of about $17.50, and has traded higher since. The stock may be a wee bit ahead of itself, but overall the graph looks nice to me.
So what do I think? The stock had a great day today on a great earnings report which included dynamic revenue and earnings growth as well as management plans to raise their own estimates. Valuation is nice, even though the P/E is about 29, the PEG is under 1.0. In fact, I liked this stock so much that I bought it.
Thanks so much for stopping by! Please feel free to email me at bobsadviceforstocks@lycos.com if you have any questions, comments, or words of encouragement.
Bob


