Stock Picks Bob's Advice
Tuesday, 29 June 2004
"Trading Transparency" NVEC
Hello Friends! Just a quick note to update you on my trading portfolio. NVE Corporation (NVEC) hit my 8% loss limit and out it went...all 160 shares! I sold them a few moments ago at $36.25. I JUST purchased the shares on 6/24/04 at $39.44. That represents a loss of $(3.19)/share or (8.1)%. Out they went!
Thanks so much for stopping by! Please email me at bobsadviceforstocks@lycos.com if you have any comments, questions or WHATEVER!
Bob
Monday, 28 June 2004
June 28, 2004 Aeroflex, Inc. (ARXX)
Hello Friends! I had a very busy Monday, so am getting around to updating the blog this evening. I sure am glad you all stopped by to visit. Please remember that while I may give you some ideas as "food for thought", I am an AMATEUR investor, so please do your own investigation on all investments discussed on this website, and PLEASE consult with your investment advisors to make sure that any investment decision you may make is appropriate and timely for you!
For those of you who are NOT familiar with my techniques, I will try to review what I am doing as I post this new stock idea. My first step, usually while the market is open, is to peruse the list of greatest percentage gainers. I have found, as you can see from the previous post on NOIZ, that stocks over $10 work best for me and that lower-priced stocks are too volatile to hang onto...at least with what I am doing. Today, I came across Aeroflex (ARXX), which IS a bit of a low priced stock, and which closed at $13.66, up $.85 or 6.64% on the day. According to the
Yahoo "Profile", Aeroflex "...uses its advanced design, engineering and manufacturing abilities to produce microelectronic and testing solutions. Its products are used in the aerospace, defense and broadband communications markets." I really do NOT know a lot about this particular industry....and I do NOT own any shares of Aeroflex at this time....and I cannot BUY any shares because I just sold a stock at a LOSS, so with my system, I am waiting to sell a portion of a stock at a gain...before I add to my portfolio to get back to 24 positions.
O.K., so the stock went up nicely today. "What do you do next?" you are asking. One of the first places I like to check is the latest quarterly result. This gives me an idea of the CURRENT financial health of the company. Two things that I look for is revenue growth AND earnings growth. I can usually find the latest earnings report on Yahoo...but sometimes have to search through the company's own website to get the story.
So how does Aeroflex look in regards to the latest quarterly report? Well, on May 12, 2004, ARRX
reported 3rd quarter 2004 results. Quite frankly, the heavy use of "pro forma" and "GAAP" and "non-GAAP" qualifiers DOES make me a bit concerned. Using GAAP numbers (Generally Accepted Accounting Practices), is preferable to me. These are the tougher numbers to report. For ARRX, for the quarter ended March 31, 2004, revenue or "Net sales" as they report came in at $116.8 million compared to $72.5 million the prior year. That's great! Net income came in at $5.9 million vs $2.9 million the prior year. That's great too. And on a fully diluted basis, the important way to look at per share results, this came in at $.08/share this year vs. $.05/share in 2003. This is also terrific results in my opinion. So ARRX has "passed" the latest quarter results test as I put it!
Next, my routine is to go over to
Morningstar.com and check out the "5-Yr Financials" which give me some important fundamental data on each stock.
The
ARXX 5-Yr Restated financials give me information on stocks with views on revenue growth, earnings growth, dividend payments, free cash flow, and the balance sheet. ARXX shows nice, if not perfect, numbers in these departments.
First revenue growth history. This is visually apparent by looking at the series of bar graphs which show an almost uninterrupted growth in revenue (except for the dip of 2002) from $160.4 million to the $386.5 million in the TTM (trailing twelve monts.)
Earnings have been quite inconsistent dropping from $.20/share in 1999 to $.07/share in TTM. No dividend is paid.
Next step is cash flow. I like to review the "Free cash flow" which as Morningstar shows, is calculated by subtracting "Capital Spending" from the "Operating Cash Flow". For ARXX, we can see that they had $34 million in free cash flow in 2001, $10 million in 2002, $15 million in 2003, and $18 million in the TTM. It is important for me to see that the recent free cash flow is positive and it is an added plus, in my opinion, if the TREND of the cash flow is positive as well...that is that the cash flow is GROWING. ARXX passes this review nicely.
How about the balance sheet? "What do you do with that?" you are asking. I am NOT an accountant. In a simple fashion, which IS the level that I understand a lot of these numbers, I think it is important to see MORE assets than liabilities. And breaking this down into current and long-term amounts, it is crucial that the current assets...those that are readily available, are greater than current liabilities. Thus for ARXX, the $9.9 million in cash and the $210.7 million in "other current assets" greatly outweighs the $81.1 million in current liabilities, and actually is enough to pay off the moderate $52.3 million in long-term debt as well.
Thus, except for the income figure, which was just fine in the latest quarter, the numbers look very good on Morningstar.com to me.
"What do you check next?" you may be asking. Usually at this time I like to look a little at "valuation". O.K., I am not EXACTLY a value investor am I? But why not look at value when thinking about a stock? For this, I usually turn to "Key Statistics" on Yahoo.com. The
"Key Statistics" on Aeroflex show that the "Market Cap" is currently at $1.01 billion. I have to admit that I often have to look up
"Market Capitalization Defined", which from the Investopedia.com website, defines "Micro Cap" as between $50 to $300 million, "Small Cap" between $300 million and $2 billion, "Mid Cap" between $2 billion to $10 billion, "Large Cap" between $10 and $200 billion, and "Mega Cap" (a new term to me!) as over $200 billion.
So we can see that at $1.01 billion, according to this source, ARRX is a "Small Cap" stock.
What about the p/e? For ARRX this comes in at 76.31, which is pretty darn high...but the forward p/e, estimating the p/e based on current price and future earnings, is much better at 23.15 for the fiscal year ending 30-Jun-05. This is reflected in the PEG which at 1.45, isn't really too high. A good number is in the 1.00 range, meaning that the ratio of the p/e and the growth rate was about 1.0. The PEG is a nice way to value a growth stock...but it IS based on future estimates, which can be only as good as the analyst that provides the estimate.
At this point, I usually check the number of shares outstanding and the number that float. ARRX has 74.21 million shares outstanding and 72.20 million of them float. I also am interested in the "Shares Short" which as of 5/10/04 was standing at 2.37 million shares. Is that a lot? Well, in my humble opinion, the important number for this question is the "Short Ratio" which as of 5/10/04 was standing at 2.442. This means that it would take 2.442 days worth of current daily trading volume for the short sellers to "cover" their shorts, that is to buy back the borrowed shares that they have sold. When the short interest starts getting over 3.0, in my opinion, this means that there is an increased chance of seeing a "short squeeze" that is an almost panic to purchase shares to cover the shorts in the face of good news (!) and a climbing stock price. (Both of these events are bad as a rule for short-sellers.)
Finally, I like to see if there is a dividend (no), and if the stock recently split. Here Yahoo reports that ARRX last split 2:1 in November, 2000.
Lately, I have been using graphs to get me a picture of the trading activity. I like to use Point and Figure charts on
Stockcharts.com. Over the last couple of years, I have grown to like these charts...if you would like you can read or order a GREAT book by Thomas J. Dorsey on this subject:
"Point and Figure Charting: The Essential Application for Forecasting and Tracking Market Prices, 2nd Edition" by Thomas J. Dorsey. Anyhow, this is the ARRX chart:
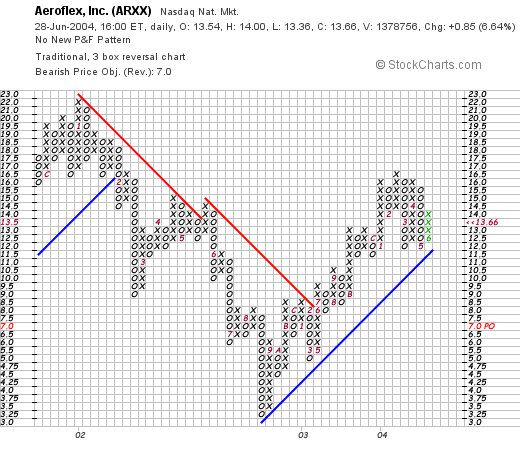
Here we can by the columns of "climbing x's" and "descending O's" that the stock was trading lower between January, 2002, and September,2002, after which it has steadily been rising from the $3.00 range to the current $12.00 level. The graph looks reasonably strong to me as long as it stays above it's "support level" which is outlined in blue. That is my simple understanding of graphing :).
So what do I think, now that I have perused all of this data? Well, the stock made a nice move today, its latest quarterly report was very strong, the 5-yr results on Morningstar are impressive, except for the earnings which have been erratic, the free cash flow is positive and improving and the balance sheet looks quite clean.
Valuation-wise, the p/e is steep but the stock is expected to grow so quickly that the PEG is only about 1.5. There are a lot of shares out but not many are sold short. And the technicals look encouraging.
This IS the kind of stock I might buy....but as I have said many times, I am limited in my trading strategy to 25 positions, have 23 so room for two more, but am waiting to ADD a new position until such time as I SELL a portion of a position at one of my set goals. That is my strategy, you may choose to do something completely different!
I hope all of this discussion is helpful to you! Please let me know if you like it, by emailing me at bobsadviceforstocks@lycos.com with your comments and questions!
Thanks again for stopping by and please come back and visit again!
Bob
Posted by bobsadviceforstocks at 3:05 PM CDT
|
Post Comment |
Permalink
Updated: Monday, 28 June 2004 9:47 PM CDT
"Trading Transparency" NOIZ
Hello Friends! Well the market started out strong and is now back in the red. Seems like the story of my life! Anyway, I really do NOT like these stocks under $10 when I have a tight 8% stop. To make a long story short, my Micronetics stock (NOIZ) dropped a little more today and got into a bit more than an 8% loss. So I pulled the plug on the 400 shares of NOIZ in my trading account at $8.62. I had just picked up the 400 shares on 6/2/04 at a cost of $9.42...so with an $.80/share loss was able to hit 8%! In fact, that was an 8.5% loss. Well, rules are rules I gues....so back to 23 positions....heading for 25 I hope. Will WAIT until I have now SOLD another portion at a GAIN before going back to 24. At least that's my PLAN. Thanks so much for stopping by! Please remember to use your professional investment advisors before acting on any investment mentioned on this website!
If you have any questions or comments, please feel free to email me at bobsadviceforstocks@lycos.com
Bob
Saturday, 26 June 2004
"Looking Back One Year" A review of stock picks from the week of June 16, 2003

Hello Friends! It is hard to believe that it is the weekend already....wasn't I just posting this review a few moments ago? Oh well, I KNOW it sounds trite, but it IS so true. Thanks so much for stopping by! I hope that you enjoy your visit and maybe some ideas will stimulate your own thinking on investments. As always please remember that I am an AMATEUR investor so PLEASE do your own investigation on all stocks discussed on this website and PLEASE consult with your professional investment advisors!
If you are new around here, or if you are viewing this entry on a third-party website, you might not be familiar with my activity here. What I like to do is look at stocks each day (almost) and scan through the big gainers. I believe some of your best stock market movers will be found there! I review their latest quarterly result, their five year results as presented on Morningstar.com, some basic valuation questions, and a quick check on what their chart looks like. I had a more professional investor tell me that what I was doing was JUST due diligence. I guess if that is what it is, I am ok with it....anyhow, I post these stocks, write why I like them, and then on weekends, when I get a chance, I review past picks to see how they turned out. In addition, I share with you my actual trading portfolio. I have other investments managed by professionals....but what I call my trading portfolio is real and is what I control. That's it in a nutshell! As always, if you have any questions, comments, or words of encouragement, you are MORE than welcome to email me at bobsadviceforstocks@lycos.com .

On June 16, 2003, a bit over a year ago, I
posted Quest Diagnostics (DGX) at $64.28. DGX closed at $87.30 on 6/25/04 for a gain of $23.02 or 35.8%.
On April 22, 2004, DGX
reported 1st quarter 2004 results. Revenue grew 14.9% over prior-year levels to $1.3 billion (reflecting the acquisition of Unilab.) Net income came in at $116.1 million in 2004 vs $88.0 million in the 2003 1st quarter. On a fully diluted basis, this came in at $1.13/share vs $.88/share last year. This company is doing great!
 Dominion Homes (DHOM) was posted
 on Stock Picks on 6/16/03 at a price of $24.50. DHOM closed on 6/25/04 at $23.87 for a loss of $(.63) or (2.6)%.
Dominion is feeling the effects of the anticipated series of interest rate rises which will likely put a damper on the red-hot housing sector. On May 3, 2004, DHOM
reported 1st quarter 2004 results. Diluted earnings per share for the quarter ended March 31, 2004, increased 5% to $.62/share from $.59/share the prior year. Revenues for the quarter were up 11.2% to $115.7 million, based on 634 home delivieries, vs $104.0 million in 2003 when 569 homes were delivered. These 'nice' results were tempered by the
June 2, 2004, announcement that home sales for the second quarter will be "significantly below" the prior year results. This stock explains a bit of my reluctance with all of these homebuilders....if you can ride them with the cycle you can do well....but personally, I prefer less cyclical issues that can show persistent growth through all economic cycles. (am I dreaming?)

On June 16, 2003, I
selected American Home Mortgage (AHM) for Stock Picks when it was listed on the NASDAQ with symbol AHMH at $19.49. In December, 2003, after the acquisition of Apex Mortgage it reorganized as a REIT, and as of June, 2004, has a new symbol of AHM. AHM closed on 6/25/04 at $26.20 for a gain of $6.71 or 34.4%.
On April 28, 2004, AHM
announced 1st quarter 2004 results. Net earnings were $21.2 million vs $16.3 million the prior year. Earnings/diluted share were $.70/share compared to $.96/share the prior year. However, dividends were $.55/share compared to $.10/share last year. On a more optimistic note, the company DID raise 2004 earnings guidance to $3.25 to $3.40/fully diluted share. I am a bit concerned about ANY drop in earnings/share...and with this such an interest-rate sensitive field, imho, I am just a bit cautious about the REITs and building stocks that were so hot last year.
Whitman Education Group (WIX) was posted on Stock Picks on 6/16/03 at a price of $14.89. As was
reported on July 1, 2003, Career Education Corp. completed its merger with WIX. Shareholders of WIX received $6 in cash and .138 shares of Career Education (CECO). Since CECO split 2:1 on 8/22/03, this would entitle each share of WIX to receive .276 shares of CECO. CECO closed at $44.97 on 6/25/04, this means that each share of WIX would currently be worth $6 + .276 x $44.97 or $18.41. Thus, this would represent a gain of $3.52 or 23.6%.

On June 17, 2003, I
posted Outback Steakhouse (OSI) on Stock Picks at $39.76. OSI closed at $42.20 on 6/25/04 for a gain of $2.44 or 6.1%.
On April 20, 2004,
Outback reported 1st quarter 2004 results. Net income was $48.3 million or $.62/diluted share vs. $42.6 million or $.54/diluted share the prior year. Revenues for the quarter increased 25.3% to $816.6 million from $651.7 million the prior year. Overall, the company appears to be doing satisfactorily.

FactSet Research Systems (FDS) was
posted on this website on 6/17/03 at a price of $40.39. FDS closed at $47.00 on 6/25/04 for a gain of $6.61 or 16.4%.
On June 15, 2004, FDS
reported 3rd quarter 2004 results. Revenue for the quarter jumped 11.9% to $63.6 million from $56.8 million last year. Earnings were up 2.9% to $14.7 million, or $.45/share from $14.3 million, or $.41/share in 2003. These results are o.k. Not enough maybe for me to sell these shares IF I owned them (I don't) but not enough to get my interest peaked.

I
posted Macrovision (MVSN) on this blog on 6/18/03 at a price of $21.15. MVSN closed on 6/25/04 at $24.99 for a gain of $3.34 or 15.8%.
On May 3, 2004, MVSN
announced 1st quarter 2004 results. Revenue jumped 35% to $38.0 million from $28.1 million in the same quarter last year. Net income was $10.8 million or 55% higher than the $6.9 million the prior year. This worked out to $.21/diluted share up 50% from the $.14/share reported last year. These results were great and the stock moved up accordingly.

I
posted LifeCell Corp (LIFC) on the blog at $5.82/share. LIFC closed on 6/25/04 at $11.12 for a gain of $5.30 or 91.1%. (I guess it IS worth the BIG logo...lol)
On April 27, 2004, LIFC
reported 1st quarter 2004 results. For the quarter ended March 31, 2004, total revenues came in at $13.8 million, compared to $9.0 million the prior year. Net income was $883,000 or $.03/diluted share vs $218,000 or $.01/diluted share last year. These are very nice results!

Tofutti Brands (TOF)
was posted on Stock Picks on 6/18/03 at a price of $2.82. TOF closed on 6/25/04 at a price of $3.05 for a gain of $.23/share or 8.2%.
On May 11, 2004, TOF
announced 1st quarter results. Net sales decreased 12% to $4.0 million for the 13 weeks ended March 29, 2003. Operating income decreased to $99,000 from $458,000 the prior year. Net income decreased to $54,000 or $.01/share compared to $269,000 or $.05/share the prior year. These results give me pause. This is NOT what I am looking for in a company.
Hang in there! Just two more to review...

On June 20, 2003, I
posted Laboratory Corp. of America (LH) on Stock Picks at $30.68. LH closed on 6/25/04 at a price of $40.60 for a gain of $9.92 or 32.3%.
On April 22, 2004, LH
reported 1st quarter 2004 results. Revenues for the quarter were $752.5 million, an increase of 5.7%. Earnings/diluted share increased 19.6% to $.61/share vs. $.51/diluted share the prior year. These are nice results although I would prefer to see a more dynamic revenue growth number.
 Forest Laboratories (FRX) was posted
on Stock Picks on 6/20/03 to finish off a busy week! They were picked at a price of $54.99. FRX closed at $58.46 on 6/25/04 for a gain of $3.47 or 6.3%.
On April 20, 2004, FRX
reported 4th quarter 2004 results. For the quarter ended March 31, 2004, net sales increased 17% to $725.1 million from $621.1 million last year. Net income however DECREASED 20% to $145.5 million. Diluted earnings per share came in at $.38/share vs $.48/share the last year. I like the increased revenue but the decrease in earnings DOES concern me.
So how did Stock Picks do for the week of 6/16/03 last year? Of the 11 stocks picked that week there was only one losing selection, DHOM which was down (2.6)% from the selection price. The other 10 had gains ranging from 6.1% to 91.1% for an average of the 11 selections of a gain of 24.3%. Not too shabby in my humble opinion!
Thanks so much for stopping by! If you have any questions or comments, please feel free to email me at bobsadviceforstocks@lycos.com .
Happy Saturday everyone!
Bob
Posted by bobsadviceforstocks at 10:11 AM CDT
|
Post Comment |
Permalink
Updated: Saturday, 26 June 2004 11:32 AM CDT
Friday, 25 June 2004
"Trading Transparency" LWAY
Hello Friends! That nickel in my pocket, which as you know comes from having sold a portion of a stock at a GAIN, was just BURNING a hole. What can I say? No self control I know. I don't deny it. ANYHOW, looking through the lists of top % gainers, I saw one of my favorites near the top, Lifeway (LWAY) a small company that makes KEFIR drinks....I think that is some sort of a yogurt drink. They have great numbers....LWAY is currently trading at $12.72, up $2.42 or 23.50% on the day (wow!)....and I purchased 200 shares at $12.72....guess that was MY trade lol...stock is a 60% margin requirement...so didn't want to PUSH toooo hard. Anyhow, that's the news.
Remember I am an amateur investor...so please do your own homework on ALL stocks discussed on this website and consult with your investment advisors!
If you have any questions or comments, you can reach me at bobsadviceforstocks@lycos.com
Bob
Thursday, 24 June 2004
"Trading Transparency" SAFM
Hello Friends! I am not REALLY convinced over the health of the bull market right now. So with that last purchase I was pushing my margin balance a little....and I WAS a little close to another sell point on Sanderson Farms (SAFM). So a few moments ago, I sold ANOTHER 1/4 position in SAFM. Our goal on a second sale is about a 60% gain. (I had already sold a 1/4 position last month!). To make a long story short, I sold 45 shares of my 180 share position, leaving 135 shares remaining, at $54.89. These 180 shares HAD been purchased on 2/3/04....just about 4 months ago (!) at $35.86. Thus I had a gain of $19.33/share or 53.9%. Pretty close to the 60% mark anyhow. Our next sell point will either be at about the 90% point on the rise...or back around a 30% gain....with our new strategy of allowing a stock to correct only to 50% of the sell point...if you follow me.
Thanks so much for stopping by! If you have any questions or comments, please feel free to email me at bobsadviceforstocks@lycos.com
Bob
P.S. With this sale, you know what THAT means...yikes...I have ANOTHER nickel in my pocket...but will TRY to sit on my hands today...you know UNLESS I see something fabulous (lol), before making another purchase. Read above about MARGIN!
Posted by bobsadviceforstocks at 11:25 AM CDT
|
Post Comment |
Permalink
Updated: Friday, 25 June 2004 10:41 AM CDT
"Trading Transparency" NVEC
Hello Friends! Well that 'nickel' was sitting in my pocket all of 60 seconds. Seeing that NVE Corp...see the earlier post yesterday...was moving up AGAIN....well what COULD I do???? Well, I purchased 160 shares of NVEC at $39.39 a few moments ago....so will be watching this NANO stock closely now! A little speculative as 60% margin was required.
Thanks so much for stopping by! If you have any questions or comments, please feel free to email me at bobsadviceforstocks@lycos.com .
Bob
"Trading Transparency" AMMD
Hello Friends! Well I got a little antsy with my American Medical Devices and sold 50 shares, 1/4 of my position, leaving 150 shares in my trading account at $32.24. For the first sale, I usually have a goal of about 30%. AMMD was purchased on 1/9/04 at a cost of $25.82/share, so I had a gain of $6.42 or 24.9%. This means my next price goal on these shares will be in the region of a 60% gain...when I should be selling another 1/4...or on the downside....if AMMD pulls back to around $25.82...then ideally it should be sold before it hits a loss. Do you follow? In addition, having now sold another portion at a gain this "entitles" me to make a new purchase....adding to the 22 position portfolio as I head towards my goal of 25.
Thanks so much for stopping by! If you have any questions, comments, or words of encouragement, please feel free to email me at bobsadviceforstocks@lycos.com. Remember, I am an AMATEUR investor so please consult with your PROFESSIONAL investment advisors prior to taking any action based on information obtained from this website!
Bob
June 24, 2004 Cohesant Technologies (COHT)
Hello Friends! I meant to post this one earlier today when the stock was a bit higher...unfortunately it closed off its highs...so was NOT on the list of highest % gainers at the close...but since it was on the list for awhile and I WAS going to post...well it just goes to show that I should finish that job! Please remember as always that I am an amateur investor so please do your own investigation of stocks discussed on this website and consult with your own professional investment advisors before making any decision based on what is here!

I do not own any shares nor do I own any options or leveraged positions on this stock. COHT closed today at $10.06, up $.09 or 0.90% on the day. According to the Yahoo Profile, Cohesant Technologies "...is engaged in the design, development, manufacture and sale of specialized two component dispense equipment systems and replacement parts used in the operation of this equipment and specialty two component epoxy coating and grout products." Apparently this equipment is used in construction, transportation and marine industries.
On June 16, 2004, COHT
announced 2nd quarter 2004 results. For the quarter ended May 31, 2004, net sales "increased 23.5% to $5,290,141 from $4,284,650 for the same quarter last year." Net income came in at $529,153, a 56.4% increase over the $338,391 reported the prior year. On a fully diluted basis this worked out to $.20/share compared to $.13/share the prior year.
How about longer-term? Looking at the
"5-Yr Restated" financials on Morningstar.com shows a steady rise in revenue from $11.7 million in 1998 to $16.8 million in the trailing twelve months. Earnings per share have increased each and every year from $.26/share in 1998 to $.52/share in the TTM. Free cash flow looks nice too! They were at $0 in 2000, increased to $1 million in 2001 and 2002, and then to $2 million in the TTM. Their balance sheet also looks nice with $2.8 million in cash enough to cover the current liabilities of $2.1 million. They, according to Morningstar, do not have any long-term liabilities. In addition, COHT has $7.5 million in other current assets.
Cohesant Technologies sells products through its two subsidiaries: Glas-Craft and Raven Lining Systems. It was interesting to read the
story of June 10, 2004 in which COHT announced the INITIATION of a cash dividend of $.13/share to be paid semi-annually. This is just ANOTHER plus for this stock.

What about 'valuation'? Taking a look at
"Key Statistics" on Yahoo, we can see that this is a TINY company....more nano than NVEC lol....with a market cap of $26.40 million. The trailing p/e is reasonable at 16.04 and the price/sales is nice at 1.41. No PEG is recorded due to the fact that probably no five year estimates are out there.
Cohesant has only 2.62 million shares outstanding with only 900,000 of them that float. I mean TINY! There are 1,000 shares out short as of 5/10/04 representing 0.11% of the float or 0.2 trading days so this doesn't look significant to me.
Interestingly, with the declared dividend, this company now yields 2.73%, not too shabby, and NO stock dividends are reported on Yahoo.
What about 'technicals'?
Looking at a basic Yahoo line graph, we can see that this stock has been "behaving" nicely, moving higher in a steplike fashion, from $4 a year ago, to $7 in November, 2003, and now to the $10 level. I don't have a point and figure chart, but this looks nice to me.
What do I think? Well this is a TINY company, so an investment in this stock could be volatile. However, the numbers look nice, the recent earnings report is impressive, the free cash flow is pretty, the new dividend is attractive, technicals look fine and the valuation is downright reasonable. I guess I like this stock lol. And technically, I CAN buy another stock with my portion sale at a gain....but will try to SIT on my hands lol...and let the market demonstrate a little more strength before stretching into another position. At least for the next 5 minutes!
Thanks again for stopping by! If you have any questions, comments, or words of encouragement, PLEASE drop me a line at bobsadviceforstocks@lycos.com I LOVE to hear from any readers....just nice to know you are out there!
Have a great FRIDAY everyone!
Bob
Posted by bobsadviceforstocks at 10:23 AM CDT
|
Post Comment |
Permalink
Updated: Thursday, 24 June 2004 10:17 PM CDT
Wednesday, 23 June 2004
June 23, 2004 NVE Corp (NVEC)

Hello Friends! The market started out sloppy and grew stronger into the close. I don't know the significance of that but it sounds optimistic to me! Anyhow, if this is your first time on the blog, welcome to my world! If you are a returning visitor, well THANKS for coming back...and be sure to return often. As you probably know, I am an AMATEUR investor, so PLEASE do your own investigation of all stocks discussed on this blog and PLEASE discuss all ideas with your own PROFESSIONAL financial advisors!
Well I was scanning the lists of % gainers today, and I came across NVE Corporation (NVEC)...which I could almost have sworn I had listed here once already....you know I am NOT sure how many stocks I have reviewed on this blog...but it is a load of 'em! NVEC had a nice day today, closing at $36.61, up $2.36 or 6.89%. It had traded as high as $40.64 during the day...so it actually traded off its highs into the close.
According to the Yahoo profile, NVEC "...develops and sells devices using spintronics, a nonotechnology the Company helped pioneer, which utilizes electron spin rather than electron charge to acquire, store and transmit information." Yahoo goes on to point out that "NVE is a licensor of spintronic magnetic random access memory technology (MRAM)." Pertinently, NVEC
announced yesterday that the U.S. Patent and Trademark Office issued the company a patent "for an innovative type of MRAM." According to the news report, "The invention therefore has the potential to significantly reduce MRAM write currents...." and "...could enable MRAM cell densities comparable to those of DRAM or Flash." PLEASE do not ask me to explain the difference between MRAM and DRAM....heck I can barely PRONOUNCE those words...but this memory thing was something the 'street' liked and the stock has reacted positively.
Looking for the latest quarterly report, I found that NVEC
reported 4th quarter 2004 results on April 28, 2004. Revenue for the fourth quarter ended March 31, 2004, came in at $3.21 million, an increase of 23% over last year's $2.6 million in the same quarter. Net income came in at $789,670 or $.16/diluted share compared with last year's $160,164 or $.04/diluted share.
Looking longer-term at the
"5-Yr Restated" financials on Morningstar.com, we see that revenue growth has been a bit erratic, increasing from $5.5 million in 1999 to $11.4 million in the trailing twelve months. Earnings have been all over the place but dropped to a loss of $(.60)/share in 2002, and have increased steadily since then with $.33/share reported in the TTM (trailing twelve months).
Free cash flow which was $0 in 2001 $(1) million in 2002, $0 in 2003, turned back positive to $1 million in TTM.
The balance sheet looks just fine with $6.7 million in cash and $2.5 million in other current assets as compared to $1.6 million in current liabilities and only $.1 million in long-term liabilities per Morningstar.
What about 'valuation'? Looking at
"Key Statistics" on Yahoo we can see that this really IS a NANO company with a market cap of just $164.53 million. The trailing p/e is at 82.64...and Yahoo has a forward p/e of 0...so I am not sure what THAT means....there is no PEG...when we get to tiny companies, there just aren't enough analysts that follow them...needless to say, with the rapid growth, the PEG can't be as bad as the P/E!
Yahoo reports only 4.49 million shares outstanding with 2.10 million of them that float. I personally do NOT own any shares of this issue...there are apparently 1.60 million shares out short as of 5/10/04...representing 76.14% of the float (!)....but the volume of shares traded is only 2.178 days....so I guess the trading volume is rather good for a stock of such limited float (?).
No cash dividend is paid...and in November, 2002, this company actually did a REVERSE 1:5 split.
What about 'technicals'?
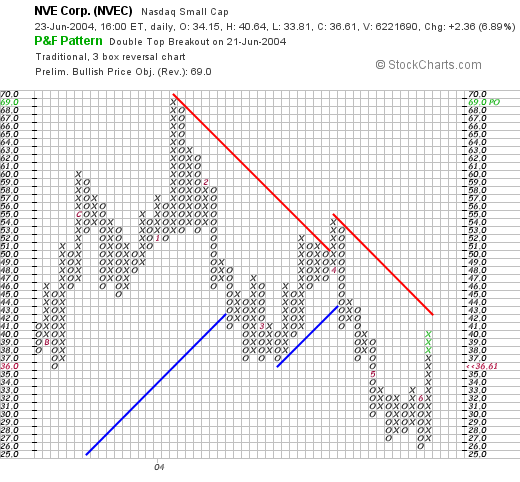
This company actually peaked out at about $69/share in January, 2004, and has traded lower fairly steadily since then. Recently, with the current rise especially, it is challenging a resistance level at about $41. Would like to see it break through that area...to suggest it had reversed the downward spiral. Certainly, the stock is not at this time ahead of itself or technically extended like a lot of stocks we examine.
What do I think? This is a fascinating stock and if you like the idea of a NANO company....well then this might be the ticket. The recent revenue and earnings growth looks nice, the free cash flow and balance sheet looks terrific....but I cannot tell much about valuation...and I am a little concerned about the technicals. Besides, I personally DO NOT HAVE ANY MONEY lol.
Thanks so much for stopping by! If you have any comments or questions, please feel free to email me at bobsadviceforstocks@lycos.com
Bob
Posted by bobsadviceforstocks at 11:25 AM CDT
|
Post Comment |
Permalink
Updated: Wednesday, 23 June 2004 6:19 PM CDT
Newer | Latest | Older


