Stock Picks Bob's Advice
Friday, 17 September 2004
September 17, 2004 Syneron Medical Ltd. (ELOS)
Hello Friends! Thanks so much for stopping by my blog,
Stock Picks Bob's Advice. As you all probably know, and as I repeat many times, I am an AMATEUR investor, so please consult with your professional investment advisors to make sure that any investment ideas you come across here are appropriate, timely, and likely to be profitable for you! If you have any comments or questions, please either go ahead and post them right here on the blog, or email me at bobsadviceforstocks@lycos.com . I always like to hear from readers, and would love to hear from new readers and how they use the information I present. I am also interested in those readers from outside the United States and whether information and investing ideas are applicable to their own situation!

Scanning through the list of
"top % gainers on the NASDAQ", I came across Syneron Medical Ltd. (ELOS). I do not own any shares nor do I have any options on this company. ELOS is having a nice day today trading at $15.20, up $1.01 or 7.12% on the day. According to the
Yahoo "Profile", Syneron "...designs, develops and markets aesthetic medical products based on electro-optical synergy (ELOS) technology that uses the synergy between electrical energy and optical energy to provide effective, safe and affordable aesthetic medical treatments."

On August 18, 2004, ELOS
reported 2nd quarter 2004 results. Revenues for the second quarter were $13.7 million, a 70% increase over the $8.1 million recorded the year earlier. Net income for the second quarter was $6.4 million, or $.30/pro forma diluted share compared to $2.8 million in net income the prior year. In addition, the company estimated that full year 2004 revenues should come in at around $55 million.
Taking a look at the
"5-Yr Restated" financials at Morningstar.com, we can see that this company has no revenue in 2000, only $500,000 in revenue in 2001, and jumped to $35 million in revenue by 2003 with $55 million, as noted in the prior paragraph, estimated for 2004.
Morningstar.com does not show any earnings, but from the prior report, we can see that this company is profitable and growing. Free cash flow has been improving from $(1) million in 2001, $2 million in 2002, $14 million in 2003 and $15 million in the TTM.
The balance sheet as presented on Morningstar.com appears solid. There are $21 million in cash and $8.1 million in other current assets, plenty to cover both the $9.1 million in current liabilities and the $3.1 million in long-term liabilities more than two times over.
How about "valuation" questions? Looking at
"Key Statistics" from Yahoo, we can see that this is a small cap stock with a market cap of only $335.93 million. The trailing p/e is quite reasonable at 13.00. No PEG is reported. Yahoo reports 21.94 million shares outstanding with 5.50 million of them that float. Only 61,000 shares are out short as of 8/9/04, representing 1.11% of the float or only .13 trading days.
Yahoo reports no cash dividend and no stock dividend on record.
What about "technicals"? Looking at a Point & Figure chart from
Stockcharts.com:
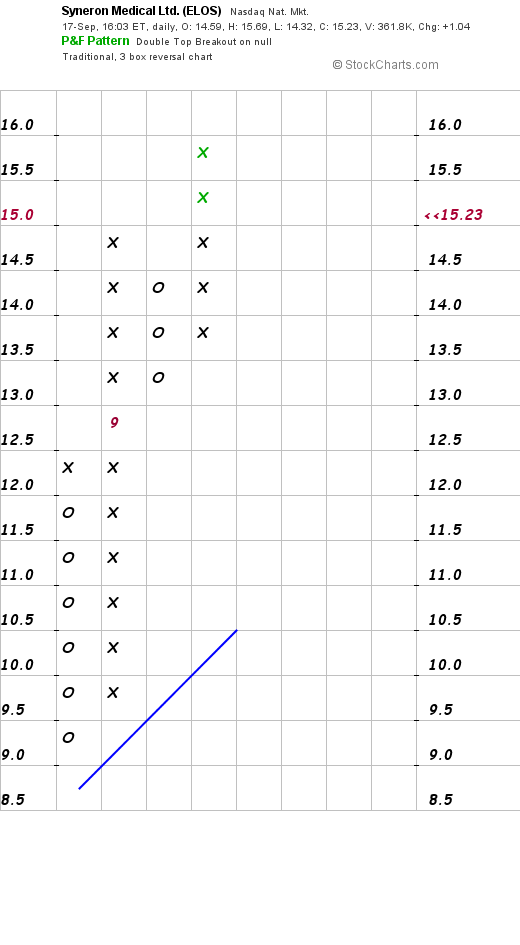
we can see that this stock appears to have been trading at about $12 in August, 2004, dropped to a support level of $9.00 later that month, and has just now been trading higher. Not much of a track record, but what is there looks good.
So what do I think? Well, this is a SMALL company and trades just over $10 making it a bit volatile...so be careful if you are 'weak at heart'. However, the recent earnings report is excellent, the earnings are growing solidly along with the revenue, free cash is improving and looks nice, the balance sheet is good, valuation is nice with a p/e in the low teens. However, no analysts are reporting making a PEG virtually impossible to estimate. And technically, although not a long period of time, the chart looks fine to me.
Unfortunately, I don't have any money to invest as I am waiting upon a sale of a portion of one of my existing holdings to justify adding a new position. If you have any questions or comments, please feel free to email me at bobsadviceforstocks@lycos.com .
Bob
Tuesday, 14 September 2004
September 14, 2004 eResearch (ERES)

Hello Friends! I do not have time for a full post right now but I came across eResearch (ERES) on the top gainers this morning and it appears to fit well into my criteria for a stock pick! ERES is trading at $17.36 as I write, up $.96 or 5.85% in an otherwise sloppy market. According to the
Yahoo "Profile" on ERES, the sompany "...provides technology and services that enable the pharmaceutical, biotechnology and medical device industries to collect, interpret and distribute cardiac safety and clinical data more efficiently." I do not own any shares or options on this company.
On July 21, 2004, ERES
reported 2nd quarter 2004 results. Revenues came in at $28.2 million, a 91% increase over the $14.8 million reported in the 2nd quarter 2003. Net income was $8.1 million, or $.15/diluted share, an increase of 194% compared with net income of $2.8 million or $.05/diluted share the prior year.
In addition, the company predicted positive sequential growth for the upcoming quarter of $30.0 to $30.5 million in revenue with earnings of $.16 to $.17/diluted share. In addition they RAISED guidance for the full year to revenues of $117 to $119 million from previous guidance of $114 to $116 million. This represents at least a 75% increase in revenue over the prior year. In addition they raised guidance on earnings per share to $.62 to $.63 for the full year, increasing from prior guidance of $.59 to $.60/share. This is a great report!

How about longer-term? If we look at a
"5-Yr Restated" financials from Morningstar.com, we can see that although revenue did drop between 1999 and 2001, from $42.8 million to $28.0 million, it has subsequently rebounded strongly to $67 million in 2003, and as noted in the prior paragraph, current estimates have been raised to at least $117 million in 2004.
Earnings during this period also dropped from $.11/share in 1999 to $(.08)/share in 2001, but subsequently rebounded strongly to $.27 in 2003, and again as noted earlier, estimates are for $.62 to $.63/share in 2004.
Free cash flow has been growing steadily with $(2) million in 2001, increasing to $32 million in the Trailing Twelve Months (TTM).
How about the balance sheet? Morningstar reports $62.1 million in cash and $21.7 million in other current assets, enough to cover the Current liabilitis of $27.3 million, almost three times over! In addition, ERES, per Morningstar, has NO long-term liabilities.
And valuation? Looking at
"Key Statistics" from Yahoo.com, we can see that this is a small cap stock with $987.61 million in market capitalization. The trailing p/e is a bit rich at 42.83, but with the fast growth the forward p/e (fye 31-Dec-05) is only 20.72 and the PEG is only 0.79.
Yahoo reports 51.82 million shares outstanding with 43.10 million of them that float. Of these, there were 9.89 milion out short as of 8/9/04, representing 22.95% of the float or 5.211 trading days. I like to use 3 trading days as an arbitrary point of reference, and with that as a guide, there are quite a few shares out there that have been sold short.
Yahoo reports no cash dividend and the company did recently split their stock 3:2 in May, 2004.
How about "technicals"? Looking at a Point & Figure chart from
Stockcharts.com:
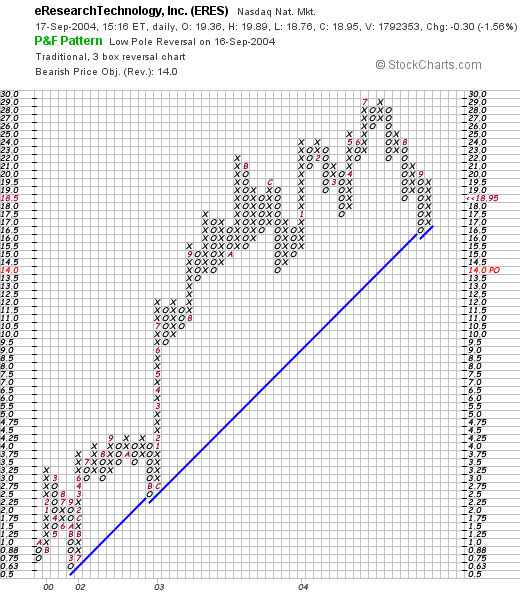
We can see that this stock has been trading very steadily higher since late 2001 from a $.75/share level to its current $20.00 level. The stock did manage to hit $29 in July, 2004, but has pulled back to its support level just recently.
So what do I think of this stock? I think it is a great investment! It recently reported great earnings results, raised guidance, has been steadily growing the last 3-4 years, is spinning off ever-growing amounts of free cash, has an excellent balance sheet, reasonable valuation wit a PEG under 1.0, has some short sellers that will need to cover, and a graph that shows it is not currently overextended imho. Only this is, like so often lately, I don't have any money to be investing. I am still waiting to sell a portion of one of my positions at a gain prior to adding a new position!
Thanks for stopping by! If you have any questions, comments or words of encouragement, please feel free to email me at bobsadviceforstocks@lycos.com. Please remember I am an amateur investor so please consult with your professional investment advisors prior to making any investment decisions as I am not responsible for either your losses or your gains!
Bob
Posted by bobsadviceforstocks at 9:15 AM CDT
|
Post Comment |
Permalink
Updated: Friday, 17 September 2004 2:20 PM CDT
Sunday, 12 September 2004
"Looking Back One Year" A review of stock picks from the week of August 18, 2003

Hello Friends! Thanks so much for stopping by and visiting my blog,
Stock Picks Bob's Advice. Usually, I try to post a review each weekend of what I have written about one year earlier in order to see how the stock picks have performed. Last weekend I was asleep on the job and didn't get to it! O.K. I am only human and I apologize. Did anyone notice? As always, please remember that I am an amateur investor so please do your own investigations before using any information on this website and consult with your professional investment advisors to make sure that any investments discussed are appropriate, timely, and likely to be profitable for you! If you have any comments or questions about this blog, please feel free to email me at bobsadviceforstocks@lycos.com .

On August 18, 2003, I
posted PolyMedica (PLMD) on Stock Picks at a price of $46.05. PLMD split 2:1 on 9/30/03 making our "pick price" actually $23.03. PLMD closed on 9/10/04 at $30.00 for a gain of $6.97 or 30.3%.
On July 27, 2004, PLMD
announced 1st quarter 2005 results. Revenues for the first quarter ended June 30, 2004, came in at $111.1 million, a 12.3% increase compared to the $98.9 million the prior year. Net income was $13.8 million, a 24.1% increase over the $11.1 million the prior year, and diluted earnings/share were $.50 a 13.6% increase compared to the prior year $.44/share. The company also announced they expected net revenues of $114-$118 million and diluted earnings per share of $.50-$.54 for the fiscal 2005 2nd quarter. It looks like PLMD is doing just fine!

Measurement Specialties (MSS) was
posted on Stock Picks on August 18, 2003, at a price of $12.31. MSS closed on 9/10/04 at $22.99 for a gain of $10.68 or 86.8%.
On August 4, 2004, MSS
announced 1st quarter 2005 results. For the first quarter ended June 30, 2004, net sales increased 7.6% to $28.0 million compared to $26.0 million the prior year. However, income from continuing operations came in at $3.3 million or $.23/diluted share compared with $3.7 million, or $.29/diluted share the prior year. My preference is always to note increasing earnings along with revenue growth, so this is not quite as attractive to me as other news. However, the stock price has done well, and apparently the street is still quite bullish on future prospects.
On August 19, 2003, I
picked Dynacq (DYII.PK) at a price of $24.50. This has been a very disappointing selection and the company has been dropped to the "pink sheets" and thus the change in symbol due to apparent accounting questions. DYII.PK closed at $6.35 on 9/10/04, for a loss of $(18.15) or (74.1)%. With all of the accounting problems, it is hard to even sort out the latest quarter results and thus, I will refrain from commenting on that portion of the stock. Clearly, this type of development supports the need for clearly placed loss-limits, which for my trading portfolio, is represented by an 8% loss.

On August 21, 2003, I
posted Lifeway Foods (LWAY) at $14.51. LWAY split 2:1 on 3/9/04 so our effective pick price was $7.26. LWAY closed on 9/10/04 at $10.30 for a gain of $3.04 or 41.9%.
On August 16, 2004, LWAY
reported 2nd quarter 2004 results. Revenue rose 6% to $4.002 million compared to $3.78 million last year. Net income was $432,109, or $.05/share, compared with $691,082 or $.08/share, a decrease of 38% from the prior year. The decrease was attributed to the temporary spike in milk prices during the quarter, but the street didn't like this result anyhow, and the stock price has pulled back subsequent to this news.

On August 22, 2003, I
posted DJ Orthopedics (DJO) on the blog at $10.89. DJO closed on 9/10/04 at $20.97 for a gain of $10.08 or 92.6%.
On July 27, 2004, DJO
announced 2nd quarter 2004 results. Net revenues for the quarter ended June 26, 2004, totaled $63.2 million, a 33.2% increase compared with $47.4 million reported the prior year. Net income for the quarter, excluding redemption of some Notes as reported, was $4.7 million, or $.21/share a 75.6% increase from $2.7 million or $.15/share reported the prior year. DJO continued to stand behind optimistic guidance of $260 million for the full 2004 year. This was a nice report!

Finally, on August 22, 2003, I
posted Electronics Boutique (ELBO) on Stock Picks at $32.30/share. ELBO closed at $33.27 on 9/10/04 for a gain of $1.07 or 3.3%.
On August 19, 2004, ELBO
announced 2nd quarter 2004 results. For the quarter ended July 31, 2004, revenue increased 19.8% to $362.0 million, from $302.1 million the prior year. During the quarter, same-store-sales actually DECLINED 2.2%. Net income increased 132.4% to $3.9 million or $.16/diluted share exceeding previously announced expectations, compared with $1.7 million or $.07/diluted share the prior year.
So what does all of that mean? Well, sales were up apparently by adding outlets since same store sales actually dipped. However, the earnings picture improved dramatically, so the report appears to be a wash. I would resist recommending any retail stock to anyone which had declining same store sales like this stock!
So how have we done this past year? Of these six stocks, five had gains, ranging from 3.3% for ELBO to 92.6% for DJ Orthopedics. Unfortunately, we had a weak performer in Dynacq (DYII.PK) which lost (74.1)% of its value. Even with Dynacq, the average GAIN was 30.1%, an outstanding performance for that particular week a little more than a year later!
Thanks again for stopping by! Please excuse the lack of organization in all of these posts, but by browsing through the dates on the left, you can review all of my past posts. Again, remember I am an amateur investor so get professional advice before making decisions based on what I write, and please feel free to email me at bobsadviceforstocks@lycos.com as I love to hear from readers with their comments and questions! Have a great week everyone!
Bob
Posted by bobsadviceforstocks at 11:19 PM CDT
|
Post Comment |
Permalink
Updated: Monday, 13 September 2004 1:07 PM CDT
Saturday, 11 September 2004
September 11, 2004 Leadis (LDIS)

Hello Friends! It is hard to write anything at all about stocks without first thinking of the thousands that perished at the hands of terror three years ago. I salute all of those who lost their lives in NYC and at the Pentagon and in a field in Pennsylvania. I remember getting to work and having an associate show me the live shot of the World Trade Center first tower burning after being hit. My first thought was that it must have been just another one of those freak small plane accidents. Then the second tower was hit. Then the first came down followed not long after by the second. Those images don't just leave your mind. On a positive note, I open with the Daniel Liebeskind project drawing so that we may all look forward to the future as we memorialize the past.
I was scanning through the
list of top NASDAQ % gainers yesterday and came across Leadis Technology Inc (LDIS). I do NOT have any shares or options in this company. And please remember, I am an amateur investor, so please consult with your professional investment advisors prior to making any investment decisions based on information on this website. LDIS had a very nice day today, closing at $12.68, up $2.73 or 27.44% on the day.

According to the
Yahoo "Profile", LDIS "...designs, develops and markets mixed-signal semiconductors that enable and enhance the features and capabilities of small-panel displays. The Company's core products are color display drivers with integrated controllers, which are critical components of displays used in mobile consumer electronics devices."

Doing a little detective work, the only thing I could see that drove the stock higher yesterday was their participation in an
SG Cowan & Co. Fall Technology Conference yesterday with an associated webcast. This is about an hour long presentation, so you can listen on the net to what the company had to say if you register there. The introductory point is that Leadis sells to hand-set phone manufacturers, the company is only four years old, and has customers including Nokia, Samsung, and LG, which are the 3/5 top manufactures in this market, representing 55% of the hand-set phone market.

On July 28, 2004, LDIS
announced 2nd quarter 2004 results.Revenue came in at $41.3 million, an increase of 19% over the prior quarter revenue of $34.8 million, and an over 200% increase over the prior year same quarter revenue of $13.8 million. Net income per diluted share came in at $.24/share an over 25% increase from the $.19/share reported the prior quarter and an over 300% increase from the prior year $.05 result. In addition, LDIS raised guidance for the 3rd quarter 2004 results to revenue between $40-$43 million from the $21 million the prior year. GAAP diluted eps is expexted to be between $.13 to $.16/share.
This company is only four years old so we don't have 5 year results, however looking at the
"5-Yr Restated" financials from Morningstar.com, we can see how revenue has grown from $1.2 million in 2001, $7.9 million in 2002, and $84 million in 2003. With the current and upcoming quarter at around $40 million, the $160 million revenue target appears reasonable for 2004.
Earnings turned positive in 2003 at $13 million, and from the recently announced earnings report, we can see that net income was $7 million in the second quarter alone, with a target of $28 million for the year if we extrapolated the current result (?).
Free cash flow was $(1) million in 2001, $(4) million in 2002, but turned positive at $13 million in 2003.
According to Morningstar.com, the balance sheet looks just fine with $23 million in cash and $37 million in other current assets, enough to cover both the current liabilities of $33.5 million and the $14.6 million in long-term liabilities combined.
How about valuation? For this I like to look at
Yahoo "Key Statistics". Here we can see that this is a small cap stock with a market cap of only $348.38 million. The trailing p/e is very nice at 13.80 with a forward p/e (fye 31-Dec-05) of 15.85. The PEG is beautiful at 0.76, and the Price/Sales isn't too bad at 1.97.
Yahoo reports 27.48 million shares outstanding with only 6.00 million that float. There are 269,000 shares out short as of 8/9/04, representing 4.48% of the float or 2.745 average trading days, so in my view, this doesn't look too bad either. There are no cash dividends, and no stock splits reported on Yahoo.
How about "technicals"? Looking at
Stockcharts.com for a
Point & Figure chart on LDIS:
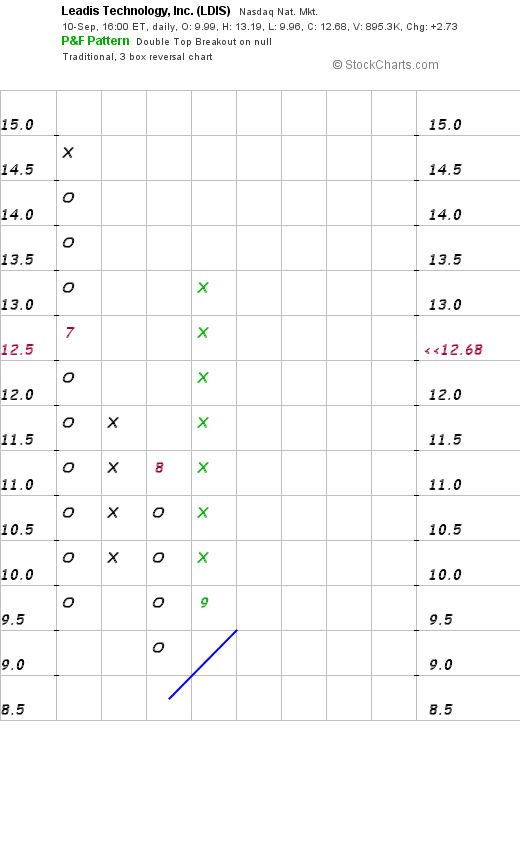
we can see a limited graph, with the stock coming public in June, 2004, dropping from $14.5 to $9.5 and then moving up from this new support level. This is a small company with limited technicals to follow.
So what do I think? Well this is a fascinating company with explosive growth. I do not know what the barriers to entry are but the company does have great recent earnings results, strong fundamentals, reasonable valuation, and might just be one of those that you can "hit out of the park." Unfortunately, I am not in the market to buy anything, but if I were, I might be looking at this. I am always worried about buying low-priced stocks though; if it pulls back just a point, you will hit your 8% stop on a $12 stock. But then again, we sure have seen some stocks really power ahead when they have news and fundamentals like this!
Thanks again for stopping by! If you have any questions, comments, or words of encouragement, please feel free to email me at bobsadviceforstocks@lycos.com
Bob
Posted by bobsadviceforstocks at 9:13 AM CDT
|
Post Comment |
Permalink
Updated: Saturday, 11 September 2004 10:54 AM CDT
Wednesday, 8 September 2004
September 8, 2004 Sierra Wireless (SWIR)
Hello Friends! As always, I am delighted that you could take the time to visit my blog. I am quite the amateur. The place is a mess :) so make yourself at home, you can sit on the sofa, or the Lazy Boy...and browse through the collection of posts that I have here on my blog,
Stock Picks Bob's Advice. Just make sure you are aware that I am an amateur investor so please consult with your professional investment advisors prior to making any investment decisions based on information on this website. Also, if you have any questions or comments, please feel free to email me at bobsadviceforstocks@lycos.com.

As a review, and for those of you who are not familiar with my methods (or is it madness?), the first place I like to "prospect" for stock market ideas is in the lists of greatest percentage gainers for the day. You might ask "Why that list?" and I don't have a better answer than "If I am going to pick a stock TODAY to tell you about, why not pick a stock that is moving UP strongly today?" I am sure there are many other methods of looking at stocks, but that is just something I have been doing!
Anyhow, today on the
list of top % gainers on the NASDAQ, I came across Sierra Wireless, Inc. (SWIR), a stock that I do NOT own any shares nor do I own any options. SWIR closed today at $19.15, up $3.18 or 19.91% on the day!

What drove the stock higher today was an
announcement was a collaboration with Intel (INTC) that would "...deliver integrated wireless connectivity solutions to mobile professionals worldwide." In more 'techno-speak', they were collaborating to develop and promote "...integration in wireless local area networking (WLAN) and wireless wide area networking (WWAN) to provide a better user experience." Not being one who knows a WAN from a LAN, I will defer to more sophisticated observers, but the market thought this was indeed good news and rewarded the stock price accordingly.
Well the second thing I like to check when looking at a new stock pick is the latest quarterly report. In this way, I try to find out whether the latest earnings news demonstrates that the company is doing well...what do I look for?...I like to look at revenue, earnings, and any comments regarding future guidance. Hopefully all of these will be positive.
On July 21, 2004, SWIR
announced 2nd quarter 2004 results. For the quarter ended June 30, 2004, revenue came in at $51.6 million, a 24% increase over the first quarter of 2004 (sequential growth), and a 149% increase over the $20.7 million in revenue in the same period of 2003. This in itself is a terrific report! Net earnings for the quarter came in at $6.0 million or $.23/diluted share, compared to $3.3 million or $.13/diluted share the PRIOR quarter (sequential growth), and compared to $.05/diluted share in the second quarter of 2003. In addition, they provided strong guidance of $57 million for the upcoming quarter or $.24/diluted share, again predicting continued sequential growth in both earnings and revenue for the upcoming quarter. I like this report a lot.
How about longer-term? If we take a look at
"5-Yr Restated" financials from Morningstar.com, we can see that revenue has grown sequentially from $24.6 million in 1999 to $101.7 million in the trailing twelve months (TTM). Earnings which were positive at $.23/share in 1999, dropped sequentially to a low of $(2.57)/share in 2002, only to increase to a profit of $.12/share in 2003. With current earnings and projected earnings of around $.25/share each quarter, the company is working on around $1.00/share for 2004.
According to Morningstar.com, free cash flow has also been steadily improving recently with $(32) million in 2001, improving to $(7) million in 2002, and turning positive at $12 million in 2003. The balance sheet is also quite nice with $85.1 million in CASH, more than enough to cover BOTH the $30.1 million in current liabilities and the very small $2.3 million in long-term debt. In addition, Morningstar reports SWIR with an additional $25.3 million in other current assets. Looks pretty good to me!
The next think I like to review are some valuation parameters. For this, I like to check the
Yahoo "Key Statistics" on SWIR. Here we can see that the market cap is a small cap $481.78 million. The trailing p/e is rich at 51.48, but the forward p/e is dramatically lower (fye 31-Dec-05) at 18.24. Thus, the PEG isn't bad, but not really 'cheap' at 1.53. Yahoo reports 25.16 million shares outstanding with 15.10 million of them that float. There are 1.85 million shares out short, representing 12.24% of the float as of 8/9/04, but even this level is only 1.183 trading days of short shares...so imho, using 3 days as a 'cut-off' this doesn't look like "squeeze" material to me. No cash dividends are reported and no stock splits are mentioned on Yahoo.
What about technicals? I am NOT much of a technician at all (!!!) so always take this portion of my examination with a grain or two of salt....but here goes.....looking at a point and figure chart for SWIR, from
Stockcharts.com, a GREAT place to look at graphs:
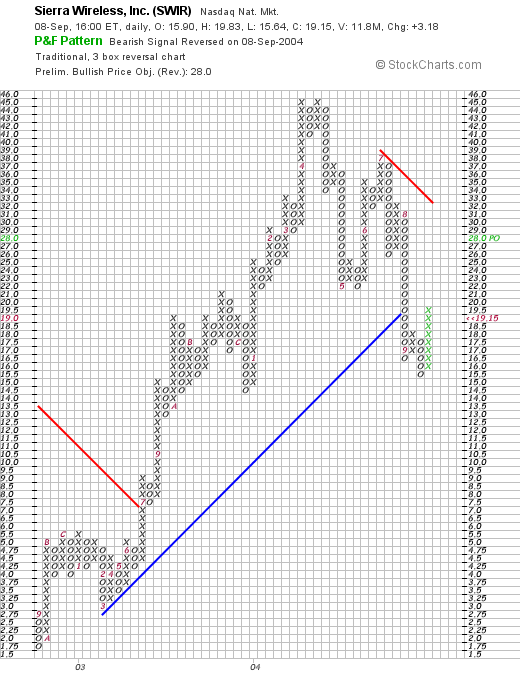
we can see that this stock was trading steadily higher from September, 2002, when it was as low as $1.75/share, until late August, 2004, when it broke down below a support line at about $19.50. (It had peaked around $45/share in April, 2004.) Currently, it is moving back ABOVE the support line, and this looks bullish to me. I would like to see the stock hold the current level and move higher to the $23 level to confirm its momentum. (Again, I am NOT a technician, but have provided you with a chart to review as well!)
So what do I think? Well, the world is certainly going wireless, and this stock is VERY interesting. Especially the recent collaboration with Intel, which with its "Centrino" chip and built-in wireless devices, is looking to grow into this segment. The latest earnings looks GREAT. The past five years has seen explosive growth. The free cash flow is turning nicely positive and the balance sheet is superb. Valuation might be a bit nicer, but then you can't always have EVERYTHING :). (It is ok to try though). And the graph looks ok to me. The stock has pulled back from its recent highs and looks to be moving higher once again.
Now if I just had some MONEY to invest lol. As you know, I just sold my shares of RAD and am waiting patiently (can you believe I am still SITTING on my hands) until I can sell a few shares of one of my current positions at a targeted gain level. So I can't buy anything anyway....but this kind of stock would be on my purchase list if I WERE in the market!
Thanks again for stopping by! If you have any questions, comments, or words of encouragement, I would love to hear from you at bobsadviceforstocks@lycos.com
Bob
Tuesday, 7 September 2004
September 7, 2004 Aviall (AVL)
Hello Friends! Thanks so much for stopping by! I hope that you find lots of things that get you thinking but please always remember I am an amateur investor, so please consult with your investment advisors prior to making any investment decisions based on information on this website to make sure they are timely and appropriate for you! If you have any questions, comments, or words of encouragement, please feel free to email me at bobsadviceforstocks@lycos.com .

I was looking through the
list of top NYSE % gainers today and came across Aviall (AVL). I do not own any shares nor do I have any options in this stock. AVL closed today at $21.30, up $.88 or 4.31% on the day. According to the
Yahoo "Profile", AVL "...is engaged in the distribution and supply of new aviation parts, supply-chain management and other related value-added services, primarily to the aerospace aftermarket and the provision of online inventory information services ot aerospace, defense and marine industries."

On July 14, 2004, AVL
reported 2nd quarter 2004 results and raised earnings guidance for fiscal 2004. Net sales for the quarter ended June 30, 2004, came in at $314.0 million, a 25% increase over the $250.8 million for the same quarter last year. Operating income was $20.5 million, up $3.9 million or 24% from last year. AVL earned $.40/diluted share compared with a loss of $(1.35)/diluted share in the 2nd quarter of 2003. Excluding some non-recurring expenses in that quarter the pro forma diluted results in 2003 were $.24/share.
For a longer-term perspective, I like to check the Morningstar.com
"5-Yr Restated" financials on AVL. In this view we can see that revenue has grown steadily since 1999, with accelerated growth since 2001. $372 million in sales in 1999 with $1.05 billion in sales in the trailing twelve months (TTM).
Earnings have been erratic with $.53/share in 1999, dropping to a loss in 2003 and the TTM. The latest quarter and the improved guidance suggests the company is turning around and is now profitable once again.
Free cash flow has improved from a negative $(93) million in 2001, to $42 million in the TTM.
The balance sheet, as reported by Morningstar.com, shows $11.4 million in cash and $493.9 million in other current assets, balanced against $158.6 million in current liabilities and $208.4 million in long-term liabilities.
What about "valuation"? If we take a look at
"Key Statistics" from Yahoo, we can see that this is a small cap stock with a market cap of $691.7 million. The trailing p/e is reasonable at 17.30 with a forward p/e (fye 31-Dec-05) of 16.17. The PEG is thus nice at 1.19. (anything close to 1.0 with the PEG is reasonable to me.)
Yahoo reports 32.40 million shares outstanding with 30.60 million shares that float. Of these there were 525,000 shares out short as of 8/9/04, representing 2.692 trading days or 1.72% of the float. This does not seem to be a lot of shares out short.
No cash dividend and no stock dividends are reported on Yahoo.
What about "Technicals"? Looking at a
Point & Figure chart from Stockcharts.com:
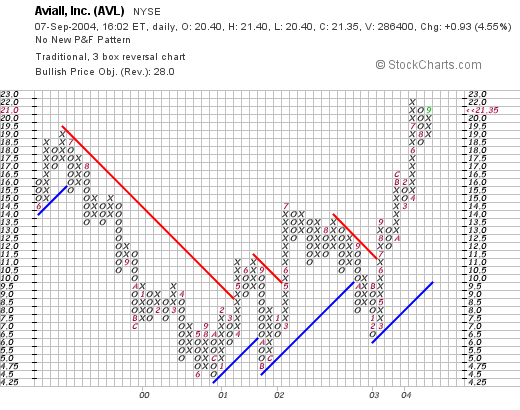
we can see that the stock was trading LOWER from June, 1999, when it was trading at around $19.50/share and then corrected all the way down to $4.50 in October, 2000. It has traded higher since and recently is trading well above its suport level as the stock price trades higher.
Overall I like this stock. The recent earnings report was solid, although the prior 12 months have not been very profitable for this company. The free cash flow is improving, the balance sheet is solid, and the valuation isn't bad. Technically the stock is breaking out to higher ground. As always, I am sitting on my hands until such time as one of my holdings in my "Trading account" is sold, and then I can add a new postion!
Thanks again for stopping by! If you have any questions, please feel free to email me at bobsadviceforstocks@lycos.com
Bob
"Trading Transparency" RAD
Hello Friends! I wanted to pass on a trade today that I just did in my
"Trading Portfolio". I just sold my last 225 shares of RAD at $3.71. One thousand shares were acquired at $2.62 12/19/02, so I have held them almost two years. In fact, they really DON'T fit into my investment strategy on this blog but I have held them and managed them the same way. Thus, I made $1.09/share or 41.6%.
If I was ahead so much why did I sell? RAD is currently trading at $3.72, down $.83 or 18.24% today. They dropped because of a
management announcement that sales for the year ending Feb. 26, 2005, would be between $16.9 billion and $17 billion with same store sales up 2.75% to 3.25%. Previous guidance was for sales between $17.1 and $17.3 billion with same store sales up 3.75% to 4.75%. With the cutting of estimates, the stock tumbled.
This was not my first sale. I sold 400 shares at $3.77 5/6/03 for a gain of $1.15/share or 43.9%. I then sold 150 shares 6/16/03 at $4.33 for a gain of $1.71/share or 65.3%, 150 shares on 9/3/03 for $4.93 for a gain of $2.31/share or 88.2%, and 75 shares at $5.93 for a gain of $3.31 or 126%. Today, with the decline dropping me below my 50% retracement of the last gain, I pulled the plug and let RAD go.
Currently I am down to 17 positions in my Trading Account. I plan on a maximum of 25 positions, but will wait until I have sold a portion of one of my holdings at a gain before adding another position.
Thanks so much for stopping by. Please remember that I am an amateur investor so please consult with your professional investment advisor before acting on any information on this website. If you have any questions, comments, or words of encouragement, please feel free to email me at bobsadviceforstocks@lycos.com .
Bob
Thursday, 2 September 2004
September 2, 2004 Polaris Industries (PII)
Hello Friends! It is late Thursday evening, and I cut away from the President's acceptance speech at the Republican Convention because I remembered there was a stock I wanted to discuss on my blog,
Stock Picks Bob's Advice. As always, please remember that I am an amateur investor, so please discuss all of these investment ideas on this website with your own professional investment advisors and do your own investigation to make sure they are appropriate and timely for you! And if you have any questions or comments, please feel free to email me at bobsadviceforstocks@lycos.com .

This afternoon, as I was examining the
lists of top % gainers on the NYSE and came across Polaris Industries (PII) which closed at $51.00, up $2.53 or 5.22% on the day. I do not own any shares of this stock nor do I own any options. According to the
Yahoo "Profile", Polaris "...designs, engineers, manufactures and markets all-terrain vehicles (ATVs), snowmobiles, motorcycles and personal watercraft as well as related replacement parts, garments and accessories."

What drove the stock higher today was the
announcement from Polaris that they would be dropping their marine and watercraft division which lost money for the company in 2003. The "street" applauded the wisdom of this move by rewarding the stock price with a multi-percent gain in price!

On July 15, 2004, PII
reported 2nd quarter 2004 results. Revenue for the quarter ended June 30, 2004, came in at $422.3 million, up 12% from the prior year's second quarter sales of $377.1 million. Net income came in at $.54/diluted share, a 15% increase over the prior year's $.47/diluted share. In addition, PII increased full year 2004 earnings guidance to $2.72-$2.84/share. This was a nice quarterly report!

How about longer-term? If we look at a
"5-Yr Restated" financials from Morningstar.com, we can see that during the past five years revenue has grown steadily from $1.3 billion to the $1.7 billion reported in the Trailing Twelve Months (TTM). Earnings per share have also grown steadily from $1.54 in 1999 to $2.50 in the TTM. In addition, the dividend has grown steadily from $.40/share in 1999 to $.70/share in the TTM. You don't often get a steadily increasing dividend ALONG WITH steadily increasing revenue and earnings!

According to Morningstar.com, the free cash flow has also been fairly solid at $135 million in 2001, dropping to $94 million in 2003, but increasing back to
$135 million in the TTM.
The balance sheet also looks nice with $26.3 million in cash and $321.2 million in other current assets according to Morningstar, as compared to $287.3 million in current liabilities and only $29.5 million in long-term liabilities. Clearly current assets are plenty to cover BOTH current and long-term liabilities.
How about valuation? According to Yahoo
"Key Statistics", this is a mid-cap stock with a market cap of $2.18 billion. The trailing p/e isn't bad at 19.87 with a forward p/e of 16.29 (fye 31-Dec-05). The PEG however, isn't quite as inexpensive at 1.42, but the Price/Sales is only 1.23.
Yahoo reports 42.65 million shares outstanding with 42.10 million of them that float. Of these shares, as of 7/8/04, there were 4.56 million shares out short, a HUGE ratio of 23.03 trading days representing 10.83% of the float. This stock moved up nicely today, and if it continues its rise, a SHORT SQUEEZE isn't completely out of the question imho.
According to Yahoo, the company is currently paying a $.92/share dividend yielding 1.90%. The stock split 2:1 earlier this year in March, 2004.
How about "technicals"? If we take a look at a "point&figure" chart from
Stockcharts.com:
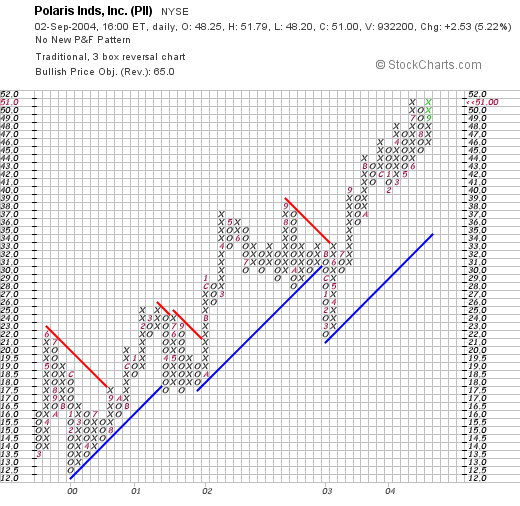
we can see a beautiful upward movement of the stock price from $12.00/share in early 2000 to the current $50/share level today. Except for a drop below the support line in early 2003 when it dropped down to $22, the stock has been trading at or above its "support lines".
So what do I think? I like this stock....lol that's probably why I posted it! What I mean is that the stock had a nice move upward today on news of the discontinuation of its marine division which was losing money for PII. The latest earnings report a few weeks ago was solid with growth in earnings, revenue along with an upward revision of earnings and revenue expectations for 2004. The Morningstar.com report is gorgeous, with steady revenue, earnings and yes, even DIVIDEND growth the past 5 years. The company is spinning off a solid amount of free cash and the balance sheet is clean (imho.) The p/e isn't bad although for perfection's sake, I would rather have the PEG at or under 1.0. I even like the large # of short sellers even though I don't like betting against them....if they are wrong, they will have to cover their shorts! Technically, the stock graph is also quite strong.
The only PROBLEM, lol, is that I don't have any money to buy any stocks! I can only buy stocks in my system of trading when I have sold a portion at a gain...and nothing there yet!
Thanks again for stopping by! If you have any comments, questions, or words of encouragement, please feel free to email me at bobsadviceforstocks@lycos.com .
Bob
Wednesday, 1 September 2004
September 1, 2004 The Cooper Companies (COO)
Hello Friends! It is getting late in the evening, but I do have a stock to post! Actually, I have SO MANY stocks discussed here on
Stock Picks Bob's Advice, that I thought that I had actually discussed this one, Cooper (COO), already! Actually, the confusion is that I DO OWN shares of COO in my
"Trading Portfolio", that were initially purchased in February, 2003. You see there's the rub....I purchased it BEFORE I started my Blog! Anyway, thanks again for stopping by and visiting and be sure to consult with your professional investment advisors prior to making any investment decisions based on information on this website, as I am an amateur investor. If you have any questions or comments about this website, please feel free to email me at bobsadviceforstocks@lycos.com and I will try to get right back to you!

The Cooper Companies (COO) had a nice day today, closing at $63.33, up $5.38 or 9.28% on the day. As I noted above, I DO own some shares of COO in my trading account, which I also follow on this website. According to the
Yahoo "Profile", The Cooper Companies "...develops, manufactures and markets healthcare products through its two principal business units: CooperVision (CVI) and CooperSurgical (CSI). CVI develops, manufactures and markets a range of contact lenses for the worldwide vision care market. CSI develops, manufactures and markets medical devices, diagnostic products and surgical instruments and accessories used primarily by gynecologists and obstetricians."

What drove the stock higher today, and I feel like I am beginning to sound like a broken record, was an earnings report and the Management ALSO raising guidance on upcoming earnings. Yesterday, after the close of trading, COO
announced Third Quarter 2004 results. Revenue came in at $129.1 million, a 16% increase when results are adjusted for currency fluctuations. Earnings came in at $.58/share, up 21% from the prior year. In addition, COO raised fiscal 2004 revenue guidance to $488-$493 million and EPS of $2.59-$2.61, up from prior revenue guidance of $483-$493 million and earnings of $2.55-$2.58/share. Although not a large increase in guidance, the fact that guidance was being raised was enough to spark a run on the stock.

How about longer-term? If we look at a
"5-Yr Restated" financials on Morningstar.com, we can see that revenue growth has been steady, increasing from $168.2 million in 1999 to $451.7 million in the Trailing Twelve Months (TTM).
Earnings per share have also increased EACH AND EVERY YEAR from $.88/share in 1999 to $2.40 in the TTM. In addition, COO has been paying a dividend at least since 1999 when it was $.02/share and has been intermittently been raising it to the $.06/share in the TTM.
How about Free Cash Flow? This also looks nice with $9 million in free cash flow reported in 2001, increasing to $47 million in the TTM.
And how about the Balance sheet? According to Morningstar numbers, this looks very nice with $23.1 million in cash and $231.1 million in other current assets, enough to cover the $113.5 million in current liabilities AS WELL AS pay off most of the Long-term liabilities from the Current Assets alone.
And valuation? Looking at
Yahoo "Key Statistics" , we can get most of this information. This is a mid cap stock (there are many definitions, but if we use under $10 billion down to about $2 billion, this fits in at $2.07 Billion in capitalization.) The trailing p/e isn't bad at 26.39 and the forward p/e (fye 31-Oct-05) is even nicer at 20.83. The PEG isn't bad at 1.13, and the price/sales is a bit richer at 4.19.
Yahoo reports 32.67 million shares outstanding with 31.40 million of them that float. Of these shares, 2.31 million shares are out short, a bit of a heavy short interest representing 3.794 trading days or 7.35% of the float. (I use 3.0 trading days arbitrarily as a cut-off to ascertain whether I think the # of shares out short is "significant".)
The stock dividend which I have already discussed is $.06/share or 0.10%. The last stock split was a 2:1 in November, 2002.
And what do the 'Technicals' look like? If we look at a Point and Figure chart from
Stockcharts.com:
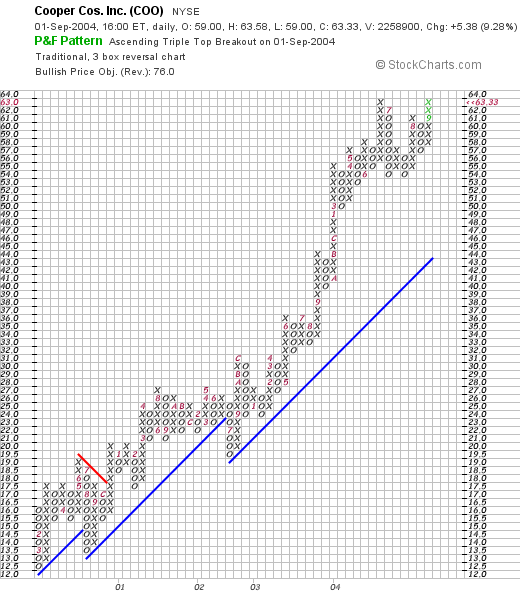
we can see what in my opinion is a BEAUTIFUL stock graph from at least as far back as 2000 when it was trading at $12.50 to its current level of $63 range. If anything, the stock price looks a wee bit ahead of itself.
So what do I think. Hey I really like this stock a lot. In fact I OWN shares in this stock. The recent earnings report was strong, they just RAISED guidance for the rest of the year, the steady growth in revenue, earnings and dividends is very impressive. The free cash flow is positive and growing and the balance sheet looks clean. The valuation isn't really bad, there are a bit of a heavy # of shares already out SHORT....and yes, the graph looks strong.
Thanks again for stopping by! Again if you have any questions, please feel free to email me at bobsadviceforstocks@lycos.com.
Bob
Sunday, 29 August 2004
"Looking Back One Year" A review of stock picks from the week of August 11, 2003
Hello Friends! Thanks so much for stopping by! I have had a quiet week on the blog, with a combination of not seeing much new that I liked, and just being away from my computer as well. I think I will be starting to "revisit" stocks that I have not discussed in a year or so that make nice moves in the market. Just a thought. As always, please remember that I am an amateur investor, so please consult with your professional investment advisors and do your own investigations prior to making any investment decisions based on material on this website!

I
selected Possis Medical (POSS) for
Stock Picks Bob's Advice on August 11, 2003, at $17.33. POSS closed on 8/27/04 at $18.04 for a gain of $.71 or 4.1%.
On May 18, 2004, POSS announced
3rd quarter 2004 results.
Sales came in at $19.3 million for the fiscal quarter ended April 30, 2004, up 32% from the prior year. Net income was $.16, a 60% increase, from the $.10 in the prior year. These were nice results.
However, on August 24, shares of POSS dropped as much as 41% after the company
cut revenue outlook for fiscal 2005 to $85-$90 million from previous forecast of $92 million to $98 million on disappointing study results for its AngioJet blood clot treatment after heart attacks. This is not the kind of news that is helpful in moving a stock higher!

I
posted Techne (TECH) on this blog on August 12, 2003, at a price of $32.08. TECH closed on 8/27/04 at $40.75 for a gain of $8.67 or 27%.
On August 10, 2004, TECH
released unaudited 4th quarter 2004 results. Consolidated net sales for the quarter ended June 30, 2004, were $42.5 million, an 8% increase over the prior year. Consolidated net earnings were $13.4 million or $.32/diluted share compared with $12.7 million or $.31/diluted share the prior year. These results are o.k. if not stellar.

On August 14, 2003, I
posted Tyler Technologies (TYL) on this blog at $5.75/share. TYL closed at $9.04 on 8/27/04 for a gain of $3.29 or 57.2%.
On July 28, 2004, TYL
announced 2nd quarter 2004 results. Revenue for the quarter ended June 30, 2004, increased 22% to $44.3 million from $35.1 million last year. Net income for the three months was $3.0 million or $.07/diluted share up from $2.0 million, or $.04/diluted share the prior year. These were very nice results and you can see that the stock price has responded appropriately!
Well, how did we do with these three stocks now that it is a year later? Well all three had gains with 4.1% appreciation for POSS, 27% for TECH, and 57.2% for TYL. The average gain for the three was 29.4% for the one year period.
Thanks so much for stopping by! Remember, past results DO NOT guarantee future results, and that I am an amateur and you really need to do your own investigation on all of these stocks and consult with your professional investment advisors! As always, if you have any questions, comments, or words of encouragement, please feel free to email me at bobsadviceforstocks@lycos.com
Bob
Newer | Latest | Older


