Stock Picks Bob's Advice
Wednesday, 29 September 2004
September 29, 2004 Perot Systems (PER)

Hello Friends! I cannot think of a more timely post...maybe a few years late? We are focussed on the stock market on this
, but sometimes, quite frankly, I have "blog-envy". I kind of wish I could dabble into the political issues facing America today. But that would be enough for a whole different blog, so I will try to stay on topic and get down to some stock picks! As always, please remember that I am an amateur investor, so please remember to consult with your professional investment advisors. If you have any comments, questions, or words of encouragement (discouragement?), please feel free to email me at bobsadviceforstocks@lycos.com .

As is my usual habit, I start my search for the "great stock pick" by looking through the
lists of top % gainers. Emphasizing stocks over $10, I came across Perot Systems (PER) which is currently trading at $16.14, up $.61 on the day or 3.93%. I do not own any shares of PER nor do I own any options.
This company is the same on associated with the third party candidate Ross Perot.

On September 24, 2004, PER
announced management changes That included Ross Perot's giving up the title of President and CEO; a position to be assumed by Peter Altabef, the current Vice President of the Company. According to the
Yahoo "Profile", PER "...is a worldwide provider of information technology (IT) services and business solutions to a range of customers.
Another thing driving the stock higher, besides the semi-retirement of the founder, is the
announcement by Perot that 3rd quarter results would be higher than expected. The latest company guidance was for $.21 to $.21/share in earnings on revenue of $448 to $460 million. Previously, they had guided to $.17 to $.18/share of earnings with a revenue target of $430 to $445 million for the quarter. Quite frankly, the raising of estimates is one of the strongest indicators I know that is predictive for future price appreciation.
On August 3, 2004, Perot Systems
announced 2nd quarter 2004 results. For the quarter ended June 30, 2004, revenue was $434 million, a 20% increase in revenue. Net Income came in at $21.9 million vs. $4.9 million the prior year. On a per share basis, this worked out to $.18/share this year compared to only $.04/share last year.
How about longer-term? For this, I like to turn to the
"5-Yr Restated" financials from Morningstar.com. Her we can observe the fairly uninterrrupted revenue growth (except for a dip between 1999 and 2000) from $1.2 billion in 1999 to $1.6 billion in the trailing twelve months (TTM). Earnings per share have been erratic dropping from $.49 in 2000 to $(.03) in 2001, up to $.68 in 2002 and only $.62/share in the TTM.
Free cash flow looks nice, with $64 million in 2001, improving to $89 million in the TTM. The balance sheet, as a result of the free cash flow, also looks excellent, with $166.9 million in cash, $313.2 million in other current assets, $295.9 million in current liabilities and only $19.5 million in long-term liabilities.
How about "valuation"? For this I like to check
Yahoo "Key Statistics" where some interesting data is found. First, this is a mid-cap stock with a market cap of $1.85 billion. (Per
Ameritrade definitions, Small-cap is less than $500 million, Mid-cap between $500 million and $3 billion, and Large-cap over $3 billion.) The trailing p/e is 26.18, and a forward (fye 31-Dec-05) p/e is at 18.94. The PEG isn't bad at 1.40. Price/sales is even more reasonable at 1.10.
Yahoo reports 114.97 million shares outstanding with 75.70 million of them that float. There are currently 2.52 million shares out short, representing 3.33% of the float, and 8.853 trading days. (I arbitrarily use 3 days of short interest as a cut-off for significance, and this stock with almost 9 days of short sales, is thus quite significant!)
Yahoo does not report any stock splits or cash dividends.
What about "technicals"? For this I turn to
Stockcharts.com, where I like to look at a "Point & Figure" chart. I find these charts helpful to assess the short and long-term moves of a stock price.
For PER this looks like:
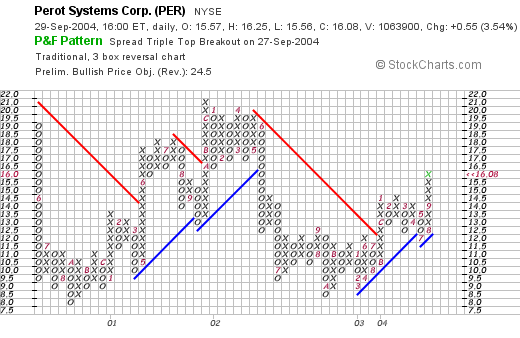
Basically, this stock appears to be trading sideways having hit $8.00 twice, once in 2000, and once again in early 2003. Since early last year, PER has been climbing steadily along its support line. The stock graph looks nice to me, with a short term breakout beyond the resistance line and a recent move higher.
So what do I think about Perot Systems? Well, I never DID vote for Ross, and have never owned any of his shares, but this one looks just fine to me. The latest increased guidance for the 3rd quarter is bullish, the latest quarterly report is just fine. Longer-term, the company continues to grow. And valuation isn't too bad at all. The graph looks positive and certainly not overdone. Now, if I just had some cash to buy some shares!
Thanks so much for stopping by! If this is your first visit, please feel free to browse through my many prior posts! Again, if you have any questions, or comments, please feel free to email me at bobsadviceforstocks@lycos.com .
Bob
Friday, 24 September 2004
September 24, 2004 Digital Theatre Systems (USA) (DTSI)
Hello Friends! Thanks again for stopping by my blog,
Stock Picks Bob's Advice. Please remember that I am an amateur investor, so before making any decisions based on information on this website, please make sure you consult with your professional investment advisors to make sure such trades are appropriate and likely to be profitable for you. If you have any questions about this blog, or have any comments, please feel free to email me at bobsadviceforstocks@lycos.com .

I came across Digital Theatre Systems (DTSI) this afternoon while scanning the list of
top % gainers on the NASADAQ. DTSI closed today at $18.68, up $2.13, or 12.87% on the day. I do not own any shares of DTSI nor do I own any options.
According to the
Yahoo "Profile" on DTSI, DTSI "...provides entertainment technology, historically focused on digital multi-channel audio technology, products, and services for entertainment markets worldwide."
On August 5, 2004, DTSI
reported 2nd quarter 2004 results. For the quarter ended June 30, 2004, total revenues increased 13% to $13.3 million from $11.7 million in the same quarter in 2003. Net income was $3.1 million, a 126% increase over the $1.4 million in the same quarter the prior year. This worked out to $.17/diluted share compared with $.13/diluted share in the same quarter in 2003.

How about longer-term? Looking at a
"5-Yr Restated" financials from Morningstar.com, we can see that revenue has grown steadily from $22.8 million in 1999 to $55.5 million in the Trailing Twelve Months (TTM).
DTS came public in July, 2003. No earnings are reported on Morningstar.com.
Morningstar reports free cash flow of $3 million in 2001, $4 million in 2002, $8 million in 2003 and $9 million in the TTM.
The balance sheet looks great with $95.6 million in cash and $21.6 million in other current assets with $10.7 million in current liabilities and $0 million in long-term liabilities.
How about "valuation"? Taking a look at
Yahoo "Key Statistics" on DTSI, we can see that this is a small cap stock with a market cap of only $317.54 million. The trailing p/e is a moderate 25.38 and the forward p/e (fye 31-Dec-05) is only 21.47. The PEG is 1.07, and price/sales is 4.93.
Yahoo reports 17.00 million shares outstanding with only 6.50 million of them that float. There are 940,000 shares out short as of 8/9/04, representing 3.357 trading days to cover the short interest. Yahoo reports no cash nor any stock dividend in this issue.
My favorite place to look at charts is on
Stockcharts.com. Of the many charts available to review, I find the "Point & Figure" chart the most reliable in providing guidance in terms of price activity. For DTSI this "point & figure" chart:
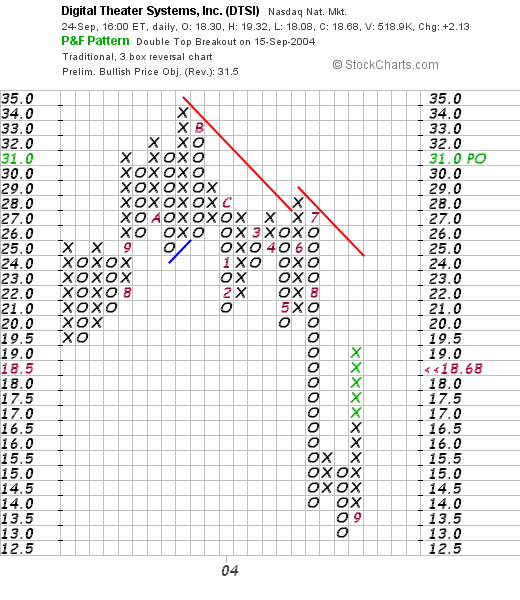
shows that DTSI came public in July, 2003 at around $19.5, rose to the $34.00 level in October, 2004, before failing to maintain a support level and instead falling to a los of $13.5, before moving higher recently.
O.K. what do I think? I think this is quite a small company but they DO have an interesting product. Their growth is steady, valuation is reasonable, the balance sheet is superb, but technicals look mediocre. I would like to see this stock close strongly above the $25 level to break through its recent resistance level.
Thanks so much for stopping by! Please feel free to email me at bobsadviceforstocks@lycs.com if you have any particular questions.
Bob
Thursday, 23 September 2004
September 23, 2004 Carter's (CRI)
Hello Friends! I apologize for not posting as often as I would like, but I shall do my best to keep adding to the HUGE number of stock market ideas on this blog,
Stock Picks Bob's Advice. As always please remember that I am an amateur investor, so please do your own investigation of all stocks discussed on this website, and please consult with your professional investment advisors to make sure all of your decisions have the greatest likelihood of profitability and appropriateness for you!

As many of you may know, the first thing I like to do when looking for a new stock pick is to search through the lists of
top % gainers of the NYSE. On the list today was Carter's (CRI), which closed at $26.30, up $1.19 or 4.74% on the day. Looking at the
Yahoo "profile", we can see that Carter's IS indeed the baby clothing store (it has been YEARS since my kids have been running around in those outfits), and "...markets apparel for babies and young children in the United States."

On July 28, 2004, Carter's
announced 2nd quarter 2004 results. Net sales for the quarter increased 12% to $156.3 million from $140.0 million in the same quarter the prior year. For the second quarter ended July 3, 2004, net income increased 183% to $5.9 million or $.20/diluted share from $2.1 million or $.09/diluted share the prior year. ($.03/share represented a benefit of the "cumulative effect of a correction in the cost of inventory"). The company estimated a 10% year-over-year increase in third quarter 2004 sales to $234 million with earnings rising 19% compared to the prior year at $.57/share. For the full year, CRI estimated sales of $775.0 million (+10%), and earnings $1.56 to $1.58, a 28% to 30% increase from the prior year. Overall this report looked quite postive to me!

How about longer-term? For this I like to turn to the
Morningstar.com "5-Yr Restated" financials. Here we can see that revenue has increased steadily from $406.9 million in 1999 to $703.8 million in 2003. The latest quarterly report has the company doing over $770.0 million in 2004!
Earnings have increased from $.82 in 2002 to $.92 in 2003. Again, estimates for 2004, reported in the latest quarterly earnings release by the company, should be about $1.56 to $1.58, a nice increase the last few years.
Free cash flow has been positive according to Morningstar.com, increasing from $12 million in 2001, to $23 million in 2003. The balance sheet also looks fine, if not perfect, with $36.1 million in cash and $185.7 million in other current assets, with only $71.2 million in current liabilities and $302.4 million in long-term liabilities.

How about "valuation"? Looking at
Yahoo "Key Statistics", we can see that this is a small cap stock with a market capitalization of $738.69 million. The trailing p/e isn't bad at 23.42 (imho), with a forward p/e (fye 3-Jan-06) of only 14.53 thus yielding a reasonable PEG at 1.07. Price/sales is also cheap at 0.96. There are 28.09 million shares outstanding (I do not personally own any shares nor do I have any options), with 26.90 million of these that float. As of 8/9/04, Yahoo reports 588,000 shares out short representing only 2.19% of the float, but due to the low average trading volume, this is still significant at 8.647 trading days.
No cash dividend and no stock dividend is reported on Yahoo.
How about "technicals"? Looking a "point & figure" chart from
Stockcharts.com:
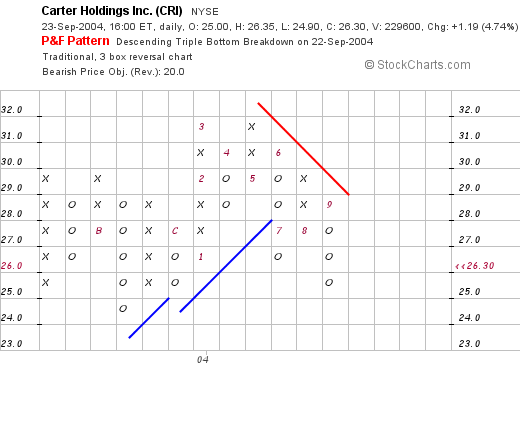
it appears that this stock probably came public in its current 'incarnation' in 2003 at around $25/share. The stock traded higher until June, 2004, when it broke through a resistance level at $28, and actually has been trading UNDER a resistance level since that time. The stock, at $26.30 today, will not have broken through the resistance level at around $29. As a technician, I might want to wait until it got through that level to make sure it wasn't just a temporary improvement in stock price.
So what do I think? Well their clothes are sure cute! LOL. But seriously, the earnings reported is solid, the free cash flow is nice, the balance sheet is healthy, and the valuation is in line. It is just that the technicals, the price chart itself does look a bit weak. And besides, I don't have any money to be buying anything right now!
Thanks so much for stopping by! If you have any comments, questions, or words of encouragement, please feel free to email me at bobsadviceforstocks@lycos.com .
Regards!
Bob
Friday, 17 September 2004
"Looking Back One Year" A review of stock picks from the week of August 25, 2003

Hello Friends. It is already another weekend. I have truly slowed down posting here....but I try to get in a couple of ideas at least each week and I think we have plenty here to work with! As always, please remember that I am an amateur investor, so please consult with your professional investment advisors prior to making any investment decisions based on information on this website. If you have any comments or questions, please feel free to email me at bobsadviceforstocks@lycos.com

On August 25, 2003, I
posted Invivo Corp (SAFE) on
Stock Picks Bob's Advice at $20.39. On January 26, 2004, Intermagnetics (IMGC)
announced they had acquired SAFE at $22/share. We thus had a gain of $1.61/share or 7.9%.

Electronic Clearing House (ECHO) was
posted on Stock Picks at $6.36. ECHO closed on 9/17/04 at $9.20 for a gain of $2.84 or 44.7%.
On August 11, 2004, ECHO
announced 3rd quarter 2004 results. Total revenue increased 14.9% to $12.2 million. Operating income rose almost 100% to $1.1 million, up from $.6 million in the same quarter in 2003. On a diluted earnings per share basis, earnings were up 80% to $.09 from $.05 in the prior year. Things appear to be doing just fine at ECHO.

On August 26, 2003, I
posted Engineered Support Systems (EASI) on Stock Picks at $54.77. EASI split 3:2 in November, 2003, for a resultant effective pick price of $36.52. EASI closed at $47.64 on 9/17/04 for a gain of $11.12 or 30.4%.
On August 31, 2004, EASI
announced 3rd quarter 2004 results. Revenue rose 43% to $221.9 million from $155.7 million last year. Earnings rose 72% to $21.3 million or $.76/share compared with $12.4 million or 4.48/share the prior year. A pretty strong result!

On August 27, 2003, I
posted Netflix (NFLX) on Stock Picks at $32.66.
NFLX split 2:1 on 2/12/04 for a net effective pick price of $16.33. NFLX closed at $16.99 on 9/17/04 for a gain of $.66 or 4%.
On July 15, 2004, NFLX
announced 2nd quarter 2004 results. Revenue was $120.3 million, up 90% from $63.2 million the prior year. GAAP net income was $2.9 million or $.04/share compared to GAAP net income of $3.3 million or $.05/share the prior year. This downdrift in earnings was noted by the street and the stock has dropped accordingly! (There have been other concerns, but bottom line the earnings was a disappointment.)

On August 28, 2003, I
posted Michaels Stores (MIK) on Stock Picks at $43.01. MIK closed at $58.46 on 9/17/04 for a gain of $15.45 or 35.9%.
On August 25, 2004, MIK
announced 2nd quarter 2004 results. Diluted earnings per share came in at $.38, a 9% increase over last year's $.35/share. Sales came in at $682.9 million, up 11% over last year's sales of $616.5 million. Same-store sales were up 5% for the quarter. MIK appears to be doing just fine and just announced an upcoming stock split! Should be bullish for the stock price imho.

Quiksilver (ZQK) was
selected for Stock Picks at $18.42/share on August 28, 2003. ZQK closed at $26.22/share on 9/17/04 for a gain of $7.80 or 42.3%.
On September 9, 2004, Quiksilver
announced 3rd quarter 2004 results. Earnings jumped 64% to $19.5 million from $11.9 million, or $.32/share in 2004, vs $.21/share in the same quarter in 2003. Revenue increased 34% to $337.9 million from $251.5 million last year. These were very strong results and the stock has been moving higher in response to the news!

On August 28, 2003, I
posted Supportsoft (SPRT) on Stock Picks at $8.94. SPRT closed at $9.76 on 9/17/04 for a gain of $.82/share or 9.2%.
On July 20, 2004, SPRT
announced 2nd quarter 2004 results. Revenue for the second quarter was $16.9 million, a 34% increase over last year's $12.6 million, and a 7% sequential increase. Net income was $4.9 million or $.11/diluted share, compared with $2.0 million or $.06/diluted share last year, and $3.9 million or $.09/share the prior quarter. I LOVE sequential and year-over-year increases! Looks nice to me!

Finally, on August 29, 2003, I
posted Wilson Greatbatch (GB) on Stock Picks at $39.24/share. This stock has been our WORST performer of the week closing at $17.02 on 9/17/04 for a loss of $(22.22) or (56.6)%.
On August 5, 2004, GB
announced 2nd quarter 2004 results. Sales totaled $52.9 million, a DECREASE of 5% from the prior year. Net income decreased by 4% to $4.7 million compared to $5.0 million last year. And diluted eps dropped by 4% to $.22 compared with $.23 last year. They further guided lower in the announcement for an overall dismal report. However, the long-term may be brighter, but short-term, not very promising imho.
So how did we do with these 8 stocks? We had seven gainers and one big loser! Overall, the average performance was a gain of 14.7%. Not too shabby! Thanks again for bearing with me in this long review! If you have any questions, comments, or words of encouragement, please feel free to email me at bobsadviceforstocks@lycos.com Have a great weekend everyone!
Bob
Posted by bobsadviceforstocks at 3:40 PM CDT
|
Post Comment |
Permalink
Updated: Friday, 17 September 2004 4:34 PM CDT
September 17, 2004 Syneron Medical Ltd. (ELOS)
Hello Friends! Thanks so much for stopping by my blog,
Stock Picks Bob's Advice. As you all probably know, and as I repeat many times, I am an AMATEUR investor, so please consult with your professional investment advisors to make sure that any investment ideas you come across here are appropriate, timely, and likely to be profitable for you! If you have any comments or questions, please either go ahead and post them right here on the blog, or email me at bobsadviceforstocks@lycos.com . I always like to hear from readers, and would love to hear from new readers and how they use the information I present. I am also interested in those readers from outside the United States and whether information and investing ideas are applicable to their own situation!

Scanning through the list of
"top % gainers on the NASDAQ", I came across Syneron Medical Ltd. (ELOS). I do not own any shares nor do I have any options on this company. ELOS is having a nice day today trading at $15.20, up $1.01 or 7.12% on the day. According to the
Yahoo "Profile", Syneron "...designs, develops and markets aesthetic medical products based on electro-optical synergy (ELOS) technology that uses the synergy between electrical energy and optical energy to provide effective, safe and affordable aesthetic medical treatments."

On August 18, 2004, ELOS
reported 2nd quarter 2004 results. Revenues for the second quarter were $13.7 million, a 70% increase over the $8.1 million recorded the year earlier. Net income for the second quarter was $6.4 million, or $.30/pro forma diluted share compared to $2.8 million in net income the prior year. In addition, the company estimated that full year 2004 revenues should come in at around $55 million.
Taking a look at the
"5-Yr Restated" financials at Morningstar.com, we can see that this company has no revenue in 2000, only $500,000 in revenue in 2001, and jumped to $35 million in revenue by 2003 with $55 million, as noted in the prior paragraph, estimated for 2004.
Morningstar.com does not show any earnings, but from the prior report, we can see that this company is profitable and growing. Free cash flow has been improving from $(1) million in 2001, $2 million in 2002, $14 million in 2003 and $15 million in the TTM.
The balance sheet as presented on Morningstar.com appears solid. There are $21 million in cash and $8.1 million in other current assets, plenty to cover both the $9.1 million in current liabilities and the $3.1 million in long-term liabilities more than two times over.

How about "valuation" questions? Looking at
"Key Statistics" from Yahoo, we can see that this is a small cap stock with a market cap of only $335.93 million. The trailing p/e is quite reasonable at 13.00. No PEG is reported. Yahoo reports 21.94 million shares outstanding with 5.50 million of them that float. Only 61,000 shares are out short as of 8/9/04, representing 1.11% of the float or only .13 trading days.
Yahoo reports no cash dividend and no stock dividend on record.
What about "technicals"? Looking at a Point & Figure chart from
Stockcharts.com:
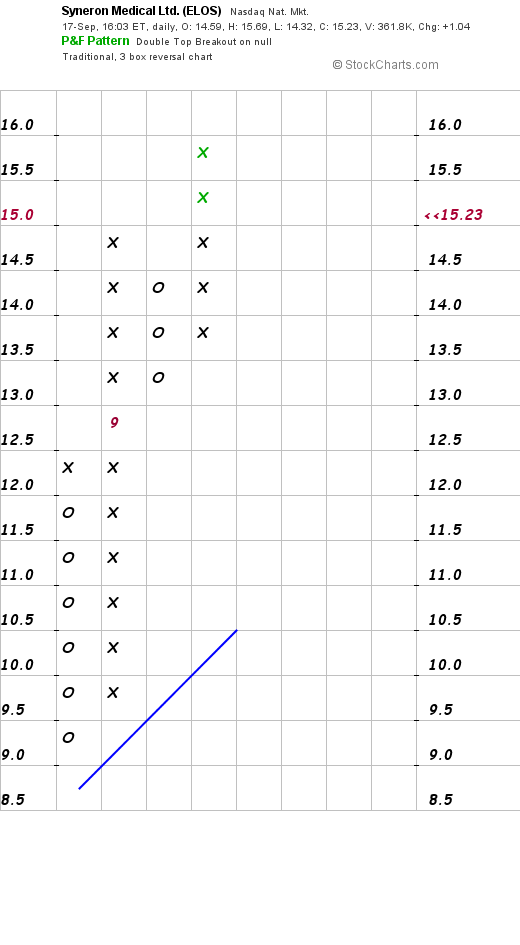
we can see that this stock appears to have been trading at about $12 in August, 2004, dropped to a support level of $9.00 later that month, and has just now been trading higher. Not much of a track record, but what is there looks good.
So what do I think? Well, this is a SMALL company and trades just over $10 making it a bit volatile...so be careful if you are 'weak at heart'. However, the recent earnings report is excellent, the earnings are growing solidly along with the revenue, free cash is improving and looks nice, the balance sheet is good, valuation is nice with a p/e in the low teens. However, no analysts are reporting making a PEG virtually impossible to estimate. And technically, although not a long period of time, the chart looks fine to me.
Unfortunately, I don't have any money to invest as I am waiting upon a sale of a portion of one of my existing holdings to justify adding a new position. If you have any questions or comments, please feel free to email me at bobsadviceforstocks@lycos.com .
Bob
Tuesday, 14 September 2004
September 14, 2004 eResearch (ERES)

Hello Friends! I do not have time for a full post right now but I came across eResearch (ERES) on the top gainers this morning and it appears to fit well into my criteria for a stock pick! ERES is trading at $17.36 as I write, up $.96 or 5.85% in an otherwise sloppy market. According to the
Yahoo "Profile" on ERES, the sompany "...provides technology and services that enable the pharmaceutical, biotechnology and medical device industries to collect, interpret and distribute cardiac safety and clinical data more efficiently." I do not own any shares or options on this company.
On July 21, 2004, ERES
reported 2nd quarter 2004 results. Revenues came in at $28.2 million, a 91% increase over the $14.8 million reported in the 2nd quarter 2003. Net income was $8.1 million, or $.15/diluted share, an increase of 194% compared with net income of $2.8 million or $.05/diluted share the prior year.
In addition, the company predicted positive sequential growth for the upcoming quarter of $30.0 to $30.5 million in revenue with earnings of $.16 to $.17/diluted share. In addition they RAISED guidance for the full year to revenues of $117 to $119 million from previous guidance of $114 to $116 million. This represents at least a 75% increase in revenue over the prior year. In addition they raised guidance on earnings per share to $.62 to $.63 for the full year, increasing from prior guidance of $.59 to $.60/share. This is a great report!

How about longer-term? If we look at a
"5-Yr Restated" financials from Morningstar.com, we can see that although revenue did drop between 1999 and 2001, from $42.8 million to $28.0 million, it has subsequently rebounded strongly to $67 million in 2003, and as noted in the prior paragraph, current estimates have been raised to at least $117 million in 2004.
Earnings during this period also dropped from $.11/share in 1999 to $(.08)/share in 2001, but subsequently rebounded strongly to $.27 in 2003, and again as noted earlier, estimates are for $.62 to $.63/share in 2004.
Free cash flow has been growing steadily with $(2) million in 2001, increasing to $32 million in the Trailing Twelve Months (TTM).
How about the balance sheet? Morningstar reports $62.1 million in cash and $21.7 million in other current assets, enough to cover the Current liabilitis of $27.3 million, almost three times over! In addition, ERES, per Morningstar, has NO long-term liabilities.
And valuation? Looking at
"Key Statistics" from Yahoo.com, we can see that this is a small cap stock with $987.61 million in market capitalization. The trailing p/e is a bit rich at 42.83, but with the fast growth the forward p/e (fye 31-Dec-05) is only 20.72 and the PEG is only 0.79.
Yahoo reports 51.82 million shares outstanding with 43.10 million of them that float. Of these, there were 9.89 milion out short as of 8/9/04, representing 22.95% of the float or 5.211 trading days. I like to use 3 trading days as an arbitrary point of reference, and with that as a guide, there are quite a few shares out there that have been sold short.
Yahoo reports no cash dividend and the company did recently split their stock 3:2 in May, 2004.
How about "technicals"? Looking at a Point & Figure chart from
Stockcharts.com:
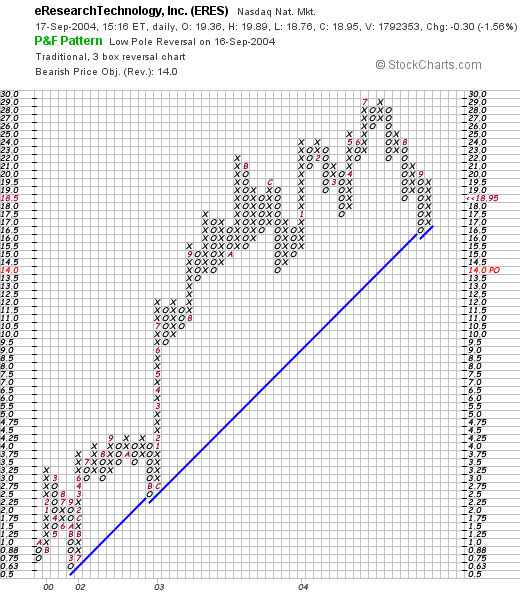
We can see that this stock has been trading very steadily higher since late 2001 from a $.75/share level to its current $20.00 level. The stock did manage to hit $29 in July, 2004, but has pulled back to its support level just recently.
So what do I think of this stock? I think it is a great investment! It recently reported great earnings results, raised guidance, has been steadily growing the last 3-4 years, is spinning off ever-growing amounts of free cash, has an excellent balance sheet, reasonable valuation wit a PEG under 1.0, has some short sellers that will need to cover, and a graph that shows it is not currently overextended imho. Only this is, like so often lately, I don't have any money to be investing. I am still waiting to sell a portion of one of my positions at a gain prior to adding a new position!
Thanks for stopping by! If you have any questions, comments or words of encouragement, please feel free to email me at bobsadviceforstocks@lycos.com. Please remember I am an amateur investor so please consult with your professional investment advisors prior to making any investment decisions as I am not responsible for either your losses or your gains!
Bob
Posted by bobsadviceforstocks at 9:15 AM CDT
|
Post Comment |
Permalink
Updated: Friday, 17 September 2004 2:20 PM CDT
Sunday, 12 September 2004
"Looking Back One Year" A review of stock picks from the week of August 18, 2003

Hello Friends! Thanks so much for stopping by and visiting my blog,
Stock Picks Bob's Advice. Usually, I try to post a review each weekend of what I have written about one year earlier in order to see how the stock picks have performed. Last weekend I was asleep on the job and didn't get to it! O.K. I am only human and I apologize. Did anyone notice? As always, please remember that I am an amateur investor so please do your own investigations before using any information on this website and consult with your professional investment advisors to make sure that any investments discussed are appropriate, timely, and likely to be profitable for you! If you have any comments or questions about this blog, please feel free to email me at bobsadviceforstocks@lycos.com .

On August 18, 2003, I
posted PolyMedica (PLMD) on Stock Picks at a price of $46.05. PLMD split 2:1 on 9/30/03 making our "pick price" actually $23.03. PLMD closed on 9/10/04 at $30.00 for a gain of $6.97 or 30.3%.
On July 27, 2004, PLMD
announced 1st quarter 2005 results. Revenues for the first quarter ended June 30, 2004, came in at $111.1 million, a 12.3% increase compared to the $98.9 million the prior year. Net income was $13.8 million, a 24.1% increase over the $11.1 million the prior year, and diluted earnings/share were $.50 a 13.6% increase compared to the prior year $.44/share. The company also announced they expected net revenues of $114-$118 million and diluted earnings per share of $.50-$.54 for the fiscal 2005 2nd quarter. It looks like PLMD is doing just fine!

Measurement Specialties (MSS) was
posted on Stock Picks on August 18, 2003, at a price of $12.31. MSS closed on 9/10/04 at $22.99 for a gain of $10.68 or 86.8%.
On August 4, 2004, MSS
announced 1st quarter 2005 results. For the first quarter ended June 30, 2004, net sales increased 7.6% to $28.0 million compared to $26.0 million the prior year. However, income from continuing operations came in at $3.3 million or $.23/diluted share compared with $3.7 million, or $.29/diluted share the prior year. My preference is always to note increasing earnings along with revenue growth, so this is not quite as attractive to me as other news. However, the stock price has done well, and apparently the street is still quite bullish on future prospects.
On August 19, 2003, I
picked Dynacq (DYII.PK) at a price of $24.50. This has been a very disappointing selection and the company has been dropped to the "pink sheets" and thus the change in symbol due to apparent accounting questions. DYII.PK closed at $6.35 on 9/10/04, for a loss of $(18.15) or (74.1)%. With all of the accounting problems, it is hard to even sort out the latest quarter results and thus, I will refrain from commenting on that portion of the stock. Clearly, this type of development supports the need for clearly placed loss-limits, which for my trading portfolio, is represented by an 8% loss.

On August 21, 2003, I
posted Lifeway Foods (LWAY) at $14.51. LWAY split 2:1 on 3/9/04 so our effective pick price was $7.26. LWAY closed on 9/10/04 at $10.30 for a gain of $3.04 or 41.9%.
On August 16, 2004, LWAY
reported 2nd quarter 2004 results. Revenue rose 6% to $4.002 million compared to $3.78 million last year. Net income was $432,109, or $.05/share, compared with $691,082 or $.08/share, a decrease of 38% from the prior year. The decrease was attributed to the temporary spike in milk prices during the quarter, but the street didn't like this result anyhow, and the stock price has pulled back subsequent to this news.

On August 22, 2003, I
posted DJ Orthopedics (DJO) on the blog at $10.89. DJO closed on 9/10/04 at $20.97 for a gain of $10.08 or 92.6%.
On July 27, 2004, DJO
announced 2nd quarter 2004 results. Net revenues for the quarter ended June 26, 2004, totaled $63.2 million, a 33.2% increase compared with $47.4 million reported the prior year. Net income for the quarter, excluding redemption of some Notes as reported, was $4.7 million, or $.21/share a 75.6% increase from $2.7 million or $.15/share reported the prior year. DJO continued to stand behind optimistic guidance of $260 million for the full 2004 year. This was a nice report!

Finally, on August 22, 2003, I
posted Electronics Boutique (ELBO) on Stock Picks at $32.30/share. ELBO closed at $33.27 on 9/10/04 for a gain of $1.07 or 3.3%.
On August 19, 2004, ELBO
announced 2nd quarter 2004 results. For the quarter ended July 31, 2004, revenue increased 19.8% to $362.0 million, from $302.1 million the prior year. During the quarter, same-store-sales actually DECLINED 2.2%. Net income increased 132.4% to $3.9 million or $.16/diluted share exceeding previously announced expectations, compared with $1.7 million or $.07/diluted share the prior year.
So what does all of that mean? Well, sales were up apparently by adding outlets since same store sales actually dipped. However, the earnings picture improved dramatically, so the report appears to be a wash. I would resist recommending any retail stock to anyone which had declining same store sales like this stock!
So how have we done this past year? Of these six stocks, five had gains, ranging from 3.3% for ELBO to 92.6% for DJ Orthopedics. Unfortunately, we had a weak performer in Dynacq (DYII.PK) which lost (74.1)% of its value. Even with Dynacq, the average GAIN was 30.1%, an outstanding performance for that particular week a little more than a year later!
Thanks again for stopping by! Please excuse the lack of organization in all of these posts, but by browsing through the dates on the left, you can review all of my past posts. Again, remember I am an amateur investor so get professional advice before making decisions based on what I write, and please feel free to email me at bobsadviceforstocks@lycos.com as I love to hear from readers with their comments and questions! Have a great week everyone!
Bob
Posted by bobsadviceforstocks at 11:19 PM CDT
|
Post Comment |
Permalink
Updated: Monday, 13 September 2004 1:07 PM CDT
Saturday, 11 September 2004
September 11, 2004 Leadis (LDIS)

Hello Friends! It is hard to write anything at all about stocks without first thinking of the thousands that perished at the hands of terror three years ago. I salute all of those who lost their lives in NYC and at the Pentagon and in a field in Pennsylvania. I remember getting to work and having an associate show me the live shot of the World Trade Center first tower burning after being hit. My first thought was that it must have been just another one of those freak small plane accidents. Then the second tower was hit. Then the first came down followed not long after by the second. Those images don't just leave your mind. On a positive note, I open with the Daniel Liebeskind project drawing so that we may all look forward to the future as we memorialize the past.
I was scanning through the
list of top NASDAQ % gainers yesterday and came across Leadis Technology Inc (LDIS). I do NOT have any shares or options in this company. And please remember, I am an amateur investor, so please consult with your professional investment advisors prior to making any investment decisions based on information on this website. LDIS had a very nice day today, closing at $12.68, up $2.73 or 27.44% on the day.

According to the
Yahoo "Profile", LDIS "...designs, develops and markets mixed-signal semiconductors that enable and enhance the features and capabilities of small-panel displays. The Company's core products are color display drivers with integrated controllers, which are critical components of displays used in mobile consumer electronics devices."

Doing a little detective work, the only thing I could see that drove the stock higher yesterday was their participation in an
SG Cowan & Co. Fall Technology Conference yesterday with an associated webcast. This is about an hour long presentation, so you can listen on the net to what the company had to say if you register there. The introductory point is that Leadis sells to hand-set phone manufacturers, the company is only four years old, and has customers including Nokia, Samsung, and LG, which are the 3/5 top manufactures in this market, representing 55% of the hand-set phone market.

On July 28, 2004, LDIS
announced 2nd quarter 2004 results.Revenue came in at $41.3 million, an increase of 19% over the prior quarter revenue of $34.8 million, and an over 200% increase over the prior year same quarter revenue of $13.8 million. Net income per diluted share came in at $.24/share an over 25% increase from the $.19/share reported the prior quarter and an over 300% increase from the prior year $.05 result. In addition, LDIS raised guidance for the 3rd quarter 2004 results to revenue between $40-$43 million from the $21 million the prior year. GAAP diluted eps is expexted to be between $.13 to $.16/share.
This company is only four years old so we don't have 5 year results, however looking at the
"5-Yr Restated" financials from Morningstar.com, we can see how revenue has grown from $1.2 million in 2001, $7.9 million in 2002, and $84 million in 2003. With the current and upcoming quarter at around $40 million, the $160 million revenue target appears reasonable for 2004.
Earnings turned positive in 2003 at $13 million, and from the recently announced earnings report, we can see that net income was $7 million in the second quarter alone, with a target of $28 million for the year if we extrapolated the current result (?).
Free cash flow was $(1) million in 2001, $(4) million in 2002, but turned positive at $13 million in 2003.
According to Morningstar.com, the balance sheet looks just fine with $23 million in cash and $37 million in other current assets, enough to cover both the current liabilities of $33.5 million and the $14.6 million in long-term liabilities combined.
How about valuation? For this I like to look at
Yahoo "Key Statistics". Here we can see that this is a small cap stock with a market cap of only $348.38 million. The trailing p/e is very nice at 13.80 with a forward p/e (fye 31-Dec-05) of 15.85. The PEG is beautiful at 0.76, and the Price/Sales isn't too bad at 1.97.
Yahoo reports 27.48 million shares outstanding with only 6.00 million that float. There are 269,000 shares out short as of 8/9/04, representing 4.48% of the float or 2.745 average trading days, so in my view, this doesn't look too bad either. There are no cash dividends, and no stock splits reported on Yahoo.
How about "technicals"? Looking at
Stockcharts.com for a
Point & Figure chart on LDIS:
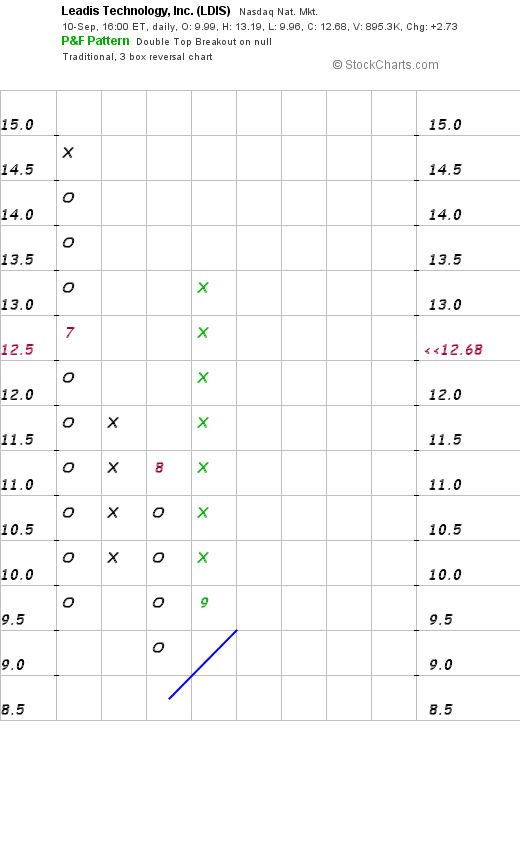
we can see a limited graph, with the stock coming public in June, 2004, dropping from $14.5 to $9.5 and then moving up from this new support level. This is a small company with limited technicals to follow.
So what do I think? Well this is a fascinating company with explosive growth. I do not know what the barriers to entry are but the company does have great recent earnings results, strong fundamentals, reasonable valuation, and might just be one of those that you can "hit out of the park." Unfortunately, I am not in the market to buy anything, but if I were, I might be looking at this. I am always worried about buying low-priced stocks though; if it pulls back just a point, you will hit your 8% stop on a $12 stock. But then again, we sure have seen some stocks really power ahead when they have news and fundamentals like this!
Thanks again for stopping by! If you have any questions, comments, or words of encouragement, please feel free to email me at bobsadviceforstocks@lycos.com
Bob
Posted by bobsadviceforstocks at 9:13 AM CDT
|
Post Comment |
Permalink
Updated: Saturday, 11 September 2004 10:54 AM CDT
Wednesday, 8 September 2004
September 8, 2004 Sierra Wireless (SWIR)
Hello Friends! As always, I am delighted that you could take the time to visit my blog. I am quite the amateur. The place is a mess :) so make yourself at home, you can sit on the sofa, or the Lazy Boy...and browse through the collection of posts that I have here on my blog,
Stock Picks Bob's Advice. Just make sure you are aware that I am an amateur investor so please consult with your professional investment advisors prior to making any investment decisions based on information on this website. Also, if you have any questions or comments, please feel free to email me at bobsadviceforstocks@lycos.com.

As a review, and for those of you who are not familiar with my methods (or is it madness?), the first place I like to "prospect" for stock market ideas is in the lists of greatest percentage gainers for the day. You might ask "Why that list?" and I don't have a better answer than "If I am going to pick a stock TODAY to tell you about, why not pick a stock that is moving UP strongly today?" I am sure there are many other methods of looking at stocks, but that is just something I have been doing!
Anyhow, today on the
list of top % gainers on the NASDAQ, I came across Sierra Wireless, Inc. (SWIR), a stock that I do NOT own any shares nor do I own any options. SWIR closed today at $19.15, up $3.18 or 19.91% on the day!

What drove the stock higher today was an
announcement was a collaboration with Intel (INTC) that would "...deliver integrated wireless connectivity solutions to mobile professionals worldwide." In more 'techno-speak', they were collaborating to develop and promote "...integration in wireless local area networking (WLAN) and wireless wide area networking (WWAN) to provide a better user experience." Not being one who knows a WAN from a LAN, I will defer to more sophisticated observers, but the market thought this was indeed good news and rewarded the stock price accordingly.
Well the second thing I like to check when looking at a new stock pick is the latest quarterly report. In this way, I try to find out whether the latest earnings news demonstrates that the company is doing well...what do I look for?...I like to look at revenue, earnings, and any comments regarding future guidance. Hopefully all of these will be positive.
On July 21, 2004, SWIR
announced 2nd quarter 2004 results. For the quarter ended June 30, 2004, revenue came in at $51.6 million, a 24% increase over the first quarter of 2004 (sequential growth), and a 149% increase over the $20.7 million in revenue in the same period of 2003. This in itself is a terrific report! Net earnings for the quarter came in at $6.0 million or $.23/diluted share, compared to $3.3 million or $.13/diluted share the PRIOR quarter (sequential growth), and compared to $.05/diluted share in the second quarter of 2003. In addition, they provided strong guidance of $57 million for the upcoming quarter or $.24/diluted share, again predicting continued sequential growth in both earnings and revenue for the upcoming quarter. I like this report a lot.

How about longer-term? If we take a look at
"5-Yr Restated" financials from Morningstar.com, we can see that revenue has grown sequentially from $24.6 million in 1999 to $101.7 million in the trailing twelve months (TTM). Earnings which were positive at $.23/share in 1999, dropped sequentially to a low of $(2.57)/share in 2002, only to increase to a profit of $.12/share in 2003. With current earnings and projected earnings of around $.25/share each quarter, the company is working on around $1.00/share for 2004.
According to Morningstar.com, free cash flow has also been steadily improving recently with $(32) million in 2001, improving to $(7) million in 2002, and turning positive at $12 million in 2003. The balance sheet is also quite nice with $85.1 million in CASH, more than enough to cover BOTH the $30.1 million in current liabilities and the very small $2.3 million in long-term debt. In addition, Morningstar reports SWIR with an additional $25.3 million in other current assets. Looks pretty good to me!
The next think I like to review are some valuation parameters. For this, I like to check the
Yahoo "Key Statistics" on SWIR. Here we can see that the market cap is a small cap $481.78 million. The trailing p/e is rich at 51.48, but the forward p/e is dramatically lower (fye 31-Dec-05) at 18.24. Thus, the PEG isn't bad, but not really 'cheap' at 1.53. Yahoo reports 25.16 million shares outstanding with 15.10 million of them that float. There are 1.85 million shares out short, representing 12.24% of the float as of 8/9/04, but even this level is only 1.183 trading days of short shares...so imho, using 3 days as a 'cut-off' this doesn't look like "squeeze" material to me. No cash dividends are reported and no stock splits are mentioned on Yahoo.
What about technicals? I am NOT much of a technician at all (!!!) so always take this portion of my examination with a grain or two of salt....but here goes.....looking at a point and figure chart for SWIR, from
Stockcharts.com, a GREAT place to look at graphs:
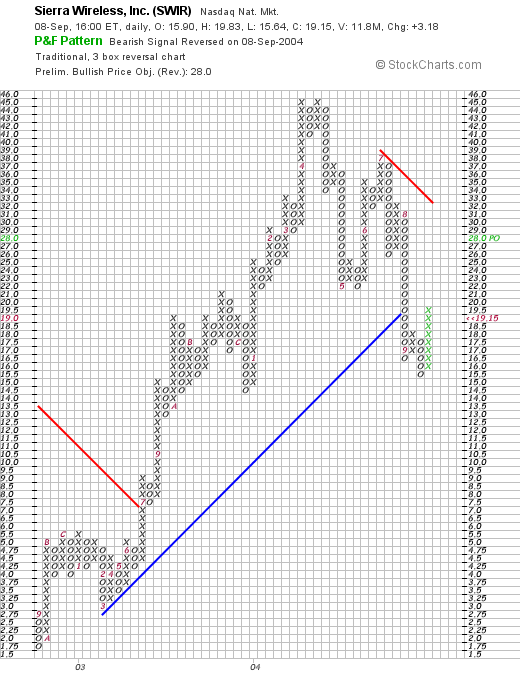
we can see that this stock was trading steadily higher from September, 2002, when it was as low as $1.75/share, until late August, 2004, when it broke down below a support line at about $19.50. (It had peaked around $45/share in April, 2004.) Currently, it is moving back ABOVE the support line, and this looks bullish to me. I would like to see the stock hold the current level and move higher to the $23 level to confirm its momentum. (Again, I am NOT a technician, but have provided you with a chart to review as well!)
So what do I think? Well, the world is certainly going wireless, and this stock is VERY interesting. Especially the recent collaboration with Intel, which with its "Centrino" chip and built-in wireless devices, is looking to grow into this segment. The latest earnings looks GREAT. The past five years has seen explosive growth. The free cash flow is turning nicely positive and the balance sheet is superb. Valuation might be a bit nicer, but then you can't always have EVERYTHING :). (It is ok to try though). And the graph looks ok to me. The stock has pulled back from its recent highs and looks to be moving higher once again.
Now if I just had some MONEY to invest lol. As you know, I just sold my shares of RAD and am waiting patiently (can you believe I am still SITTING on my hands) until I can sell a few shares of one of my current positions at a targeted gain level. So I can't buy anything anyway....but this kind of stock would be on my purchase list if I WERE in the market!
Thanks again for stopping by! If you have any questions, comments, or words of encouragement, I would love to hear from you at bobsadviceforstocks@lycos.com
Bob
Tuesday, 7 September 2004
September 7, 2004 Aviall (AVL)
Hello Friends! Thanks so much for stopping by! I hope that you find lots of things that get you thinking but please always remember I am an amateur investor, so please consult with your investment advisors prior to making any investment decisions based on information on this website to make sure they are timely and appropriate for you! If you have any questions, comments, or words of encouragement, please feel free to email me at bobsadviceforstocks@lycos.com .

I was looking through the
list of top NYSE % gainers today and came across Aviall (AVL). I do not own any shares nor do I have any options in this stock. AVL closed today at $21.30, up $.88 or 4.31% on the day. According to the
Yahoo "Profile", AVL "...is engaged in the distribution and supply of new aviation parts, supply-chain management and other related value-added services, primarily to the aerospace aftermarket and the provision of online inventory information services ot aerospace, defense and marine industries."

On July 14, 2004, AVL
reported 2nd quarter 2004 results and raised earnings guidance for fiscal 2004. Net sales for the quarter ended June 30, 2004, came in at $314.0 million, a 25% increase over the $250.8 million for the same quarter last year. Operating income was $20.5 million, up $3.9 million or 24% from last year. AVL earned $.40/diluted share compared with a loss of $(1.35)/diluted share in the 2nd quarter of 2003. Excluding some non-recurring expenses in that quarter the pro forma diluted results in 2003 were $.24/share.
For a longer-term perspective, I like to check the Morningstar.com
"5-Yr Restated" financials on AVL. In this view we can see that revenue has grown steadily since 1999, with accelerated growth since 2001. $372 million in sales in 1999 with $1.05 billion in sales in the trailing twelve months (TTM).
Earnings have been erratic with $.53/share in 1999, dropping to a loss in 2003 and the TTM. The latest quarter and the improved guidance suggests the company is turning around and is now profitable once again.
Free cash flow has improved from a negative $(93) million in 2001, to $42 million in the TTM.

The balance sheet, as reported by Morningstar.com, shows $11.4 million in cash and $493.9 million in other current assets, balanced against $158.6 million in current liabilities and $208.4 million in long-term liabilities.
What about "valuation"? If we take a look at
"Key Statistics" from Yahoo, we can see that this is a small cap stock with a market cap of $691.7 million. The trailing p/e is reasonable at 17.30 with a forward p/e (fye 31-Dec-05) of 16.17. The PEG is thus nice at 1.19. (anything close to 1.0 with the PEG is reasonable to me.)
Yahoo reports 32.40 million shares outstanding with 30.60 million shares that float. Of these there were 525,000 shares out short as of 8/9/04, representing 2.692 trading days or 1.72% of the float. This does not seem to be a lot of shares out short.
No cash dividend and no stock dividends are reported on Yahoo.
What about "Technicals"? Looking at a
Point & Figure chart from Stockcharts.com:
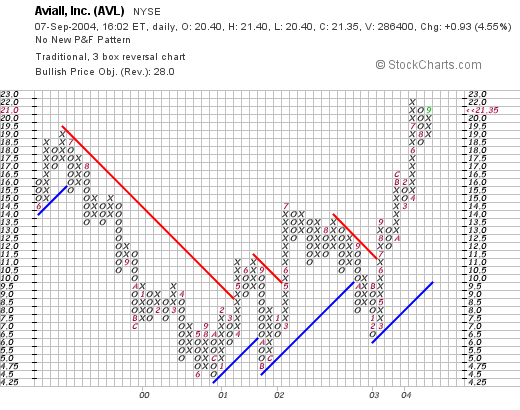
we can see that the stock was trading LOWER from June, 1999, when it was trading at around $19.50/share and then corrected all the way down to $4.50 in October, 2000. It has traded higher since and recently is trading well above its suport level as the stock price trades higher.
Overall I like this stock. The recent earnings report was solid, although the prior 12 months have not been very profitable for this company. The free cash flow is improving, the balance sheet is solid, and the valuation isn't bad. Technically the stock is breaking out to higher ground. As always, I am sitting on my hands until such time as one of my holdings in my "Trading account" is sold, and then I can add a new postion!
Thanks again for stopping by! If you have any questions, please feel free to email me at bobsadviceforstocks@lycos.com
Bob
Newer | Latest | Older
 Hello Friends! I cannot think of a more timely post...maybe a few years late? We are focussed on the stock market on this , but sometimes, quite frankly, I have "blog-envy". I kind of wish I could dabble into the political issues facing America today. But that would be enough for a whole different blog, so I will try to stay on topic and get down to some stock picks! As always, please remember that I am an amateur investor, so please remember to consult with your professional investment advisors. If you have any comments, questions, or words of encouragement (discouragement?), please feel free to email me at bobsadviceforstocks@lycos.com .
 As is my usual habit, I start my search for the "great stock pick" by looking through the lists of top % gainers. Emphasizing stocks over $10, I came across Perot Systems (PER) which is currently trading at $16.14, up $.61 on the day or 3.93%. I do not own any shares of PER nor do I own any options.
 On September 24, 2004, PER announced management changes That included Ross Perot's giving up the title of President and CEO; a position to be assumed by Peter Altabef, the current Vice President of the Company. According to the Yahoo "Profile", PER "...is a worldwide provider of information technology (IT) services and business solutions to a range of customers.
  How about "valuation"? For this I like to check Yahoo "Key Statistics" where some interesting data is found. First, this is a mid-cap stock with a market cap of $1.85 billion. (Per Ameritrade definitions, Small-cap is less than $500 million, Mid-cap between $500 million and $3 billion, and Large-cap over $3 billion.) The trailing p/e is 26.18, and a forward (fye 31-Dec-05) p/e is at 18.94. The PEG isn't bad at 1.40. Price/sales is even more reasonable at 1.10.


 I came across Digital Theatre Systems (DTSI) this afternoon while scanning the list of
  According to the
  How about longer-term? Looking at a
  Yahoo reports 17.00 million shares outstanding with only 6.50 million of them that float. There are 940,000 shares out short as of 8/9/04, representing 3.357 trading days to cover the short interest. Yahoo reports no cash nor any stock dividend in this issue.
 As many of you may know, the first thing I like to do when looking for a new stock pick is to search through the lists of
  On July 28, 2004, Carter's
  How about longer-term? For this I like to turn to the
  How about "valuation"? Looking at

 On August 25, 2003, I
  Electronic Clearing House (ECHO) was
  On August 26, 2003, I
  On August 27, 2003, I
  On August 28, 2003, I
  Quiksilver (ZQK) was
  On August 28, 2003, I
  Finally, on August 29, 2003, I
  Scanning through the list of
  On August 18, 2004, ELOS
  How about "valuation" questions? Looking at
 Hello Friends! I do not have time for a full post right now but I came across eResearch (ERES) on the top gainers this morning and it appears to fit well into my criteria for a stock pick! ERES is trading at $17.36 as I write, up $.96 or 5.85% in an otherwise sloppy market. According to the
  How about longer-term? If we look at a
 On August 18, 2003, I
  Measurement Specialties (MSS) was
  On August 21, 2003, I
  On August 22, 2003, I
  Finally, on August 22, 2003, I
  Hello Friends! It is hard to write anything at all about stocks without first thinking of the thousands that perished at the hands of terror three years ago. I salute all of those who lost their lives in NYC and at the Pentagon and in a field in Pennsylvania. I remember getting to work and having an associate show me the live shot of the World Trade Center first tower burning after being hit. My first thought was that it must have been just another one of those freak small plane accidents. Then the second tower was hit. Then the first came down followed not long after by the second. Those images don't just leave your mind. On a positive note, I open with the Daniel Liebeskind project drawing so that we may all look forward to the future as we memorialize the past.
 According to the
  Doing a little detective work, the only thing I could see that drove the stock higher yesterday was their participation in an
  On July 28, 2004, LDIS
 As a review, and for those of you who are not familiar with my methods (or is it madness?), the first place I like to "prospect" for stock market ideas is in the lists of greatest percentage gainers for the day. You might ask "Why that list?" and I don't have a better answer than "If I am going to pick a stock TODAY to tell you about, why not pick a stock that is moving UP strongly today?" I am sure there are many other methods of looking at stocks, but that is just something I have been doing!
  What drove the stock higher today was an
  On July 21, 2004, SWIR
  How about longer-term? If we take a look at
 I was looking through the
  On July 14, 2004, AVL
  The balance sheet, as reported by Morningstar.com, shows $11.4 million in cash and $493.9 million in other current assets, balanced against $158.6 million in current liabilities and $208.4 million in long-term liabilities.