Stock Picks Bob's Advice
Thursday, 30 December 2004
December 30, 2004 Dialysis Corporation of America (DCAI)
Hello Friends! Thanks for stopping by and visiting my blog,
Stock Picks Bob's Advice. As always, please remember that I am an amateur investor, so please consult with your professional investment advisors prior to using any information on this website. I cannot be responsible for any of your losses that you may experience using any such information, nor shall I attempt to take credit for any of your gains. If you have any questions or comments, please feel free to email me at bobsadviceforstocks@lycos.com . By the way, I hope all of you have a very happy, healthy, safe, and profitable 2005!

Since so many of you who stop by here are new to what I do, I will try to review some of the techniques to find what I would call "stocks of interest". For me personally, it is from these stocks that I have been forming my portfolio. Again, what you do with these stocks should be first to discuss them with your own advisors to determine if they are appropriate, timely, and likely to be profitable for you!
It has been my experience that stocks that are making strong moves on any particular day may be among those stocks that may turn out to be good investments. Thus, I like to scan the
NASDAQ list of top % gainers. In this case, I found Dialysis Corporation of America (DCAI) on the NASDAQ list. Due to my own constraints of selling at 8% losses to prevent losses from growing too large, I have found that stocks under $10 are far too volatile for me and I prefer to avoid these issues. DCAI made the list today with a strong gain of $1.75 (or 10.02%) to close at $19.21. I do NOT own any shares of DCAI as I write this issue. (Since my last portfolio transaction was a sale of a portion of COH at a gain, I am "eligible" to add a position and certainly will be looking at DCAI in the future.)
My first "screening" step after finding a stock is to look at the latest quarter. I am not very "picky" but do insist that the latest quarter show both revenue growth and earnings growth. For this information, I generally turn to Yahoo finance which is a nice place for researching recent quarterly results.
On November 15, 2004, DCAI
reported 3rd quarter 2004 results. First on the question of revenue, for the quarter ended September 30, 2004, revenue came in at $11.0 million compared with $7.6 million the prior year. Second, earnings: net income came in at $776,000 or $.09/diluted share, compared with $308,000 or $.04/diluted share the prior year. On both counts, DCAI passes my "test".
My next step is to look a little deeper on the quality of this company. What do I mean by that? For me, quality is about consistency of growth. I am looking for those companies, boring as it may sound, that have been consistently growing earnings and revenue over several years. It is my hope, that this earnings and revenue "momentum" as you might call it, will persist.
A good friend of mine introduced me to the Morningstar.com site, and I would encourage you to get familiar, and even consider subscribing if you are so oriented. I have found much of the free material adequate for my basic needs. Looking at the
"5-Yr Restated" financials from Morningstar.com on DCAI, we can see a very pretty picture of revenue growth from $5.9 million in 1999 to $37.5 million in the trailing twelve months (TTM).
How about earnings? This has grown almost linearly (except for a dip between 2002 and 2003) from a loss of $(.10)/share to $.22/share in the TTM.
I have also been looking at free cash flow. As noted on the chart, this is the difference between "Operating Cash Flow" and "Capital Spending." Not being an accountant, I am afraid I am not qualified to expound on free cash flow, but in my simple understanding, this amounts to the actual cash being created or consumed by a corporation. (For another view on free cash flow, I would encourage you to read this
discussion on the Motley Fool site)
I prefer to see positive free cash flow, but certainly, "break-even" is preferable to negative cash flow. In DCAI's case, free cash flow, as reported on Morningstar, was $(1) million in 2001, $1 million in 2002, and "0" in 2003 and the TTM. Thus, the company is at this point neither generating nor consuming free cash. (I prefer growth in free cash, but as long as everything else is growing strongly, "0" is acceptable imho.)
How about the balance sheet? (Once again, for a more detailed discussion, I would like to refer you to the
Motley Fool balance sheet basics.) Basically, assets are dollar amounts that you own, and liabilities are dollar amounts that you owe to others. It doesn't take a genius, imho, to realize that you would rather own dollars than owe them to others! In addition, current vs. long-term, as I understand it, are assets or debts that you own or are owed divided by a twelve month period from the current time. For DCAI, from Morningstar, we can see that this company has $1.5 million in cash, and $10.3 million in other current assets. This is balanced against current liabilities of $9.2 million (with the over $11 million in cash and current assets easily covered) and $3.7 million in future liabilities (debts owed that will come due in a greater than 12 month time frame). Overall, the company appears solvent without additional cash needs at this time imho.

Thus far, I have looked at "momentum" both in terms of earnings and revenue growth, and some "fundamental" views of the soundness of the business venture, that is, 'is this company using or generating cash' and 'what is the balance-sheet like?'. This may sound like a lot of work, but if you follow my steps, I think you can see that with a few seconds of review, this information is easily available and readily understood.
My next step is an assessment of "valuation". For this I once again turn to Yahoo, and in particular for DCAI,
"Key Statistics" from Yahoo on DCAI. Here we find that this is really a small cap (under $500 million according to the
Ameritrade definitions with a market "cap" of $163.02 million. (Some people would even refer to this small a company as a "micro cap" stock (See
Investopedia.com) meaning those companies with capitalization between $50 and $300 million).
The trailing p/e is reported as a 'rich' 87.72, there is no PEG, and the Price/Sales is also a bit rich at 3.97. (imho the PEG and Price/Sales are 'bargains' when they hover near 1.0). So this is no great bargain in terms of value, but with a very fast small company, I do not personally rule out stocks on this basis, but it does give me pause.
There are only 8.49 million shares outstanding and only 6.40 million of them float. There are only 4,000 shares out short representing 0.06% of the float or 0.182 trading days, so this is not a factor imho. No cash dividends are paid, and the stock DID recently split 2:1 in February, 2004.
How about "technicals". This is my simple approach of at least looking at a chart! Personally, I believe that stock price performance is a function of the underlying fundamentals, and do not believe that stock charts determine future price performance. However, it is nice to at least look at a chart to either verify or give you pause about the rest of your assessments!
I have grown to like the "Point & Figure" charting techniques. An explanation of these charts is found on
Stockcharts.com, where I found this
"Point & Figure" chart on DCAI:
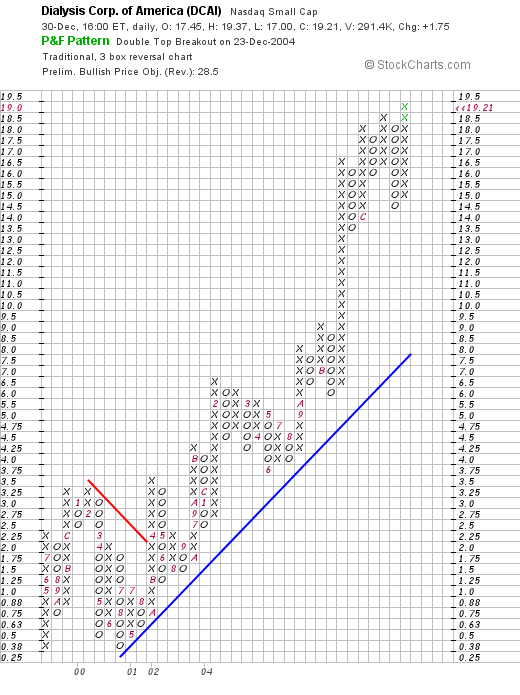
This is my kind of chart with a steadily increasing stock price going back all the way to 2001. It does appear that the stock might be a little ahead of itself, but the strength of the chart, without any sophisticated technical background, for me, is apparent.
 So what do I think? Well, let's review, first of all, the stock made a nice move today, the latest quarter was very strong, the five-year growth in revenue and earnings is impressive, the free cash flow is break-even, but the balance sheet is solid. Valuation is a bit rich, with a p/e above 70, the PEG is unknown probably because there aren't any analysts with estimates. So it is attractive as an investment to me, and since I AM in the investment market....well I will have to sleep on this one!
Meanwhile, I wish you and your friends and family, a Happy, Healthy, Safe, and Profitable 2005. Please note my priorities. Profitable is nice, but the rest is so much more important! Thanks again for stopping by, and if you have any questions or comments on what I have written, please feel free to email me at bobsadviceforstocks@lycos.com or comment right here on the blog!
Bob
Wednesday, 29 December 2004
"Trading Transparency" COH
Hello Friends! My COH hit a sell point and a few moments ago, I sold 22 shares (about 1/4) of my 90 shares remaining at $57.05. These shares were purchased 2/25/03, at a cost basis of $16.66, so my gain was $40.39 or 242.4%. This was my SIXTH partial sale of COH since the purchazse, with sales at approximately 30%, 60%, 90%, 120%, then 180%, and just now 240%.
Thus, I am now "permitted" to add a new position...but I don't see anything much interesting with the market as sloppy as it is. In addition, Starbucks (SBUX) is also approaching a sale point!
Thanks again for stopping by! Please remember that I am an amateur investor, so please consult with your professional investment advisors prior to making any investment decisions based on information on this website. If you have any questions or comments, please feel free to email me at bobsadviceforstocks@lycos.com .
Bob
Friday, 24 December 2004
"Looking Back One Year" A review of stock picks from the week of November 3, 2003

Hello Friends! I wish all of my friends a very Merry Christmas and wishes for a Happy and Healthy New Year! Since we are at the end of the trading week (and because I skipped last week!), I thought I would take a few moments to review the stock picks from my blog,
Stock Picks Bob's Advice from about a year ago.

We have a trailing review, and unfortunately, I am getting a little more than a year out! Currently, I am up to the week of November 3, 2003. Our analysis assumes a buy and hold strategy which is NOT something I do on this website. However, for our purposes here, it gives us a rough idea of how the stocks have performed subsequent to my selection of them for this website.
As ALWAYS, please remember that I am an amateur investor so please consult with your professional investment advisor before making any decisions based on information on this website as selections may or may not be appropriate, timely, or even profitable for you! I cannot be responsible for any of your losses nor will I take credit for any of your gains! If you have any questions or comments, please feel free to drop me a line at bobsadviceforstocks@lycos.com .

On November 5, 2003, I
posted Beazer Homes (BZH) on Stock Picks at $106.34/share. BZH closed at $143.55 on 12/23/04 for a gain of $37.21/share or 35.0%.
On November 5, 2004, BZH
reported 4th quarter 2004 results. Revenue for the quarter ended September 30, 2004, came in at $1.21 billion, up 16.5%. Net income was $80.1 million, up 40.1% from the prior year. And on a diluted EPS basis, came in at $5.82, up 39.2% from the $4.18 the prior year. These were great results!
In fact, BZH recently
announced a 3:1 stock split subject to shareholder approval.

On November 5, 2003, I
picked Watson Pharmaceuticals (WPI) for Stock Picks at a price of $41.01. WPI closed at $32.30 on 12/23/04 for a loss of $(8.71) or (21.2)%.
On October 27, 2004, Watson (WPI)
announced 3rd quarter 2004 results. Total net revenue for the 3rd quarter ended September 30, 2004, increased 14% to $408.0 million from $358.8 million last year. Net income for the quarter was $14.6 million compared to net income of $51.5 million last year. Including charges, eps came in at $.13 vs $.47/share last year. (Without these one time charges, eps would still be only $.45/share, still down slightly from last year.) Certainly, imho, we could have seen better results!

On November 6, 2003, I
selected Rofin-Sinar Technologies (RSTI) for Stock Picks at a price of $28.87. RSTI closed at $41.09 on 12/23/04 for a gain of $12.22 or 42.3%.
On November 10, 2004, RSTI
reported 4th quarter 2004 results. For the quarter ended September 30, 2004, Net sales came in at $93.6 million, up 26% from the prior year's $74.1 million. Net income was $14.1 million, vs. $4.9 million the prior year, up 192%. Great numbers!

On November 6, 2003, I
posted Aceto Corporation (ACET) on Stock Picks at $17.42/share. ACET split 3:2 on 1/5/04 for an effective pick price of $11.62. ACET closed at $19.19 on 12/23/04 for a gain of $7.57 or 65.1%.
On November 9, 2004, ACET
announced 1st quarter 2005 results. Net sales increased 12% to $80.8 million. Net income grew 8% to $3.4 million or $.21/diluted share. Last year net income was $3.1 million or $.20/diluted share. On December 3, 2004, ACET
announced a 3:2 stock split and a 30% increase in the dividend. These are the kind of announcements showing confidence in a company that the street likes, and the stock price has responded accordingly!

Finally, on Friday, November 7, 2003, I
posted LeapFrog Enterprises (LF) on Stock Picks at $35.71/share. LeapFrog closed at $13.10 on 12/23/04 for a loss of $(22.61) or (63.3)%.
On October 27, 2004, LeapFrog (LF)
reported 3rd quarter 2004 results. Net sales increased 13% to $231.1 million from $203.9 million the prior year same quarter. Net income, however, came in at $20.2 million or $.33/share, down from $33.4 million, or $.55/diluted share the prior year. However, the company fortunately maintained 2004 guidance.

So how did we do that week in November, 2003, a little over a year ago? I had two stocks losing money and three stocks gaining with an average gain of 11.58%. Not fabulous, but then again, not too bad either! Remember, in real life, I advocate selling losers quickly and selling gainers piecemeal slowly.
Thanks again for stopping by! I hope that all of your Holidays are always Merry! Above all have a healthy and safe 2005! If you have any questions, or just want to wish ME a Holiday Greeting (is that a hint or what?), feel free to email me at bobsadviceforstocks@lycos.com .
Bob
Posted by bobsadviceforstocks at 3:10 PM CST
|
Post Comment |
Permalink
Updated: Friday, 24 December 2004 8:09 PM CST
Thursday, 23 December 2004
December 23, 2004 Napco Security Systems (NSSC)
Hello Friends! Thanks so much for stopping by my blog,
Stock Picks Bob's Advice. As always, please remember that I am an amateur investor so PLEASE consult with your professional investment advisors to make sure that all investments discussed are appropriate, timely, and likely to be profitable for you. I cannot be responsible for any of your losses nor take credit for any of your gains! If you have any questions, or comments, please feel free to email me at bobsadviceforstocks@lycos.com.

Today, while scanning the
list of top % gainers on the NASDAQ, I came across Napco Security Systems (NSSC) which, as I write, is trading at $13.141, up $1.482 or 12.71% on the day. I do NOT own any shares nor have any options or other positions related to this stock. According to the
Yahoo "Profile", NSSC is "...engaged in the development, manufacture, distribution and sale of security alarm products and door security devices for commercial and residential installations."
On November 9, 2004, NAPCO
reported 1st quarter 2005 results. Net sales increased 37% to $13.4 million from $9.8 million last year. The net income for the quarter was $513,000 or $.06/share compared to a net loss of $(282,000) or $(.04)/share last year. These were nice results.
If we look longer term at a
"5-Yr Restated" Financials on Morningstar.com, we can see several nice points: steady revenue growth (recently accelerating) from $54 million in 2000 to $62 million in the trailing twelve months.
Earnings per share have been a bit more erratic, dropping from $.24/share in 2000 down to $.12/share in 2003 but increasing steadily from then.
Free cash flow, however, has been positive and steady, increasing slightly from $6 million in 2002 to $7 million in the trailing twelve months (TTM).
Looking at the balance sheet, we can see $1.5 million in cash and $35.2 million in other current assets, plenty to cover BOTH the $8.4 million in current liabilities AND the $8.6 million in long-term liabilities combined.
How about valuation? Looking at
"Key Statistics" from Yahoo on NSSC we can see that this is a TINY company, really a microcap stock with a market cap of only $112.38 million. The trailing p/e is 27.40, no forward p/e is available (probably no analysts follow to give us these estimates), and thus no PEG. The price/sales isn't bad at 1.61, and that p/e sounds reasonable with the quick recent growth.
Yahoo reports 8.51 million shares outstanding and of these only 5.80 million float. Currently (11/8/04) there are 938,000 shares out short representing 12.676 trading days or 16.17% of the float. This imho might represent a possible "squeeze" of the shorts in the making....if the stock rises, they will need to scramble to buy shares to cover their short positions.
Yahoo shows no cash dividends. A 20% stock dividend was issued on 11/18/04.
How about technicals? If we look at a Point & Figure chart from
Stockcharts.com:
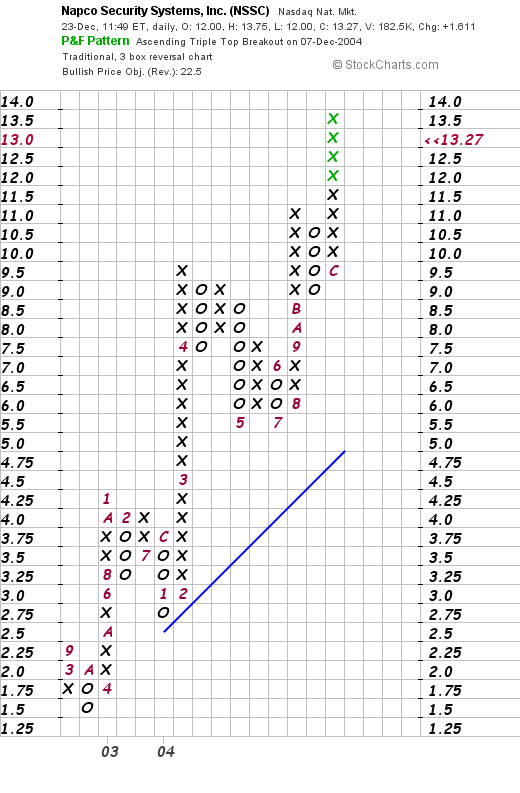
We can see a very strong chart rising from $1.50 in late 2003 to the current level of around $14.00. the stock looks nice imho.
So what do I think? I really like this stock a lot. Only thing is it is quite small, has a price near $10.00, and might be quite volatile. Now, if I had any cash, or my portfolio gave me a buy signal, I might just be buying a few shares! Thanks again for stopping by! Have a wonderful Holiday Season and a very healthy, happy, and profitable 2005!
Bob
Tuesday, 21 December 2004
"Trading Transparency" AMMD and PARL
Hello Friends! I have been patiently (almost) waiting on my American Medical Systems stock (AMMD) which has been closing on my second sale point. A few moments ago I unloaded 35 shares of my 150 shares of AMMD at a price of $41.15. These shares were purchased on 1/9/04 at a cost of $25.82, so I had a gain of $15.33 or 59.4% (my goal was 60% so i did jump the gun a teency bit...is THAT a word?). My first sale of 50 shares out of the original 200 was executed on 6/24/04 at a price of $32.08, for a gain of $6.26 or 24.2%...so I jumped the gun a bit on that too! And after selling a portion today, well that gave me the "permission slip" to add a new position!
Scanning the lists of top % gainers today I came across Parlux Fragrances (PARL). I first
posted Parlux (PARL) on Stock Picks On October 7, 2004, when it was trading at $14.95. Today I purchased 300 shares of PARL at $22.20. PARL is trading strongly today, currently as I write at $22.181, up $1.551 or 7.52% on the day!
The rest as they say is history! Thanks so much for stopping by. Please remember that I am an amateur so please consult with your investment advisors before acting on any information on this website! If you have any questions or comments, please feel free to email me at bobsadviceforstocks@lycos.com .
Bob
Monday, 20 December 2004
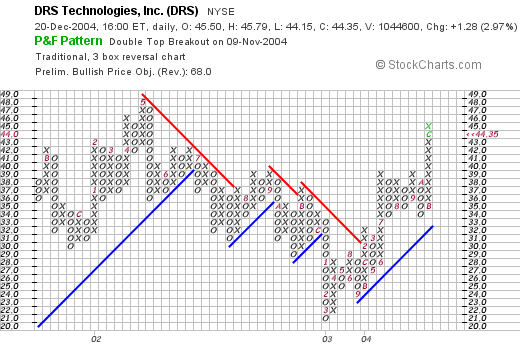
Revisiting DRS Technologies (DRS)
Hello Friends! As I noted earlier, I sold some of my Cantel at the 60% sell point, enabling me to add a position. I picked up 200 shares of DRS Technologies (DRS) and wanted to revisit this stock. I
first posted DRS Tech (DRS) on
Stock Picks Bob's Advice on August 6, 2003, when it was trading at $27.98/share. DRS closed today at $44.35, up $1.28 or 2.97% on the day.

According to the
Yahoo "Profile", DRS "...is a supplier of defense electronic products and systems."
On November 5, 2004, DRS
announced 2nd quarter results. Revenue for the quarter was $328 million, up 59% from $206.2 million a year ago. The latest acquisition of Integrated Defense Technologies helped boost results. Quarterly income rose to $14.4 million or $.52/share, beating estimates of $.45/share, and up from $9.4 million or $.41/share last year.

Looking longer-term, the
Morningstar.com "5-Yr Restated" financials show that revenue has increased from $.4 billion in 2000 to $1.3 billion in the trailing twelve months (TTM).
Earnings during this period have also steadily increased from $.76/share to $2.02/share in the TTM. There has been some dilution in shares with 13 million in 2002, increasing to 27 million in the TTM.
Free cash flow has been positive and increasing from $14 million in 2002 to $99 million in the TTM.
The balance sheet looks fine, although long-term debt is a bit heavy, with $71.9 million in cash and $413.6 million in other current assets balanced against $352.1 million in current liabilities and $588.8 million in long-term liabilities.
How about "valuation"? Looking at
"Key Statistics" on Yahoo, we can see that this is a mid-cap stock with a market cap of $1.21 billion. The trailing p/e is reasonable at 22.23 and the forward p/e is nice at 18.56. The PEG is a bit high (?) at 1.28. And price/sales is a reasonable 0.93.
Yahoo reports 27.21 million shares outstanding with 26.60 million of them that float. Currently there are 1.42 million shares out short (11/8/04) representing 5.36% of the float or 4.814 trading days of volume. No stock dividend or stock split is reported on Yahoo.
How about "technicals"? Taking a look at a
"Point & Figure" chart from Stockcharts.com, we can see that the stock which increased in price between August and December of 2001, peaked at around $48/share in May, 2002, then declined to a low of $21/share in March, 2003. The stock has been climbing since that time and appears to be on an upward trajectory without being over-extended. In other words the chart looks nice.
So what do I think about DRS? Well, I liked it enough to buy some shares today! Actually, it was a name that I was familiar with and seeing it on the list of top % gainers, well it was a no-brainer, imho, to buy some shares. The latest quarterly report is quite strong, the growth as reported on Morningstar is great. The free cash flow is positive and growing, the balance sheet looks fine, the valuations are reasonable. And if you haven't noticed it, the US is in an armed struggle and defense expenditures appear to be going nowhere but up!
Thanks so much for stopping by! If you have any questions, comments, or words of encouragement, please feel free to email me at bobsadviceforstocks@lycos.com .
 Above all, I wish all of my readers the Merriest of Christmasses, the Happiest of New Years, and my personal wishes for good health, the most important gift of all!
Bob
"Trading Transparency" DRS Technologies (DRS)
Well that nickel didn't stay in my pocket very long! Looking through the lists of top % gainers, I came across DRS Technologies, a defense contractor that I have owned in the past.
I purchased 200 shares of DRS at $44.69 in my trading account. DRS is currently trading at $44.67/share as I write, up 3.71% on the day. I will try to update the DRS story later!
Regards!
Bob
"Trading Transparency" Cantel (CMN)
Hello Friends! This is a quick post to let you know that I hit a sale point on Cantel (CMN) on the upside. A few moments ago, I sold 55 shares, representing approximately 1/4 of my 225 shares of Cantel as it hit a 60% gain. The 55 shares were sold at $33.75. I have a cost basis of $20.04, and thus had a gain of $13.71 or 68.4%. These shares were acquired on 6/4/04, and thus I have owned them just over six months.
I sold my first shares (of my 300 shares originally purchased); 75 shares were sold 7/8/04 at a price of $25.20, for a gain of $5.16 or 25.7% (a little shy of the 30% gain!). Cantel recently announced a 3:2 stock split, but I am not sure what is driving the stock higher today as it is up $2.64 or 8.47% on the day enabling me to sell a portion of my holdings.
My favorite part of this is that I can now look around to purchase a new position! I don't have to sit on my hands at the moment...and I shall let you know if I find anything suitable to buy for my account!
Bob
P.S. Sorry about not getting that "Weekend Review" out...will address that soon hopefully!
Sunday, 19 December 2004
December 19, 2004 C R Bard (BCR)
Hello Friends! Thanks so much for stopping by my blog,
Stock Picks Bob's Advice. As always, please remember that I am an amateur investor, not a certified investment advisor, so please consult with your professional investment advisors prior to making any decisions based on information on this website. As alway, remember that I cannot be responsible for your losses nor do I want to take credit for any of your gains. If you have any questions or comments, please feel free to email me at bobsadviceforstocks@lycos.com or leave them right here on the blog!
Earlier this week I intended to post C R Bard (BCR) here on Stock Picks, and quite frankly I never got around to it! It had a nice day with a big jump in price on Thursday, when it made the list of top % gainers and got my attention:
 Now in retrospect, interestingly, the stock not only made a nice move higher, it has held onto that gain showing how strong that price move really was!
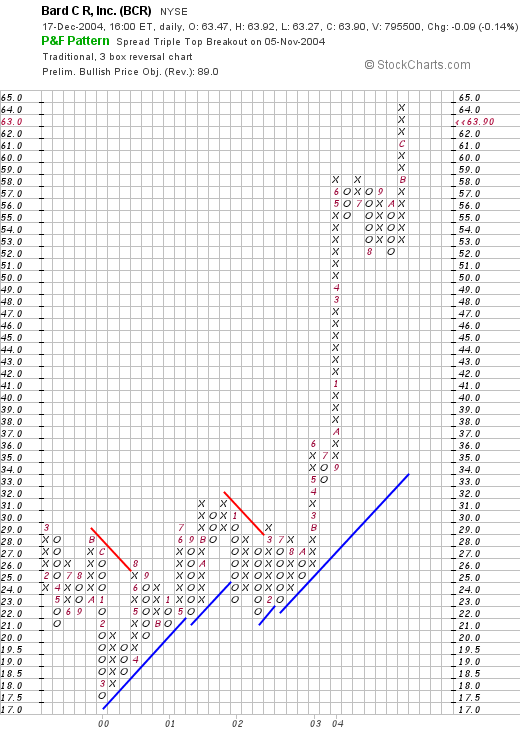
BCR closed on Friday, December 17, 2004, at $63.90, down $(.09) or (.14)% on the day. According to the Yahoo "Profile", C.R.Bard "...is engaged in the design, manufacture, packaging, distribution and sale of medical surgical, diagnostic and patient care devices." I do not own any shares nor do I have any options or leveraged positions in this stock.
What drove the stock higher Thursday was a report released on Wednesday 12/15/04, after the close, that the company saw 2005 earnings growth of at least 14%. In addition, the company predicted revenue growth of 10 to 11% adjusted for currency exchange rates. The company also suggested that the next quarter's results of $.61, in line with consensus, was reaffirmed except that if it missed the target it "will be because profits exceeded the estimate." This comment is a way of raising guidance, almost always bullish for a stock price!
 How about the latest quarter's results? On October 19, 2004, BCR reported 3rd quarter 2004 results. Net sales came in at $421.9 million for the quarter ended September 30, 2004, up 17% over the prior year's net sales of $361.8 million. (Adjusting for currency exchange rates, this still came in for a 15% increase in net sales!). Net income was $102.4 million and diluted earnings came in at $.95, up 99% and 94% respectively over the prior year. Excluding one time items, net income and diluted eps still came in at a gain of 33% and 31% respectively compared to the same quarter in 2003. These were very strong results!
How about 'longer-term'? Taking a look at the Morningstar.com "5-Yr Restated" financials, we can see the steady revenue growth from $1.04 billion in 1999 to $1.61 billion in the trailing twelve months (TTM).
Earnings during this period have been steadily, if not perfectly, growing from $1.14/share in 1999 to $2.37/share in the trailing twelve months. Dividends (!) have also been steadily increasing with small increases each and every year since 1999 when the dividend was $.39/share, to the TTM when it was reported on Morningstar at $.47/share.
Free cash flow, while not increasing, has been strong at $230 million in 2001, holding at $205 million in the TTM. The balance sheet is also quite solid with $485.2 million in cash and $485.4 million in other current assets, plenty to cover both the current liabilities of $375.8 million AND pay off all of the long-term liabilities of $258.5 million and still have current assets left over!
 What about 'valuation' questions? Looking at "Key Statistics" on Yahoo, we can see that this is a large cap stock (over $3 billion market cap) with a market cap of $6.69 billion. The trailing p/e is moderate at 26.97 with a forward p/e (fye 31-Dec-05) of 22.82. The PEG also suggests a slight premium for this stock at 1.76. It doesn't look like we are the first to discover this company!
Yahoo reports 104.65 million shares outstanding with 101.7 million that float. Currently, as of 11/8/04, there are 1.41 million shares out short, which although sounding like a large number, actually only represents 1.38% of the float or 2.023 trading days to cover. So it isn't a big deal imho.
As I noted earlier, the company currently has a dividend of $.48/share yielding 0.75%. The company also recently (6/1/04) split their stock 2:1.
How about 'technicals'? If we take a look at a Point & Figure Chart on C.R.Bard, we can see the very strong price performance on this company. Trading sideways between March, 1999, and August, 2003, at around the $30.00 range, the stock has exploded to the upside to the $64 range. If anything, the stock may be a bit over-valued and the price ahead of itself...but I usually do not try to outsmart the graph. Thus, the stock chart, at least at this time, looks very strong!
So what do I think? Well the latest earnings report was very strong. They raised guidance, the past five years have been solid with steady free cash flow generated and the balance sheet is excellent. The valuation is a bit steep and the stock chart might be a bit over-extended. Otherwise I love this stock. Unfortunately, I don't have any available cash to buy any shares....and am waiting, in any case, for a buy signal with my own portfolio.
Until then, I shall sit on my hands and not buy anything! Thanks again for stopping by and visiting! If you have any questions, comments, or words of encouragement, please feel free to email me at bobsadviceforstocks@lycos.com .
Bob
A reader writes, "What about Rogers Corp.?"
Hello Friends! I always enjoy receiving comments and questions from readers. Yesterday I received a nice note from pdhanks, Thank You for the kind words pd. I also received a question from Chingow, who asked me about Rogers Corp (ROG). Let me try to tackle that question. Even though pd is kind, I am indeed an amateur investor so please consult with your professional investment advisors before acting on anything I write! By the way, I do not own any stock in Rogers (ROG)...but wish to share with you anything I can find that either makes this stock an investment consistent with my goals or perhaps a fine investment that just doesn't fit into my investment goals.

First of all, Rogers (ROG) closed at $45.28 on December 17, 2004, down $(.37) or (.81)% for the day. According to the
Yahoo "Profile" on Rogers, Rogers "...manufactures and sells specialty polymer composite materials and components that it develops for markets and applications around the world." O.K. sounds ok so far!

The first place I like to look when thinking about a stock is the latest quarter results. That way, I can try to get a feeling for how a company is doing right "now". On October 20, 2004, Rogers
announced 3rd quarter 2004 results. They reported that quarterly income rose to $6.5 million or $.38/share, up from $6.3 million, but down from $.39/share last year. So THAT was a mixed report; revenue jumped slightly, but earnings edged lower. However, net sales jumped 53% to $86.7 million from $56.5 million last year. THAT is the kind of result I do like. Apparently $10.4 million in additional revenue was do to an acquisition of "Durel".
HOWEVER, as part of that earnings report, Rogers LOWERED expectations, predicting profit of $.40 to $.45/share on sales of $82-$87 million. Analysts had been expecting $.54/share on revenue of $91.7 million. I always PREFER companies that RAISE expectations above analysts views instead of lowering them. Raising expectations is sort of like raising the thermostat on a cold winter day (boy can I ever relate to THAT here in Wisconsin!), first you raise the thermostat and later the whole house warms up! If you lower that "thermostat" by lowering expectations, I am afraid there is a good chance, at least short-term, to see a decline in the stock price.

How about longer-term? My next step is usually to navigate over to the Morningstar.com site. For Rogers, looking at the
Morningstar.com "5-Yr Restated" financials, I start with the easily understood bar graphs at the top of the page where the revenue results are displayed. I prefer to see continually increasing revenue bars. For Rogers, revenue actually declined from $247.8 million in 1999 down to $216.0 million in 2001. It has been improving recently, and Morningstar shows $363.5 million in the trailing twelve months (or TTM as Morningstar calls it!) With the last several years showing improvement, that isn't bad, but imho, I prefer steady growth all five years.
Earnings also have been a bit erratic dipping to $.98/share in 2001 from $1.19 in 1999, but since then they have been growing very strongly to $2.32 in the TTM. So this doesn't look too bad either.
Free cash flow? Well that is sort of the actual money either being generated or consumed by the operation in question. For ROG, according to Morningstar, Free Cash Flow has been positive, with $21 million in 2001, dropping to $5 million in the TTM. Again, this looks nice, but to look 'fabulous' I like to see positive and increasing free cash flow.
How about their 'balance sheet'? At least on Morningstar.com, this looks fine. They are showing $29 million in cash and $118 million in other current assets. That is plenty to cover both the $55.3 million in current liabilities and $30.6 million in long-term debt.

So what do I check next? My next step is to try to figure out 'valuation' questions, at least on a basic level. For this, I again turn to Yahoo, looking at the
"Key Statistics" on Rogers. Here we can see that ROG is a mid-cap stock (see market capitalization definition
here), with a market cap of $758.8 million. The trailing p/e is nice at 19.49 (anything under 20 with a reasonable growth rate is "nice" to me!), and the forward p/e (based on earnings estimates instead of actual recorded earnings) is 17.02 (fye 28-Dec-05). Also showing reasonable valuation is the PEG which is reported at 1.02. Anything near 1.0 is a good PEG imho.
Yahoo reports 16.76 million shares outstanding with 14.20 million of them that float. Currently there are 544,000 shares out short (as of 11/8/04) representing only 3.83% of the float or 6.044 trading days of volume. I arbitrarily use 3.0 trading days, and anything higher than that is a bullish indicator, imho, suggesting a more significant level of shares out short that eventually need to be 'covered' by being purchased.
ROG does not pay a dividend and the last stock split was in May, 200, when the company split 2:1.
How about 'technicals'? For this I turn to
the Point & Figure Chart on Stockcharts.com. I have started to fairly exclusively rely on these "Point & Figure" style of charts which show buying pressure and upward price movement with columns of 'x's' and columns of 'o's' for descending prices. This graph looks like this:
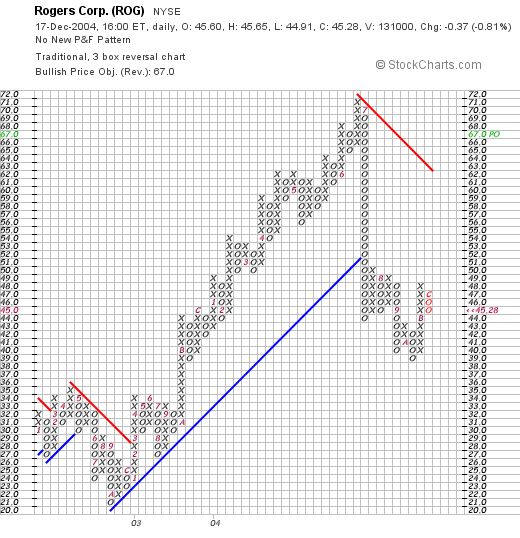
Here we can see what appears to be a very strong chart from October, 2002, when the stock was trading around $21 to a peak at about $71 in July, 2004. However, the stock really looks like it broke down after that and I am not convinced it has found an area of support where it appears to be moving higher. The chart looks discouraging to me.
So what do I think? Well, the latest quarter result leaves some things to be desired. Revenue DID jump strongly but earnings faltered and the company lowered expectations for the upcoming quarter. The Morningstar.com report looked nice, at least for the last several years, and valuation was reasonable. However, the chart leaves a bit to be desired imho.
This stock might turn out to be a fabulous investment. My thoughts are that it just doesn't fit into my criteria. That does not mean the stock might not rise from here and turn out to be a fabulous purchase. It just is that it doesn't fit into my target parameters. I hope you understand what I am saying! Also, I AM an amateur investor, so please consult with your professional investment advisors before making any decision one way or another. If you have any questions, you can post them on my blog, Stock Picks Bob's Advice, on my Xanga blog, or email me at bobsadviceforstocks@lycos.com .
Thanks so much for visiting, for participating in my blog, and for all of the kind words! Have a wonderful Sunday and a very happy Holiday Season!
Bob
Newer | Latest | Older


