Stock Picks Bob's Advice
Friday, 4 February 2005
"Trading Transparency" HIBB
Hello Friends! I just wanted to keep you up-to-date with my current trading in my real
"Trading Portfolio". A few moments ago I sold 42 shares of my Hibbett (HIBB) at $27.89/share. I have a cost basis of $9.74/share on this one, which I purchased on 3/6/03. This works out to a gain of $18.15 or 186%...which is my 5th sell point(!). (For anybody new to my blog,
Stock Picks Bob's Advice, my sell points on the upside are at 30%, 60%, 90%, 120%, then 180%, 240%, 300%, and 360%. After that, I plan on going to 120% intervals...if I ever get there!).
Prior sales of HIBB included 50 shares 5/30/03, 50 shares 9/4/03, 40 shares 10/15/03, and 20 shares 4/5/04. Each at our prior sell points.
Anyhow, that means, I can buy another position, and that nickel is burning a hole in my pocket already!
Thanks so much for stopping by. Please remember that I am an amateur investor so please consult with your professional investment advisors prior to acting on any information on this website. If you have any questions or comments, please feel free to leave them right here on the blog, or email me at bobsadviceforstocks@lycos.com .
Bob
Thursday, 3 February 2005
Nominated for the 2005 Business Blogging Awards

I am pleased to announce that
Stock Picks Bob's Advice has been nominated for Best Business/Investing blog for 2005. So folks, if you like what I write, head on over to the
2005 Business Blogging Awards Site and vote!
Sorry about that shameless self-promotion :).
Bob
February 3, 2005 Mercury Interactive (MERQ)

Hello Friends! Thanks so much for stopping by and visiting my blog,
Stock Picks Bob's Advice. As always, please remember that I am an amateur investor, so please consult with your professional investment advisors prior to making any investment decisions based on information on this website.

Looking through the
list of top % gainers on the NASDAQ today, I came across Mercury Interactive (MERQ) which was trading sharply higher. As I write, MERQ is trading at $47.89, up $3.69 or 8.35% on this otherwise bearish day. I do not own any shares nor do I have any options on this stock.

According to the
Yahoo "Profile" on MERQ, Mercury Interactive "...is a provider of software and services for the business technology optimization (BTO) marketplace."
What drove the stock higher today, was the
4th quarter 2004 earnings report, which was released yesterday (2/2/05) after the close. For the quarter ended December 31, 2005, revenue came in at $204.3 million, a 34% increase over the $152.0 million reported in the same quarter in 2003. Net income for the fourth quarter was $35.0 million or $.36/diluted share compared to $13.1 million or $.13/diluted share last year. In addition, the company raised guidance for 2005.
As
reported:
"The skeptic might argue that the forward guidance almost looks too good to be true, and may be difficult to achieve, but Mercury benefits from more revenue coming from the balance sheet than most, and is coming off an exceptionally strong fourth quarter," said JP Morgan Adam Holt in a research note.
How about "longer-term"? For that, I like to turn to the
Morningstar.com "5-Yr Restated" financials on MERQ. Here we can see a steady revenue increase from $188 million in 1999 to $633 million in the trailing twelve months (TTM).
Earnings have been more erratic, but have been increasing recently, and increased from $.39/share in 1999 to $.66 in the trailing twelve months.
Free cash flow has also been positive and growing. They reported $61 million in free cash flow in 2001, $124 million in 2002, $163 million in 2003 and $183 million in the trailing twelve months.
How about their balance sheet? Looking at Morningstar, we can see that the company does have some significant long-term debt, but the cash level is at $476 million, other current assets are at $222.3 million, which is more than enough to cover the current liabilities of $445.2 million, and make a dent in the long-term liabilities of $896.7 million.
How about "valuation"? Looking at
MERQ "Key Statistics" on Yahoo, we can see that this is a large cap stock with a market cap of $4.06 billion. The trailing p/e is rich at 54.87, the forward p/e (fye 31-Dec-06) is slightly better at 35.61, the PEG (5-yr) is 1.95, with a price/sales at 5.89. Certainly, this isn't a cheap stock but the performance is still impressive.
Yahoo reports 84.42 million shares outstanding with 77.70 million of them that float. Of these, 6.99 million are out short as of 1/10/05. This represents 8.995 of the float or 3.845 trading days of volume.
No cash dividend is reported, and the last stock split was a 2:1 split on February 14, 2000.
How about "technicals"? Taking a look at a
point & figure chart from Stockcharts.com:
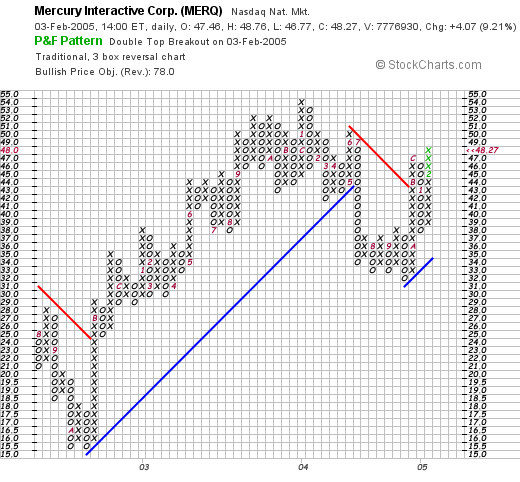
we can see that this stock was moving ahead strongly between August, 2002, when it was trading around $15 to July, 2004, when the stock price broke down as it broke through a support level at around $43. The stock appears to have bottomed at around $31, and is now heading higher, having broken through resistance at around $43 again. Not as strong a chart as some, but not bad overall, imho.
 So what do I think? Well the latest earnings report was solid. They have been growing steadily the past five years. Free cash flow is nice and the balance sheet is respectable. However, valuation is a bit steep, and the chart, looking good short-term, has a little bit more to do to convince me! Anyhow, that is just sour grapes because I spent my money this morning on another stock, MNT, and now must wait for a sale of another portion of my positions to add a new stock!
Thanks again for stopping by! If you have any questions,comments, or words of encouragement, please feel free to post them here or email me at bobsadviceforstocks@lycos.com.
Bob
"Trading Transparency" Mentor (MNT)
Hello Friends! I never let that nickel sit in my pocket very long! Probably should make a new rule about buying a stock only on an up day...but oh well. I looked at the list of top percentage gainers and came across Mentor, a pick that I selected back in August, 2004, that was doing well on the back of a good earnings report and raised guidance. Sounded good to me, so I just purchased 200 shares at $34.33 a few moments ago. Now I shall be sitting on my hands again!
Bob
"Trading Transparency" CMN
Hello Friends! I just wanted to update you on a trade I just executed in my
Current Trading Portfolio. A few moments ago, I sold 55 shares of my 255 shares of Cantel Medical (CMN)at $25.91. This was my third sale and thus, my goal was a 90% gain. These shares were purchased 6/4/04 at a cost basis of $13.36. Thus, my gain worked out to $12.55/share or 94%. On July 8, 2004, I sold 75 shares at $25.20 (prior to the split) which had a cost basis of $20.03 (again pre-split) for a 25.8% gain (fist sell point about 30%), and then on 12/20/04, I sold 55 shares at $33.60 (pre-split), which had a basis of $20.03 (again pre-split) for a gain of $13.57/share or 67.7%. (60% is the second sell-point in my strategy).
Thanks so much for stopping by! And you know what a sale at a gain means?! I have that nickel in my pocket again and I am on the lookout for a new position (as long as I am not at my 25 position goal!)
As always, remember I am an amateur investor so please consult with your professional investment advisors! Have a great Thursday everyone!
Bob
Wednesday, 2 February 2005
February 2, 2005 Pacer Intl (PACR)

Hello Friends! Thanks so much for stopping by and visiting my blog,
Stock Picks Bob's Advice. I know I probably don't need to remind you, but I am an amateur investor, so please consult with your professional investment advisors prior to making any investment decisions based on information on this website.

Looking through the
list of top % gainers on the NASDAQ, I came across Pacer Intl (PACR). I do not own any shares nor do I have any options on this stock! PACR closed at $22.24, up $2.70 or 13.82% on the day. According to the
Yahoo "Profile" on PACR, Pacer "...is a non-asset-based North American logistics provider. The Company provides its logistics services from two segments, wholesale services and retail services."

What drove the stock higher today, was the
4th quarter 2004 earnings report which was released yesterday after the close of trading. For the quarter ended December 31, 2004, total revenue increased 16.3% to $530.8 million from $456.3 million last year. Net income increased to $17.0 million, from $11.4 million the prior year, a 49.1% increase. On a diluted earnings per share basis, this quarter PACR came in at $.44/share, up from $.30/share, a 46.7% increase. These were great results and the stock moved higher accordingly.
How about longer-term results? Taking a look at the
"5-Yr Restated" financials on Morningstar, we can see that revenue has been steadily growing from $194 million in 1999 to the $440 million in the trailing twelve months. Earnings, which are only recorded since 2003, have increased from $.82 to $1.08 in the trailing twelve months.
Free cash flow has also been solidly positive with $7 million reported in 2001, increasing to $47 million in the trailing twelve months (TTM).
The Morningstar balance sheet looks adequate with no cash reported but $234.1 million in other current assets, as opposed to the $180 million in current liabilities and the $171.6 million in long-term debt.

How about "valuation" questions? Taking a look at
Yahoo "Key Statistics", we can see that this is a mid cap stock with a market capitalization of $829 million. The trailing p/e is reasonable (imho) at 18.05, with a forward p/e (fye 26-Dec-05) of 16.23. Thus, the PEG is nice at 1.11, and Price/sales even cheaper at 0.42.
Yahoo reports 37.28 million shares outstanding with 27.60 million of them that float. Of these, as of 1/10/05, there were only 673,000 shares out short representing 2.44% of the float or only 1.834 trading days of volume.
No cash dividend, and no stock dividends are reported on Yahoo.
What about "technicals"? Taking a look at a
Stockcharts.com Point & Figure chart on PACR:
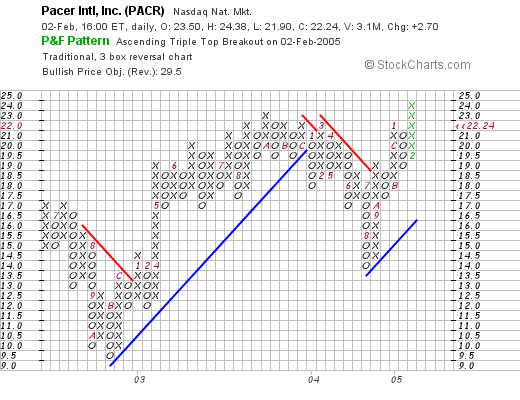
we can see that the stock bottomed late in 2002 at around $9.50, then climbed to $22.50, where it ran into resistance, broke down, and dropped to $13.50 in late August 2004. The stock has been moving higher since then to its current level around $22.24.
So what do I think? Well the stock just came out with a FABULOUS earnings report. The Morningstar five year record looks solid. We don't have much of an 'earnings' record however, although free cash flow looks nice, and the balance sheet is favorable. Valuation questions appear reasonable with a p/e that appears to be significantly lower than the current growth rate. In addition, the chart looks positive if not perfect, to me.
Well I guess in conclusion I like this stock and would consider purchasing some shares if I were in the market to do that! I am waiting on my Cantel which is close to a sell point now....maybe soon?
Thanks again for stopping by! Please remember that I am an amateur investor! If you have any questions or comments, please feel free to email me at bobsadviceforstocks@lycos.com.
Bob
Tuesday, 1 February 2005
"Trading Transparency" SRX
Hello Friends! Well that nickel didn't last long in my pocket! I just picked up 150 shares of SRA Intl (SRX) at $59.60 in my trading account. I will try to post more on them later. Their numbers look good, they just game out with a great earnings report...apparently they are a defense contractor...so not in the high tech area...as such. More later!
Thanks again for visiting!
Bob
"Trading Transparency" QSII
Hello Friends! I just wanted to keep you up to date on my
"Trading Portfolio". A few moments ago, I made my fourth sale of Quality Systems (QSII); I sold 30 shares of my remaining 120 shares at $68.51. I had acquired these shares at a cost basis of $31.00/share on 7/28/03 and thus had a gain of $37.51 or 121%.
As you may recall, my sale points are 1/4 of position at 30%, 60%, 90%, 120%, and then 1/4 at 180%, 240%....etc.
I sold my first 100 shares at $38.86 on 8/19/03, 50 shares at $41.67, and 30 shares at $58.61. This stock has been good to me!
And now....I am able to buy another position...so I shall be on the look-out and shall keep you posted! You know how that nickel burns a hole in my pocket!
Bob
Monday, 31 January 2005
Update "EVST"
It is ironic that I posted that terrible comment about Everlast (EVST) and now today, the stock is flying! As I write, EVST is trading at $8.30, up $1.62 on the day or 24.25%!!!
Apparently, EVST
announced3 new licensees and the stock jumped!
I do not change anything I wrote however. Individually, I cannot predict news about a stock. That is NOT what my thinking is about. I am looking for certain stocks that have consistent growth and great fundamentals. I will absolutely miss loads of stocks that turn out to be great investments.
I hope all of you bought shares of EVST anyhow, and made a bundle. It is just not a stock that fits into my strategy. Even today!
Bob
Sunday, 30 January 2005
A Reader Writes "Is EVST a 'buy'?"

A "Xanga" buddy of mine, "stories" has written and asked me about Everlast (EVST). He wrote:
EVST, a buy?
'the contender' boxing reality tv show will air in march. also, a solid name of a brand. Everlast.First of all, as stories knows, I am an amateur investor, so please consult with your professional investment advisors before taking any action based on information on this website. Furthermore, I am not psychic, so I
cannot predict the future price action of any particular stock! But what I can do is sort of run it through my own screens and see how it fits into my perspective on stock market investments! So bear with me...

First things first. EVST closed on 1/28/05 at $6.68, down $.12 on the day or a loss of (1.76)%. According to the
Yahoo "Profile", Everlast (EVST) "...designs, manufactures and sells a diverse collection of consumer products, encompassing apparel and sports products, principally under the Everlast trademark."

As I think that stories knows, my first step in evaluating a stock is to look at the latest quarter and see if revenue and earnings are positive and improving. On November 15, 2004, EVST
reported 3rd quarter results. Revenue was
down at $15.8 million, compared to $17.7 million the prior year. The company had a net
loss of $(.2) million or $(.08)/basic share, compared with a net
income of $.1 million, or $.03/basic share in the same quarter in 2003. This is not my kind of stock....but that doesn't mean the price might not appreciate in the future...but let's look further!

(sorry but the punching bag doesn't enlarge when you click on it!). How about longer-term results? For this, I turn to the
"5-Yr Restated" financials on Morningstar. Here we can see actually a steadily increasing revenue from $24.5 million in 1999 to $65.6 million in 2002. Revenue has been down slightly since then and has not been growing in the way I like to see it grow.
And earnings? Well, this has been erratic to say the least, with $.31/share in 1999 increasing to $.44, and then dropping since the to a loss of $(.36)/share in the trailing twelve months per Morningstar. Not very encouraging imho.
And free cash flow? At least EVST is not burning up its cash, but they are at ZERO for free cash flow in the trailing twelve months.
And balance sheet? This looks adequate with $.5 million in cash and $23.7 million in other current assets, as opposed to $18.1 million in current liabilities and $32.8 million in long-term liabilities. At least they don't look insolvent imho.

(again, that boxing ring doesn't enlarge lol). What about "valuation"? Here I like to use the
Yahoo "Key Statistics" on EVST. We can see that this is a tiny company with a market cap of only $20.91 million. No trailing p/e and nobody has estimates for a forward p/e. Price/sales is very cheap at .33.
Yahoo reports only 3.13 million shares outstanding with 1.70 million of them that float. Of these, as of 1/10/05, there were 15,000 shares out short representing a short ratio of only 0.044...so that doesn't look significant. No cash dividend nor any stock splits are reported on Yahoo. BTW, I do not own any shares nor do I have any options or short positions in this stock!
How about "technicals"? If we look at a
EVST Point & Figure chart from Stockcharts.com:
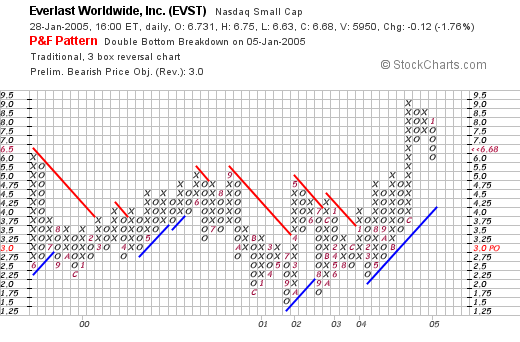
we can see that this stock has been trading in a fairly narrow range between $6.00 and $2.25 between 1999 and early 2004. Recently, it has broken through resistance and does appear to be moving higher. Overall, the chart does look nice! (at least recently.)
So what do I think? Well, it doesn't fit my strategy, plain and simple. The last quarter showed decreasing revenue and a loss, the last twelve months is a loss, the revenue hasn't increased for a couple of years. Free cash flow is zip, and the balance sheet is marginally o.k.
Valuation I guess is reasonable. And the chart does at least recently look good. So those are the good things about the stock. Will the stock price go higher? It might. And if you buy some shares you might make some money. You could make a ton of money. But as for me, I shall be looking for stocks that fit my own criteria a little tighter.
Thanks so much for posting that question! You have been a loyal reader and follower stories, so I apologize if I didn't "pull any punches" on EVST!
Have a great week!
Bob
Newer | Latest | Older


