Stock Picks Bob's Advice
Tuesday, 15 February 2005
February 15, 2005 ANSYS (ANSS)

Hello Friends! Thanks again for stopping by and visiting my blog,
Stock Picks Bob's Advice. As always please remember that I am an amateur investor, so please consult with your professional investment advisors prior to making any investment decisions based on information on this website!

Looking through the
list of top % gainers on the NASDAQ today, I came across ANSYS (ANSS), which closed at $37.03, up $2.63 or 7.65% on the day. I do not own any shares nor do I have any options on ANSS.
What drove the stock higher today was an excellent
4th quarter 2004 earnings results. For the quarter ended December 31, 2004, total revenue came in at $38.9 million, up from $33.3 million the prior year. Diluted earnings per share came in at $.36 (or $.33 if adjusted for a one time tax benefit), compared with $.22/diluted share last year during the fourth quarter of 2003.
How about longer-term? Looking at a
"5-Yr Restated" financials on Morningstar.com, we can see a nice 'ramp-up' of revenue from $63.1 million in 1999 to $128.9 million in the trailing twelve months (TTM). Earnings during this period have also fairly consistently grown from $.44/share in 1999 to $.90/share in the TTM.
Free cash flow has been solid and improving recently. This was $21 million in 2001, and has grown to $45 million in the TTM.
Balance-sheet-wise, ANSS looks good with $124.3 million in cash alone, adequate to cover the $54.2 million in current liabilities. There are NO long-term liabilities according to Morningstar.com. In addition, ANSS is reported to have an additional $33.6 million in other current assets.
How about valuation? Looking at
"Key Statistics" on ANSS from Yahoo, we can see that this company is a mid-cap market cap of $1.15 billion. The trailing p/e is a bit rich at 41.10, the forward p/e is 32.77 and the PEG (5 yr expected) is also a bit rich at 2.25. The price/sales is 8.27.
Yahoo reports 30.97 million shares outstanding with 29.40 million of them that float. Of these 744,000 are out short as of 1/10/05. This represents 2.53% of the float or a mnodest 3.477 trading days of volume.
No cash dividend are reported. The stock did split recently 2:1 on 10/5/04.
How about technicals?
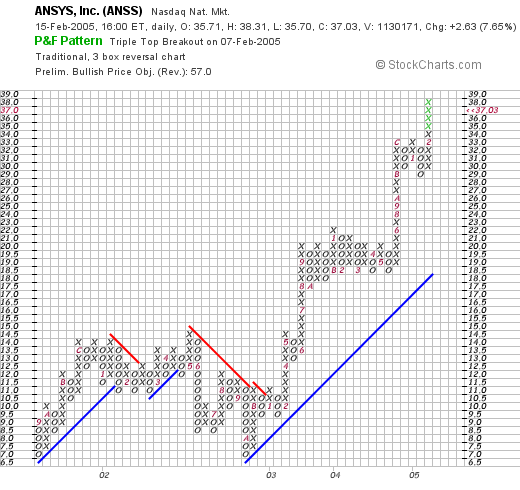
Taking a look at a Point & Figure Chart from Stockcharts.com, we can see a fairly pretty and steady advance in stock price. The stock did pull back after January, 2002, when it dropped from $14.00 to a low of $7.00 in October, 2002. However, since that October, 2002, date, the stock has been rising steadily and strongly to its current level of $37.03.
So what do I think? Everything appears to be in line, the recent earnings, the 5 year record, the free cash flow, and the balance sheet. The chart also looks very nice. I think the valuation is a little bit of concern to me....but will withhold judgement on that question for now. It has the characteristics that I like to see in a stock: good recent quarterly growth, steady growth in earnings, growing free cash flow, and a good balance sheet. I would prefer a cheaper valuation...but then again you cannot always have everything!
Now, if I only had a signal from my own trading account, and I might be buying a few shares!
Thanks so much again for stopping by! If you have any questions or comments, please feel free to email me at bobsadviceforstocks@lycos.com.
Bob
Saturday, 12 February 2005
"Looking Back One Year" A review of stock picks from the week of December 22, 2003

Hello Friends! Thanks so much for stopping by and visiting my blog,
Stock Picks Bob's Advice. As I always remind you, please remember that I am an amateur investor, so please consult with your professional investment advisors prior to making any decisions based on information on this website.
I use the weekend to post a review of past stock picks on this site. I have been running Stock Picks since May, 2003, and have hundreds of stocks listed. In order to see how "we are doing", I try to look back about a year, and each week move another week ahead...and see if I had purchased each stock and had held on without regard to sales on the downside or upside, how would I have done? Of course, this is not how I personally manage my portfolio, but it can give us a rough idea how my 'system' is working!

On December 23, 2003, I
posted Ventana (VMSI) on Stock Picks at a price of $39.80. VMSI closed at $70.96 on 2/11/05, for a gain of $31.16 or 78.3%.
On February 4, 2005, VMSI
announced 4th quarter results.

For the quarter ended December 31, 2004, sales were $48 million, a 27% increase over the fourth quarter of 2003. Net income for the quarter was $8.6 million or $.48/diluted share compared with a net loss of $(2.0) million or $(.12)/diluted share the prior year. To top off this story, VMSI also announced a 2:1 stock split.

On December 23, 2003, I
posted Computer Sciences (CSC) on Stock Picks at a price of $43.80. On February 11, 2005, CSC closed at $48.51 for a gain of $4.71 or 10.8%.
On February 8, 2005, CSC
reported 3rd quarter results.
Revenue rose 6% to $3.52 billion while earnings were up 23% to $157.5 million, or $.82/share from $128.4 million or $.68/share the prior year.

On December 24, 2003, I
posted Sanderson Farms (SAFM) on Stock Picks at a price of $42.79. SAFM closed at $45.22 on 2/11/05, for a gain of $2.43 or 5.7%.
On December 7, 2004, Sanderson
reported 4th quarter 2004 results. 
For the quarter ended October 31, 2004, net sales came in at $259.2 million, up from $254.7 million the prior year. However, net income was $5.1 million or $.25/diluted share compared with $20.5 million or $1.04/diluted share the prior year.

On December 24, 2003, I
posted Faro Technologies (FARO) on Stock Picks at a price of $23.90. On February 11, 2005, FARO closed at $28.75, for a gain of $4.85 or 20.3% since posting.
On November 4, 2004, FARO
reported 3rd quarter 2004 results.
For the quarter ended October 2, 2004, sales increased 21.9% from $19.2 million to $23.4 million in the quarter. Net income was down slightly to $3.1 million or $.22/diluted share from $3.3 million, or $.26/diluted share in the third quarter of 2003. However, the 2003 quarter included "other income" related to a settlement from arbitration of $1.1 million or $.08/diluted share. Thus, results were actually a little bit better than last year!

The last stock picked that week was Sharper Image (SHRP), which was
picked on Stock Picks on December 26, 2003, at a price of $32.40. SHRP closed at $15.10 on 2/11/05, for a loss of $(17.30) or (53.4)% since posting.
On November 18, 2004, SHRP
reported 3rd quarter 2004 results.
Revenue climbed 20% to $153.6 million from the prior year's $128.1 million. Total store sales were up 15% to $80.1 million, but same store sales actually dropped 1%. However, catalog sales increased 28% to pick up the drop at existing stores. However, the third quarter result was a loss of $(3.3) million or $(.21)/share compared with a prior year's gain of $1.0 million or $.06/diluted share. Recently, on 2/10/04, SHRP
reduced outlook further and the stock has continued to trade lower.
Well, how did we do on these five stocks? Assuming an equal dollar amount invested in each of these five, and a buy and hold strategy, I had an average performance of a gain of 12.34%.
Thanks so much for stopping by! If you have any questions, comments, or words of encouragement, please feel free to email me at bobsadviceforstocks@lycos.com.
Bob
Friday, 11 February 2005
February 11, 2005 Trex (TWP)

Hello Friends! Thanks so much for stopping by and visiting my blog,
Stock Picks Bob's Advice! As I always remind you, hopefully you will be inspired by what I write, but please consult with your professional investment advisors prior to making any investment decisions based on information on this website.

I managed to find a few moments to look through the
list of top % gainers on the NYSE today, and came across Trex (TWP) which is trading at $48.46, up $2.17 or 4.69% on the day. I do not own any shares, nor do I have any options on this stock.
According to the
Yahoo "Profile" on TWP, Trex "...is a manufacturer of non-wood decking alternative products that are marketed under the brand name Trex. Wood-Polymer lumber is a wood/plastic composite that offers an attractive appearance and the workability of wood without wood's on-going maintenance requirements and functional disadvantage."

Looking for the latest quarterly report (apparently TWP will be reporting the 4th quarter on 2/17/05), I found the
3rd quarter 2004 earnings report on the company's
website.
On October 25, 2004, they reported the 3rd quarter results. And for the quarter ended September 30, 2004, net sales came in at $64.4 million, up from $41.2 million (a 56% increase) and Net Income for the quarter was $7.1 million or $.48/diluted share up 37% from $5.1 million or $.35/diluted share for the 2003 third quarter. In addition, the company announced expectations of 20-25% growth in both revenue and earnings in 2005. This was a great report!

How about longer-term? For this, as you probably know if you are a regular reader here, I go to my ever-helpful
"5-Yr Restated" financials on Morningstar.com. Here we can see a beautiful 'ramp-up' of revenue from $117.6 million in 2000, dipping slightly to $116.9 million in 2001, then a nice progression to $245.9 million in the trailing twelve months (TTM).
Earnings, which dipped from $1.36 in 2000 to $.64 in 2001, have been increasing steadily to $1.81 in the trailing twelve months.
Free cash flow has been a bit erratic, but has increased from a negative $(25) million in 2001, to a positive $33 million in the TTM.
The balance sheet also looks strong with $61.9 million in cash reported on Morningstar along with 41.4 million in other current assets. Opposed to this is a $35.4 million in current liabilities and $62 million in long-term liabilities.

How about "valuation"? Looking at
"Key Statistics" on Yahoo, we can see that this is a mid-cap stock with a market cap of $716.70 million. The trailing p/e is nice at 26.76 and the forward p/e (fye 31-Dec-05) is even nicer at 21.32. The 5-yr PEG is under 1.0 at 0.97, and the price/sales ratio isn't too bad at 2.79.
Yahoo reports only 14.81 million shares outstanding with 7.70 million of them that float. Of these, 1.53 million (!) are out short as of 1/10/05, representing 19.92% of the float (!) or 10.653 trading days. The rise in the stock price, if I may so suggest, might just be a bit of a crunch of the short-sellers, rushing to buy some shares to cover their "shorts" prior to the upcoming earnings announcement....now THAT is just a guess!
Yahoo does not report any cash nor any stock dividends.
How about "technicals"? For this I turn to
a Point & Figure chart from Stockcharts.com:
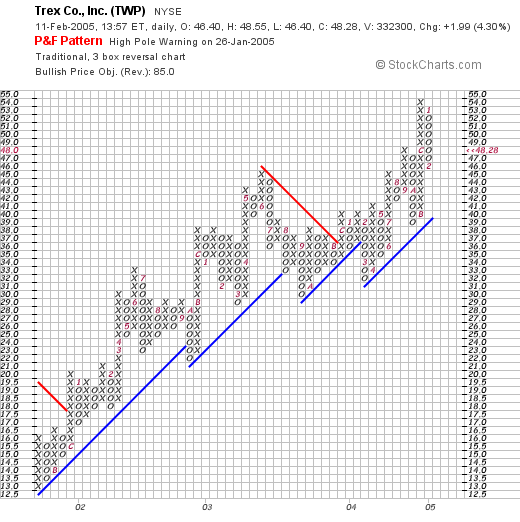
where the stock price makes an almost uninterrupted upward move from $12.50 in October, 2001, to the current $48.28 level. The stock price has really NOT broken down the last four years!
 So what do I think? Well this is definitely a Valentine's Day stock! (Happy Valentine's Day to all of you!). I mean I actually think I am in LOVE....:). Well, if you COULD love a stock this might be it.
Let me review: earnings report is GREAT. LOT's of short-sellers on the stock...they may need to cover. Last five years great growth in earnings and revenue. Free cash flow positive. Balance sheet solid. Valuation reasonable. And the chart looks terrific (imho). So what is there NOT to like....now if I only had a nickel I could use to buy some shares....oh well.
Thanks so much for stopping by! If you have any questions, comments, or words of encouragement, please feel free to email me at bobsadviceforstocks@lycos.com .
Bob
Monday, 7 February 2005
February 7, 2005 Manor Care (HCR)

Hello Friends! Thanks so much for stopping by and visiting my blog,
Stock Picks Bob's Advice. As always, please remember that I am an amateur investor, so please always consult with your professional investment advisors prior to making any investment decisions based on information on this website.

Looking through the
list of top % gainers on the NYSE today, I came across Manor Care Inc. (HCR) which was actually #2 on the list, and is currently trading at $34.90, up $2.48 or 7.65% on the day. I do not own any shares or options of this stock.
According to the
Yahoo "Profile" on HCR, Manor Care "...provides a range of healthcare services, including skilled nursing care, assisted living, subacute medical and rehabilitation care, rehabilitation therapy, hospice care, home healthcare and management services for subacute care and rehabilitation therapy."
Apparently, what drove the stock higher today was a
earnings report from Genesis HealthCare (GHCI), a competing nursing home corporation, that beat their estimates.
As far as HCR's latest earnings, they
reported 4th quarter 2004 results on January 28, 2005. Revenue rose to $806 million, compared with $787 million the prior year. And Net Income jumped 26% to $48 million compared with $38 million last year. On a per share diluted basis, this came out to $.55/diluted share vs. $.42/diluted share a year ago. In addition, the Board increased the quarterly dividend by 7%.

How about longer-term results? Looking at a
"5-Yr Restated" financial statement on Morningstar.com, we can see that revenue has grown steadily from $2.1 billion in 1999 to $3.2 billion in the trailing twelve months (TTM).
Earnings during this period of time have improved from a loss of $(.41)/share to $1.77/share in the TTM. Dividends commenced at $.25/share in 2003 and amounted to $.55/share in the TTM.
Free cash flow has been strong with $194 million in 2001 and $177 million in the TTM.
The balance sheet is adequate. Morningsar reports HCR with $25.8 million in cash and $510.4 million in other current assets. Balanced against this is $418.6 million in current liabilities and $960.2 million in long-term liabilities.
What about "valuation"? For this I turn to
Yahoo "Key Statistics" on HCR. Here we can see that the market cap is a large cap $3.01 billion. The trailing p/e is moderate at 18.32 with a forward p/e (fye 31-Dec-06) of 14.46. The PEG (5-yr estimated) is very reasonable at 1.03, and the Price/Sales is 0.88.
Yahoo reports 86.44 million shares outstanding with 83.70 million of them that float. Of these, as of 1/10/05, there were 1.74 million shares out short...a little heavy on the short shares with a ratio of 4.866.
The company pays $.60/share yielding 1.85%. The last stock split reported on Yahoo was a 3:2 in June, 1996.
How about "technicals"? If we look at a
HCR "Point & Figure" chart from Stockcharts.com:
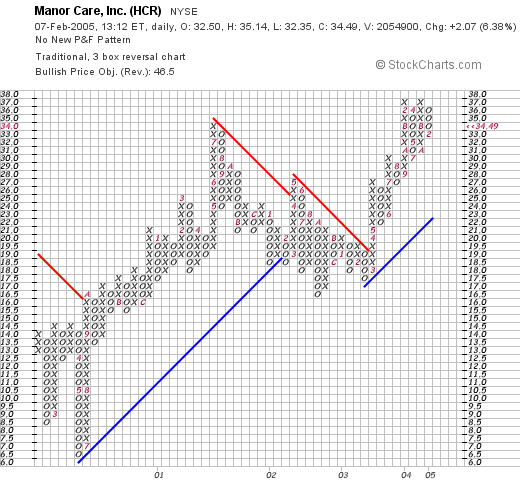
we can see that this stock was trading strongly higher between July, 2000, when it was trading at around $6.50 until February, 2002, when it broke support and appeared to be heading lower from $19/share. The stock bottomed at around $16 in late September, 2002, then headed higher, breaking resistance in February, 2003, at around $19. It has traded higher since then fairly strongly.
So what do I think? The stock is trading nicely today, came in with a very nice earnings report just a week ago, revenue has been steadily improving the past five years, and earnings have also been steadily increasing. Free cash flow is solid, the company pays a dividend, and valuation is nice. On a negative note, the company does have a lot of debt, but the current situation appears well-covered. I am also a bit leary of nursing-home stocks that are in a business that depends greatly on government largess...especially with all of the budget crunch publicity....and budget cuts that these may entail...so I would be cautious in this field imho.
However, the chart looks nice, and if you stick with some strong stops to prevent losses from building up, it might just be a worth investment to consider!
Again, thanks so much for stopping by! If you have any questions, comments, or words of encouragement, please feel to leave them right here on the blog, or email me at bobsadviceforstocks@lycos.com .
Bob
Saturday, 5 February 2005
"Looking Back One Year" A review of stock picks from the week of December 15, 2003
Hello Friends! Thank you for stopping by and visiting my blog,
Stock Picks Bob's Advice. As always, please remember that I am an amateur investor, so please consult with your professional investment advisors prior to making any decisions based on information on this website.
Each weekend, as much as possible, I like to look back about a year just as you can do on the blog, by clicking on the date links along the left side of the posts. I like to review my past picks a week at a time with about a one year trailing time period. Some weeks we look brilliant, and some just are awful!
Please remember that past performance is not a guarantee of future performance. That this review assumes a "buy and hold" strategy which is
not what I suggest here...that is I believe in selling losers quickly on an 8% loss (or other sell points), and gainers slowly. This definitely affects portfolio performance.

On December 16, 2003, I
posted iPass (IPAS) on Stock Picks at $16.47. IPAS closed at $6.41 on 2/4/05 for a loss of $(10.06) or (61.1)%. Certainly not a very exciting performance.
On October 26, 2004, IPAS
announced 3rd quarter 2004 results.
Revenues for the quarter ended September 30, 2004, came in at $41.9 million, compared with $35.0 million for the same quarter the prior year. Net income (GAAP), came in at $5.2 million or $.08/diluted share up from $4.5 million or $.07/diluted share the prior year. (the "thumbs-up" or "down" just are my way of pointing out whether revenue and earnings are both positive or not...)

On December 16, 2003, I
posted Advanced Digital Information (ADIC) on Stock Picks at a price of $13.96. ADIC closed at $11.035 on 2/4/05 for a loss of $(2.925) or (21)%.
On December 9, 2004, ADIC
reported 4th quarter 2004 results.
Net sales dropped 2% to $115.4 million from $118 million in the quarter ended October 31, 2004. Net income was also down at $4.91 million from $5.8 million. On a per share basis this came in at $.07/diluted share down from $.09/diluted share the prior year.

On December 17, 2003, I
posted Digene (DIGE) on Stock Picks at a price of $37.99. DIGE closed at $26.35 on 2/4/05, for a loss of $(11.64) or (30.6)%.
On February 2, 2005,
DIGE announced 2nd quarter 2005 results.
Revenue for the quarter increased 28% to $27 million from $21.1 million the prior year. Net income, however, dropped to $.3 million or $.01/diluted share, down from $.9 million or $.05/diluted share the prior year.

Finally, on December 17, 2003, I
at a price of $17.889. OVRL closed at $14.81 on 2/4/05 for a loss of $(3.08) or (17.2)%.
On 2/3/04, OVRL
reported 2nd quarter 2005 results.
Revenue for the quarter came in at $62.5 million, down from $67.8 million last year. Net income came in at $2.6 million down from $3.5 millin last year, or $.18/diluted share down from $.24/diluted share last year.
Needless to say, THAT was a lousy week on Stock Picks! I don't recall a week where EVERY SINGLE PICK was down a year later! What was the final performance result? I was afraid you would ask....for the four stocks, the average LOSS was a significant (33.73)%. Yikes. Weeks like that really make me feel quite humble. And remind me of the importance of those 8% stops to limit losses on all purchases!
Thanks so much for stopping by! If you have any questions, comments, or especially (after THAT review) words of encouragement, please feel free to leave them right here on the blog or email me at bobsadviceforstocks@lycos.com.
Bob
Friday, 4 February 2005
"Revisiting a Stock Pick" ResMed (RMD)

Hello Friends! Thanks so much for stopping by and visiting my blog,
Stock Picks Bob's Advice. As always, please remember that I am an amateur investor, so please consult with your professional investment advisors prior to making any decisions based on information on this website.
If you have been reading my earlier posts from today, you will see that I had a nice move in HIBB and sold a portion at a gain, and then went ahead and purchased 120 shares of ResMed (RMD). Currently RMD is trading at $59.84, up $6.85 or 12.93% on the day. RMD is an old favorite of mine, although this is the first time that I have purchased shares. I first
mentioned ResMed (RMD) on Stock Picks on December 5, 2003, when RMD was trading at $41.76.
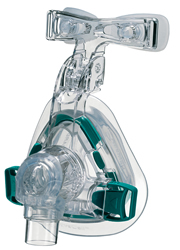
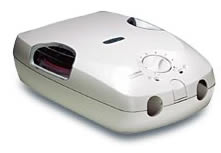
According to the
Yahoo "Profile" on ResMed, RMD "...is a developer, manufacturer and distributor of medical equipment for treating, diagnosing and managing sleep-disordered breathing (SDB)."
What drove the stock higher was an
earnings announcement from RMD. Yesterday (2/3/05), after the close, RMD announced results for the quarter ended December 31, 2004. Revenue for the quarter jumped 26% to $103.9 million from $82.3 million in the same quarter in 2003. Net income came in at $18.3 million, a 27% increase over the prior year. Diluted earnings per share came in at $.49/share, up from $.40 the prior year. These were nice results and the stock moved higher today in response to the news.
How about longer-term? Taking look at a
Morningstar.com "5-Yr Restated" financials, we can see the beautiful ramp-up of revenue from $115.6 million in 2000 to $354.2 million in the trailing twelve months (TTM).
Earnings dipped slightly from $.69 in 2000 to $.35/share in 2001, but have improved steadily since to $1.67 in the TTM.
Free cash flow has been solidly positive, increasing from $7 million in 2002 to $27 million in the TTM.
The balance sheet, as reported by Morningstar, shows $144.4 million in cash and $145.2 million in other current assets. This is more than enough to cover both the $64.3 million in current liabilities and the $122.5 million in long-term liabilities combined...and still have some $'s left over!
Looking at
Yahoo "Key Statistics" to get some sense of valuation questions, we find that the market cap is a mid-cap $2.03 billion. The trailing p/e is moderate at 33.96, with a forward p/e (fye 30-Jun-06) more reasonable at 26.37. The PEG (5 yr expected) isn't bad at 1.33. Price/sales is rich at 5.08.
Yahoo reports 33.93 million shares outstanding with 32.60 million of them that float. Of these 2.20 million are out short (as of 1/10/05) representing 6.74% or a hefty 17.862 trading days of volume. I really do think this short interest is a factor today with the stock climbing sharply on good news. These short sellers must (?) be scrambling to cover their "shorts".
Yahoo reports no cash dividend and the last stock split was a 2:1 in April, 2000.
How about "technicals"? Taking a look at a
Stockcharts.com Point & Figure chart on RMD:
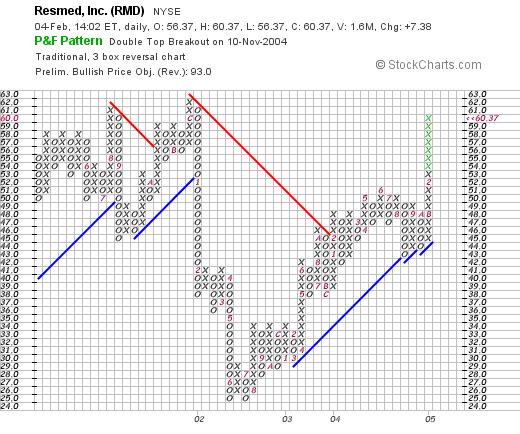
we can see that the stock was slowly appreciating between June and December 2001, reaching a high of $62. The stock then broke down in January, 2002, dropping from $62 to a low of $25.00 in June, 2002. The stock has been subsequently trading higher, and is testing those prior highs at the $57 level. The chart looks fine to me.
 So what do I think? Well, first of all, this is a long-time Stock Picks selection, so I have liked this stock for awhile. In a Peter Lynch fashion, I actually USE their product as do many other sleep-apnea people...so I am biased. But in any case, the numbers look great, the company has been steadily ramping up revenue and earnings, the balance sheet is fine, free cash flow is growing, and the chart looks nice. The stock isn't downright cheap, but with the fast growth...well I think it may be worth the price.
In any case, I liked it enough to buy some shares! Thanks again for stopping by! If you have any questions or comments, please feel free to leave them here on my blog or email me at bobsadviceforstocks@lycos.com.
Bob
"Trading Transparency" RMD
Hello Friends! Thanks so much for stopping by and visiting my blog,
Stock Picks Bob's Advice. As you probably realize from the prior post, I sold a portion of my Hibbett (HIBB) at a very nice gain. Since I am now under 25 positions, that "entitles" me to add a new position.
Scanning the
list of top % gainers on the NYSE, I recognized ResMed, Inc. (RMD) which was second on the list, trading, as I write, at $59.65, up $6.66 or 12.57% on the day.
ResMed has great numbers, recently came out with a postive quarterly report, and is involved in sleep apnea machines and equipment....selling CPAP treatments, a growing area in the medical field.
So, a few moments ago, I purchased 120 shares for my "trading portfolio", my REAL account (!), at $59.67/share.
Thanks so much for stopping by! Please remember that I am an amateur investor, so please consult with your professional investment advisors prior to making any investment decisions based on information on this website! If you have any comments or questions, please feel free to leave them right here on the blog, or email me at bobsadviceforstocks@lycos.com.
Bob
"Trading Transparency" HIBB
Hello Friends! I just wanted to keep you up-to-date with my current trading in my real
"Trading Portfolio". A few moments ago I sold 42 shares of my Hibbett (HIBB) at $27.89/share. I have a cost basis of $9.74/share on this one, which I purchased on 3/6/03. This works out to a gain of $18.15 or 186%...which is my 5th sell point(!). (For anybody new to my blog,
Stock Picks Bob's Advice, my sell points on the upside are at 30%, 60%, 90%, 120%, then 180%, 240%, 300%, and 360%. After that, I plan on going to 120% intervals...if I ever get there!).
Prior sales of HIBB included 50 shares 5/30/03, 50 shares 9/4/03, 40 shares 10/15/03, and 20 shares 4/5/04. Each at our prior sell points.
Anyhow, that means, I can buy another position, and that nickel is burning a hole in my pocket already!
Thanks so much for stopping by. Please remember that I am an amateur investor so please consult with your professional investment advisors prior to acting on any information on this website. If you have any questions or comments, please feel free to leave them right here on the blog, or email me at bobsadviceforstocks@lycos.com .
Bob
Thursday, 3 February 2005
Nominated for the 2005 Business Blogging Awards

I am pleased to announce that
Stock Picks Bob's Advice has been nominated for Best Business/Investing blog for 2005. So folks, if you like what I write, head on over to the
2005 Business Blogging Awards Site and vote!
Sorry about that shameless self-promotion :).
Bob
February 3, 2005 Mercury Interactive (MERQ)

Hello Friends! Thanks so much for stopping by and visiting my blog,
Stock Picks Bob's Advice. As always, please remember that I am an amateur investor, so please consult with your professional investment advisors prior to making any investment decisions based on information on this website.

Looking through the
list of top % gainers on the NASDAQ today, I came across Mercury Interactive (MERQ) which was trading sharply higher. As I write, MERQ is trading at $47.89, up $3.69 or 8.35% on this otherwise bearish day. I do not own any shares nor do I have any options on this stock.

According to the
Yahoo "Profile" on MERQ, Mercury Interactive "...is a provider of software and services for the business technology optimization (BTO) marketplace."
What drove the stock higher today, was the
4th quarter 2004 earnings report, which was released yesterday (2/2/05) after the close. For the quarter ended December 31, 2005, revenue came in at $204.3 million, a 34% increase over the $152.0 million reported in the same quarter in 2003. Net income for the fourth quarter was $35.0 million or $.36/diluted share compared to $13.1 million or $.13/diluted share last year. In addition, the company raised guidance for 2005.
As
reported:
"The skeptic might argue that the forward guidance almost looks too good to be true, and may be difficult to achieve, but Mercury benefits from more revenue coming from the balance sheet than most, and is coming off an exceptionally strong fourth quarter," said JP Morgan Adam Holt in a research note.
How about "longer-term"? For that, I like to turn to the
Morningstar.com "5-Yr Restated" financials on MERQ. Here we can see a steady revenue increase from $188 million in 1999 to $633 million in the trailing twelve months (TTM).
Earnings have been more erratic, but have been increasing recently, and increased from $.39/share in 1999 to $.66 in the trailing twelve months.
Free cash flow has also been positive and growing. They reported $61 million in free cash flow in 2001, $124 million in 2002, $163 million in 2003 and $183 million in the trailing twelve months.
How about their balance sheet? Looking at Morningstar, we can see that the company does have some significant long-term debt, but the cash level is at $476 million, other current assets are at $222.3 million, which is more than enough to cover the current liabilities of $445.2 million, and make a dent in the long-term liabilities of $896.7 million.
How about "valuation"? Looking at
MERQ "Key Statistics" on Yahoo, we can see that this is a large cap stock with a market cap of $4.06 billion. The trailing p/e is rich at 54.87, the forward p/e (fye 31-Dec-06) is slightly better at 35.61, the PEG (5-yr) is 1.95, with a price/sales at 5.89. Certainly, this isn't a cheap stock but the performance is still impressive.
Yahoo reports 84.42 million shares outstanding with 77.70 million of them that float. Of these, 6.99 million are out short as of 1/10/05. This represents 8.995 of the float or 3.845 trading days of volume.
No cash dividend is reported, and the last stock split was a 2:1 split on February 14, 2000.
How about "technicals"? Taking a look at a
point & figure chart from Stockcharts.com:
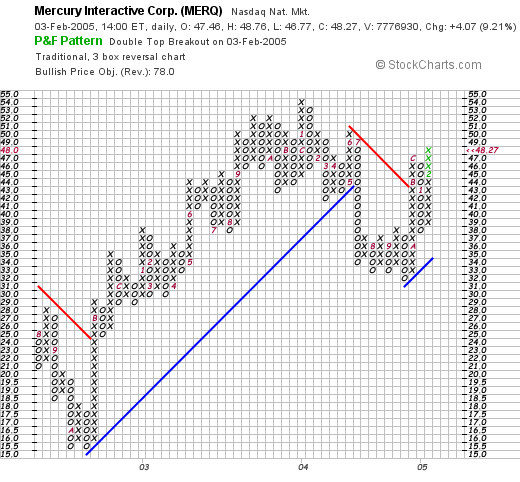
we can see that this stock was moving ahead strongly between August, 2002, when it was trading around $15 to July, 2004, when the stock price broke down as it broke through a support level at around $43. The stock appears to have bottomed at around $31, and is now heading higher, having broken through resistance at around $43 again. Not as strong a chart as some, but not bad overall, imho.
 So what do I think? Well the latest earnings report was solid. They have been growing steadily the past five years. Free cash flow is nice and the balance sheet is respectable. However, valuation is a bit steep, and the chart, looking good short-term, has a little bit more to do to convince me! Anyhow, that is just sour grapes because I spent my money this morning on another stock, MNT, and now must wait for a sale of another portion of my positions to add a new stock!
Thanks again for stopping by! If you have any questions,comments, or words of encouragement, please feel free to post them here or email me at bobsadviceforstocks@lycos.com.
Bob
Newer | Latest | Older


