Stock Picks Bob's Advice
Saturday, 26 February 2005
A Reader Writes "Will PMTI split?"
Hello Friends! Thanks so much for stopping by and visiting my blog,
Stock Picks Bob's Advice! As always, please remember that I am an amateur investor, so please consult with your professional investment advisors prior to acting on any information on this website.
I always enjoy getting letters and comments from readers! Checking my mailbox, I found this:
hi bob
just wanted to email you to say i have some stock in pmti aswell, and just curious to know if you think the stock will split and if so what should i be looking for?
rick
Well Rick, first of all, I am glad that you own some PMTI, which is Palomar Medical Technolgies.
On February 10, 2005, PMTI
reported 4th quarter 2004 results. Fourth quarter revenues jumped 63% to $16.4 million from $10.1 million the prior year. Net income came in at $5.4 million or $.29/diluted share, up from $1.0 million or $.06/diluted share the prior year. These were great results and the stock has been strong since then.
Looking at a recent
"Point & Figure" chart from Stockcharts.com:
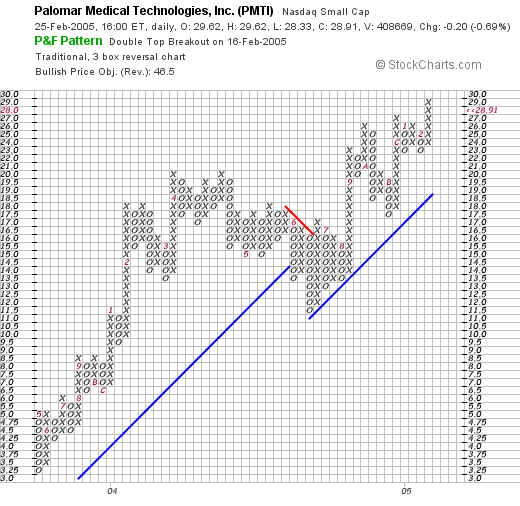
You can see how strong this stock has been performing! Looks like it broke down a little back in June 2004, when it dropped from $21 to $11.50. However, the stock has been strong since that time, staying above its support line.
When do I think it will split? I really don't know. It doesn't really affect my actions on a stock. I just wait until it hits percentage gain points and sell portions of my holdings.....so I don't really know WHEN it will split, or if it will.
What should you be looking for? That is certainly up to you. As for me, I sell portions at gains and then raise the downside stop each time...that is raise the level at which I would sell the remaining position on a retrenchment of the stock.
I frankly don't think I have answered your question, so if you have additional comments, please post them here or email me at bobsadviceforstocks@lycos.com.
Bob
"Looking Back One Year" A review of stock picks from the week of January 5, 2004


Hello Friends! Thanks so much for stopping by and visiting my blog,
Stock Picks Bob's Advice! I have enclosed an image from the New York
Burns Film Center on one of my old favorite cartoon figures: Mighty Mouse!
As always, please remember that I am an amateur investor so please consult with your professional investment advisors prior to making any decisions based on information on this website.
It is the weekend and I like to review past selections when I get a chance (!), and see how they would be doing if we had purchased all of them and held on to them...without selling either at a loss of 8% or at gains; a process that I like to do with my real trading portfolio. In any case, it still gives us an idea about the potential and the pitfalls of this and any trading strategy! This week I am up to the week of January 5, 2004. I made six selections that week.

On January 5, 2004, I
posted Applied Films (AFCO) on Stock Picks at $37.46. AFCO closed at $22.30 on 2/25/05 for a loss of $(15.16) or (40.5)%.

On January 20, 2005, AFCO
reported 2nd quarter 2005 earnings results. Net revenues were down (17.9)% to $46.9 million compared to $57.1 million the prior year. Pro forma income from continuing operations was down to $1.8 million or $.12/diluted share from $4.1 million or $.28/diluted share the prior year.

On January 6, 2004, I
posted Dollar Tree (DLTR) on Stock Picks at a price of $31.85. DLTR closed at $26.85 on 2/25/05 for a loss of $(5.00) or (15.7)%.

On February 23, 2005, DLTR
reported 4th quarter 2004 results. Sales for the quarter came in at $987.5 million, a 10.6% increase over the $893.1 million the prior year. Earnings came in at $.79/share up from $.69/share in the same quarter last year. For the year, same-store sales growth was an anemic 0.5%.

On January 7, 2004, I
posted Kenneth Cole Productions (KCP) on Stock Picks at a price of $31.95. KCP closed at $29.09 on 2/25/05 for a loss of $(2.86) or (9.0)%.
On February 24, 2005, KCP
reported 4th quarter 2004 results. Fourth quarter revenue, for the quarter ended December 31, 2004, increased 5.3% to $136.1 million. However, fourth quarter diluted EPS dropped to $.45/share from $.49/share the prior year.

On January 7, 2004, I
posted Unifirst (UNF) on Stock Picks at a price of $27.11. UNF closed at $39.25 on 2/25/05 for a gain of $12.14 or 44.8%.
On January 5, 2005, UNF
announced 1st quarter 2005 results. For the quarter ended November 27, 2004, revenues increased 4.2% to $188.4 million from $180.9 million the prior year. Net income came in at a record $13.4 million, or $.69/diluted share, a 40.2% increase from last year's first quarter net income of $9.5 million or $.49/diluted share.

On January 8, 2004, I
posted Resources Connection (RECN) on Stock Picks at a price of $34.50. RECN closed at $49.89 on 2/25/05 for a gain of $15.39 or 44.6%.
On December 22, 2004, RECN
reported 2nd quarter 2005 results. For the quarter ended November 30, 2004, revenue came in at $137.0 million, an 85% increase over the $74.0 million the prior year. (Sequentially revenue was up 19%!). Net income for the quarter was $15.6 million, or $.62/diluted share, up from $4.4 million or $.19/diluted share, an over 200% increase in earnings!

Finally, on January 9, 2004, I
posted American Medical Systems (AMMD) on Stock Picks at a price of $25.96. AMMD closed at $39.70 on 2/25/05 for a gain of $13.74 or 52.9%.
On February 17, 2005, AMMD
reported 4th quarter 2004 results. For the quarter ended January 1, 2005, sales were $60.0 million, a 27.3% increase over sales of $47.2 million the prior year. Net income was affected by write-offs, and came in at $6.7 million or $.19/share, down from $10.3 million or $.30/share the prior year. However, excluding the impact of an investment write-off and the effect of tax rate changes...net income for the quarter worked out to $10.8 million or $.30/share up from $8.4 million or $.24/share the prior year. You decide. However, the street appears to have like the results as the stock price held up nicely.
So how did we do that week a year ago??? I actually had three stocks that declined (AFCO, DLTR, and KCP); and three stocks that appreciated inprice (UNF, RECN, and AMMD). However, the stock appreciating were overall stronger than the losing stocks and I had an average increase of 12.9% for the six stocks!
Thanks again for stopping by! If you have any questions or comments, please feel free to email me at bobsadviceforstocks@lycos.com.
Bob
"Revisiting a Stock Pick" Synaptics (SYNA)

Hello Friends! Thanks so much for stopping by and visiting my blog,
Stock Picks Bob's Advice. As always, please remember that I am an amateur investor, so please consult with your professional investment advisors prior to making any investment decisions based on information on this website.

Yesterday my stock in Cal Dive (CDIS) hit my first targeted price for a sale, which as you may know is a 30% gain after an initial purchase. Thus, I sold 1/4 of my position, 50 shares, and had a new signal to deal with. Since I am under my 25 position portfolio goal (now at 21 issues), I was thus "entitled" to purchase a new position. Scanning through the
list of top % gainers on the NASDAQ, I came across Synaptics (SYNA), a stock that I had listed first on 4/23/04 at a price of $17.69 on Stock Picks and was having a great day, closing yesterday at $24.33, up $3.32 or 15.80% on the day. I purchased 300 shares of SYNA at $24.02 prior to the close for my trading account. I have had some Synaptics shares in a managed account this past year...and am actually not sure whether I still have shares there, but believe I do. (I don't monitor one of my managed retirement accounts very closely at all!).

According to the
Yahoo "Profile", SYNA "...is a worldwide developer and supplier of custom-designed user interface solutions for notebook computers."
What drove the stock higher yesterday, was the release of
news that the new iPods from Apple Computer wil utilize Synaptics' touchpad technology. The stock had been under pressure recently over the possibility that Apple would no longer be requiring Synaptics' products in their new line.

On January 20, 2005, Synaptics
reported 2nd quarter 2005 results. Net revenue for the second quarter ended December 31, 2004, came in at $56.5 million, an approximately 65% increase over the $34.3 million of net revenue the prior year same quarter. Net income was $9.7 million or $.33/diluted share for the quarter, an approximately 178% increase (!) over the $3.5 million or $.13/diluted share the prior year. Although believing the current quarter to be flat sequentially, the company expressed optimism for the 2005 fiscal year stating:
"Fiscal 2005 is shaping up to be an outstanding year based on our record first half performance and current outlook for the second half of the year"
How about longer-term? Taking a look at the
"5-Yr Restated" financials from Morningstar.com, we can see the steady 'ramping-up' of revenue from $43.4 million in 2000 to $141.8 million in the trailing twelve months (TTM).
Earnings have increased from $.31/share in 2003 to $.55/share in the TTM. (Note the $.33/share in the latest quarter alone!). Free cash flow has been steady if not growing with $12 million reported in 2002 and $12 million reported in the TTM.
The balance sheet as reported on Morningstar.com looks very strong. SYNA has $97.3 million in cash, enough to cover both the $25.5 million in current liabilities and the $2.4 million in long-term liabilities almost four times over. In addition, they have $40.5 million in
other current assets!

How about "valuation"? As has been pointed out by readers, I really do a very brief look at valuation issues...for what it is worth, I like to at least take a look at
"Key Statistics" from Yahoo on SYNA. Here we can see that this is a mid-cap stock with a market cap of $639.30 million. The trailing p/e is moderate at 32.27, and the forward p/e (fye 30-Jun-06) is nicer at 22.32. With the fast growth rate anticipated (as noted in the latest quarter), we have a PEG (5-yr expected) of 0.62. The Price/Sales is a bit richer at 3.36.
Yahoo reports 26.28 million shares outstanding with 25.00 million of them that float. Currently there are 2.12 million shares out short as of 1/10/05, representing 8.46% of the float but only 2.059 trading days. Using my arbitrary 3 days of trading volume cut-off, this short interest does not appear to be very significan (imho).
No cash dividend and no stock dividends are reported on Yahoo.
How about "technicals"? In other words, what about a chart on the price performance of this stock? Taking a look at a
"Point & Figure" chart from Stockcharts.com:
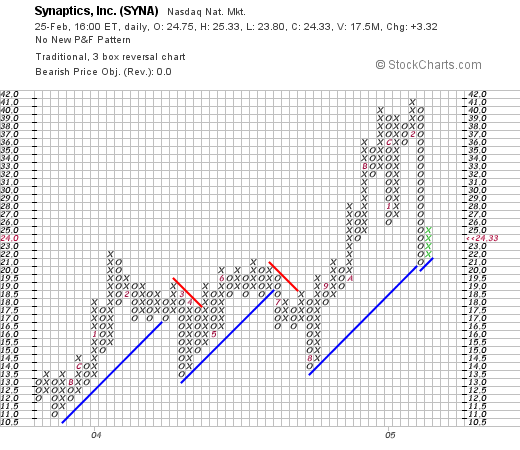
We can see that this stock has been gradually increasing in price from late 2003 when it was trading around $11/share to a recent high of $41/share in February, 2005. The stock declined recently on speculation about a loss in the Apple contract, back to support levels at around $21. It rebounded yesterday, and in my humble opinion, doesn't appear over-valued, nor does it appear to have broken down in price performance.
So what do I think? Well, I liked this stock before in April, 2004, when it was trading around $17.69. The stock had a great earnings report a few weeks ago, has shown steady growth over the past five years in both revenue and earnings, is generating a steady free cash flow, has an outstanding balance sheet, has a valuation that has a reasonable PEG, and the chart looks nice too! I guess that is why I decided to buy some shares yesterday!
Thanks again for stopping by and visiting. If you have any comments or questions, please feel free to email me at bobsadviceforstocks@lycos.com.
Bob
Friday, 25 February 2005
"Trading Transparency" SYNA
Hello Friends! A few moments ago, I purchased 300 shares of Synaptics, Inc. (SYNA) at $24.02 for my trading account. This is a stock I have reviewed earlier which apparently was lower on thoughts it would lose an Apple contract, but which popped higher today on reaffirmation of that relationship!
Anyhow, looks nice to me!
I have posted on this one before, but shall try to give a little update later...if I get a chance :).
Bob
"Trading Transparency" CDIS
Hello Friends! I just wanted to keep you up to date on my trading portfolio. Thanks again for visiting my blog,
Stock Picks Bob's Advice. As always, please remember that I am an amateur investor, so please consult with your investment advisors prior to acting on any investment ideas on this website.
A few moments ago I made my first sale at a gain on Cal Dive Intl (CDIS). I sold 50 shares (of my original purchase of 200....a 25% position) at $50.03. I purchased these shares on 11/3/04 at a cost basis per share of $38.20. Thus, I had a gain of $11.83/share or 30.1%.
Thus, I am now able :) to purchase a new position, and I shall be visiting the top % gainers list in a few moments! I shall let you know if I find anything interesting! (My maximum # of positions, in my strategy, is 25 positions...and I thus have room for 5 additional positions....at that point, hopefully soon, I shall be sitting on my hands after a sale, and paying off, at long last, my margin! That would be a wonderful thing to happen!
Again thanks so much for stopping by! If you have any questions or comments, please feel free to email me at bobsadviceforstocks@lycos.com.
Bob
Posted by bobsadviceforstocks at 12:54 PM CST
|
Post Comment |
Permalink
Updated: Friday, 25 February 2005 12:55 PM CST
Sunday, 20 February 2005
"Looking Back One Year" A review of stock picks from the week of December 29, 2003
Hello Friends! Thanks so much for stopping by and visiting my blog,
Stock Picks Bob's Advice. As always, please remember that I am an amateur investor so please always consult with your professional investment advisors prior to making any investment decisions based on information on this website.

At the right is a beautiful
picture of Yosemite.
My blog includes lots of ideas about stocks. I believe that among these, are potential outstanding performers. In my actual
Trading Portfolio, I use pre-set sell-points to prevent the development of significant losses (by selling at an 8% loss), and to prevent failing to take gains (by selling portions at 30, 60, 90, 120, 180, 240% gains...). But for this weekend review, I just assume a "buy and hold" strategy, and see what would have happened if I had purchased equal dollar amounts of all of the stock picks that week and had simply 'held on'.

On December 29, 2003, I
selected Matrixx (MTXX) for Stock Picks at a price of $18.28. MTXX closed at $12.39 on 2/18/05 for a loss of $(5.89) or (32.2)% since posting.
On February 9, 2005, MTXX
announced 4th quarter 2004 results. For the quarter ended December 31, 2004, net sales came in at $27.0 million, a 48% increase above net sales of $18.2 million the prior year. Net income increased 62% to $1.7 million or $.17/share compared to net income of $1.0 million or $.11/share the prior year.

I
selected American Vanguard (AVD) for Stock Picks on 12/29/03 at a price of $38.69. AVD split 3:2 on 4/19/04 for a resultant effective pick price of $25.79. AVD closed at $36.50 on 2/18/05 for a gain of $10.71 or 41.5%.
On November 3, 2004, AVD
reported 3rd quarter results. For the quarter ended September 30, 2004, net sales rose 20% to $39.6 million, net income was up 42% to $4.0 million. On a diluted per share basis, this was a 40% increase to $.42/share. All of these numbers were strong!

On December 30, 2003, I
posted Secure Computing (SCUR) on Stock Picks at a price of $16.78. SCUR closed at $9.25 on 2/18/05 for a loss of $(7.53) or (44.9)%.
On January 27, 2005, SCUR
announced 4th quarter 2004 results. Sales were up 11% to $25.5 million from $22.9 million last year. Quarterly income grew to $4.5 million or $.12/share from $4.1 million or $.11/share last year. This was slightly above consensus.

On December 30, 2003, I
posted SurModics (SRDX) on Stock Picks at a price of $24.38. SRDX closed at $31.51 on 2/18/05 for a gain of $7.13 or 29.2%.
On January 26, 2005, SRDX
reported 1st quarter 2005 results. Revenues for the first quarter ended December 31, 2004, grew 16% to $14.1 million from $12.1 million in the prior year. Net income jumped 38% to $5.7 million from $4.1 million. On a diluted per share basis, this came out to $.32/share up from $.23/share in fiscal year 2004.

Finally, on January 1, 2004, I
posted McKesson Corp (MCK) on Stock Picks at a price of $32.16. MCK closed at $36.77 on 2/18/05 for a gain of $4.61 or 14.3%.
On January 27, 2005, MCK
reported 3rd quarter 2005 results. Revenue grew 14% to $20.8 billion. Net loss came in at $(665) million or $(2.26)/share including a charge of $810 million after-tax for securities litigation. Excluding that charge, earnings actually grew 20% to $.49 or $145 million. The street wasn't bothered much by that one time charge and the stock price has held up fine!
So how did we do? I had five picks that week a little over a year ago. Three gained and two lost ground for an average gain of 1.58%.
Thanks again for stopping by! I hope that my review of different stocks is helpful to you in understanding my thinking! If you have any questions, comments, or words of encouragement, please feel free to email me at bobsadviceforstocks@lycos.com or leave a message right here on my blog!
Bob
Posted by bobsadviceforstocks at 6:44 PM CST
|
Post Comment |
Permalink
Updated: Sunday, 20 February 2005 10:36 PM CST
Accidental Posting :)

My daughter accidentally posted this photo on the stock blog! It is so cute I shall leave it there! Thanks!
Bob
Posted by bobsadviceforstocks at 1:24 PM CST
|
Post Comment |
Permalink
Updated: Sunday, 20 February 2005 5:06 PM CST
Friday, 18 February 2005
February 18, 2005 Allscripts Healthcare Solutions (MDRX)

Hello Friends! Thanks so much for stopping by and visiting my blog,
Stock Picks Bob's Advice. For those of you who are new to this blog, please make yourself at home. I hope that what I write helps you think more clearly about investing. However, always remember that I am an amateur investor so please consult with your professional investment advisors prior to making any decisions based on information on this website!
After many years of searching for stocks that would just 'cooperate' and move higher, I have found that some of the most likely candidates for purchase may be found by perusing the
list of top % gainers on the NASDAQ. I also like to review the same list for the
NYSEand the
AMEX.
Today, reviewing the NASDAQ list, I came across Allscripts Healthcare Solution (MDRX) which is actually the 4th best gainer on the NASDAQ (as I write). Currently, MDRX is trading at $13.16, up $2.13 or 19.31% on the day! According to
the Yahoo "Profile" on MDRX, Allscripts "...is a provider of clinical software and information solutions for physicians." I do not own any shares nor do I have any options on this stock.
One of the most important factors, imho, that drives a stock higher is earnings. That is positive earnings growth and postive revenue growth in a consistent fashion is very attractive to the investing world. What drove the stock higher today, was the announcement of
4th quarter 2004 earnings results yesterday, just after the close of regular trading. For the three months ended December 31, 2004, total revenue was $26.3 million, up from $23.7 million in the prior year same quarter. Net income was $1.4 million or $.03/diluted share compared with $0.1 million or $.00/diluted share the prior year same period.

Please note again that important word "consistent" that I mentioned in the previous paragraph. While sometimes I am a very short-term investor, and may sell a stock a day after buying it on a loss, I really would love to own stocks that appreciate year after year! So, while a good quarter is nice, I am interested in stocks that repetitively deliver good results. That, imho, is what I call a "quality" investment. And that is what I believe is the key to investment success!
And
how do I find consistent companies? Well, as you may know, I am fond of the
Morningstar.com website. Fortunately, virtually all of the information that I use at this time is available as a free service!
For MDRX, I reviewed the
Morningstar.com "5-Yr Restated" financials. Here we can see that first revenue growth has been very consistent, increasing from $28 million in 1999 to $98 million in the trailing twelve months (TTM).
Earnings have been erratic, dropping from a loss of $(.91)/share in 1999 to a low of a loss of $(11.07)(!)/share in 2001, then improving steadily since that point. It appears that MDRX just turned profitable this past year.
The next thing I like to check on the same Morningstar.com page is "Free Cash Flow". In my simplified understanding of this accounting term, free cash flow which is defined as the operating cash flow minus the capital expenditures, is the amount of real 'cash' that the company is either generating (positive) or consuming (negative). In the great dot.com era, the "burn rate" of these high tech firms was a constant factor in predicting how long a company would have before it ran out of money literally. I am looking for companies that are generating money and not consuming their assets!
For MDRX, we can find a steadily improving picture in the cash flow department, from a negative $(37) million in 2001, $(12) million in 2002, to $5 million in 2003 and $8 million in the trailing twelve months.

The next thing I like to review on Morningstar is a brief look at the assets and liabilities picture. Again, I am not an accountant, so my examination is fairly superficial...but still, it is helpful to have a handle on this. Basically, I am interested in companies that have lots of assets, and relatively little in the liabilities department. I am concerned that current assets, those, as I understand it, are either cash or easily turned into cash in the next 12 months, to be far greater than current liabilities, which are those liabilities, again as I understand it, that come due either immediately or in the next 12 months.
I would like to see very low levels of long-term debt, but as long as free cash flow is growing and positive, and current assets exceed current liabilities, I am not as concerned about this figure.
And what are the numbers for MDRX? Well, Morningstar shows that this company has $62.6 million in cash and $26.5 million in other current assets. This is plenty to cover the $30 million in current liabilities and still have additional funds to pay off a significant portion of the long-term liabilities. I am comfortable with this company's balance sheet.
How about "valuation"? Do we have to stick to one style of investing? Of course not. We can examine companies through a lot of different perspectives!
Again I turn to Yahoo and look at the
Yahoo "Key Statistics" for MDRX. First off, how "big" a company is this?
Many investors confuse the size of a company with its stock price. A large cap stock has nothing to do with stock price nor does a small cap stock. Market capitalization is determined by multiplying the price of a stock by its # of shares.
There are actually many definitions out there on market cap and I have used the
Ameritrade definition:
"Small-cap -- less than $500 million Mid-cap -- between $500 million and $3 billion Large-cap -- over $3 billion."
MDRX sneaks in below the mid cap level at $494.67 million, so we may call it a "small cap".
Since this company is just turning profitable, the p/e is HUGE at 299.77. However, going forward based on estimates (fye 31-Dec-05), we have a more reasonable 25.78 p/e. Thus, the PEG (p/e compared to growth rate), isn't bad at 1.70. Price/Sales is a bit rich at 4.31. I think that "cheap" has both of these ratios around 1.0.
On the same page, we can see that there are 38.38 million shares outstanding with 27.10 million of them that "float". Of these, 3.02 million shares are out short, representing 11.14% of the float (as of 1/10/05). To determine how long it would take to cover these shares which were borrowed and sold by investors speculating on a price decline, we have the "short ratio" which is the number of average trading days of volume required for the short-sellers to buy back their shorts. I personally have arbitrarily set 3 days as a cut-off of significance, that is, more than 3 days, imho, is significant. In this case, the short ratio (as of 1/10/05) is 9.063. Thus, with today's good news on earnings, there is the possibility that these short-sellers were scrambling to cover their "shorts" while the stock was rising.
Yahoo finishes this page off with the report that there is no annual dividend and no stock-split reported.
How about "technicals". As I pointed out earlier, I like to look at a stock from a variety of perspectives. The technician, or chartist, likes to look at the chart to determine future price action. Again, I am totally a novice at looking at charts, am not too sure how much I "believe" in them, but still would rather go long with a stock that has a chart that appears to be on the upswing then the other way around.
If you look at this blog much, you will realize that I like to use "Point & Figure" charts. As
explained on Stockcharts.com:
Point & Figure charts consist of columns of X's and O's that represent filtered price movements over time. Their distinctive look may be alien at first to people who are more familiar with traditional price bar charts but once people learn the basics of P&F charts they usually become hooked.
There are several advantages to using P&F charts instead of the more traditional bar or candlestick charts. P&F charts automatically:
Eliminate the insignificant price movements that often make bar charts appear 'noisy.'
Remove the often misleading effects of time from the analysis process.
Make recognizing support/resistance levels much easier.
Make trendline recognition a 'no-brainer'.
Help you stay focused on the important long-term price developments."
Anyhow, here is the
MDRX "Point & Figure Chart" from Stockcharts.com:
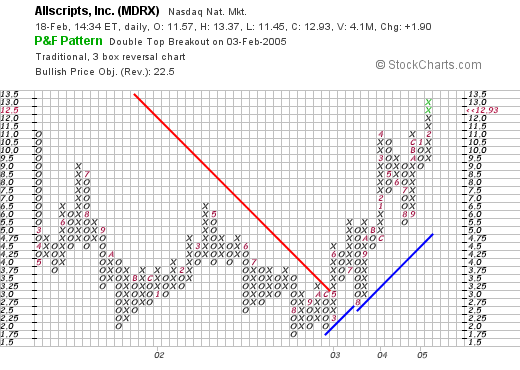
Here we can see that the stock price was actually declining from $11.00/share in February, 2001, to a low of $1.75/share in August, 2002, The stock broke through resistance in early 2003 at $3.00, and has traded higher above the support line since then. Overall, the graph looks strong!
So what do I think? How do I put all of this together? Well, in summary, the stock has moved nicely higher today, they just reported a very nice earnings report showing growth in both revenue and earnings. The company has been growing its revenue steadily for the past five years and has been improving its earnings picture for the last several of those years.
Free cash flow is excellent, the balance sheet is nice, and valuation is reasonable since the company is just turning positive. The chart looks nice...and there are a bunch of short-sellers out there who may well be providing some buying pressure.
And why don't I buy some shares? Well that is a whole different issue, certainly, my portfolio at 20 positions has 5 slots for new positions. However, I use my own portfolio as a barometer for adding new money or moving to cash. I am waiting for a sale of a portion of one of my holdings at a gain prior to buying a new stock! Otherwise, I would find this one to be attractive.
I hope that I wasn't too wordy today! Thanks again for bearing with me. If you have any comments, questions or words of encouragement, please feel free to email me at bobsadviceforstocks@lycos.com!
Bob
Posted by bobsadviceforstocks at 1:45 PM CST
|
Post Comment |
Permalink
Updated: Friday, 18 February 2005 5:33 PM CST
Tuesday, 15 February 2005
February 15, 2005 ANSYS (ANSS)

Hello Friends! Thanks again for stopping by and visiting my blog,
Stock Picks Bob's Advice. As always please remember that I am an amateur investor, so please consult with your professional investment advisors prior to making any investment decisions based on information on this website!

Looking through the
list of top % gainers on the NASDAQ today, I came across ANSYS (ANSS), which closed at $37.03, up $2.63 or 7.65% on the day. I do not own any shares nor do I have any options on ANSS.
What drove the stock higher today was an excellent
4th quarter 2004 earnings results. For the quarter ended December 31, 2004, total revenue came in at $38.9 million, up from $33.3 million the prior year. Diluted earnings per share came in at $.36 (or $.33 if adjusted for a one time tax benefit), compared with $.22/diluted share last year during the fourth quarter of 2003.
How about longer-term? Looking at a
"5-Yr Restated" financials on Morningstar.com, we can see a nice 'ramp-up' of revenue from $63.1 million in 1999 to $128.9 million in the trailing twelve months (TTM). Earnings during this period have also fairly consistently grown from $.44/share in 1999 to $.90/share in the TTM.
Free cash flow has been solid and improving recently. This was $21 million in 2001, and has grown to $45 million in the TTM.
Balance-sheet-wise, ANSS looks good with $124.3 million in cash alone, adequate to cover the $54.2 million in current liabilities. There are NO long-term liabilities according to Morningstar.com. In addition, ANSS is reported to have an additional $33.6 million in other current assets.
How about valuation? Looking at
"Key Statistics" on ANSS from Yahoo, we can see that this company is a mid-cap market cap of $1.15 billion. The trailing p/e is a bit rich at 41.10, the forward p/e is 32.77 and the PEG (5 yr expected) is also a bit rich at 2.25. The price/sales is 8.27.
Yahoo reports 30.97 million shares outstanding with 29.40 million of them that float. Of these 744,000 are out short as of 1/10/05. This represents 2.53% of the float or a mnodest 3.477 trading days of volume.
No cash dividend are reported. The stock did split recently 2:1 on 10/5/04.
How about technicals?
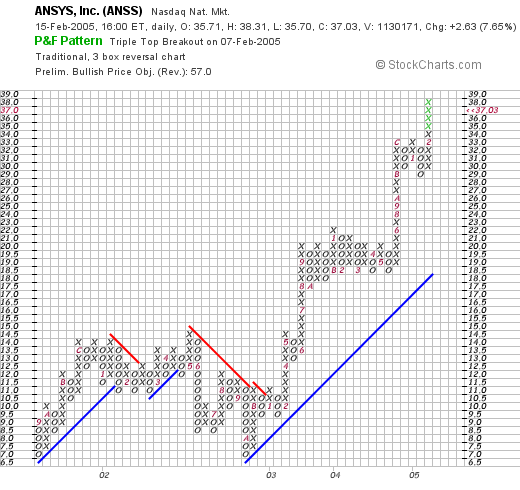
Taking a look at a Point & Figure Chart from Stockcharts.com, we can see a fairly pretty and steady advance in stock price. The stock did pull back after January, 2002, when it dropped from $14.00 to a low of $7.00 in October, 2002. However, since that October, 2002, date, the stock has been rising steadily and strongly to its current level of $37.03.
So what do I think? Everything appears to be in line, the recent earnings, the 5 year record, the free cash flow, and the balance sheet. The chart also looks very nice. I think the valuation is a little bit of concern to me....but will withhold judgement on that question for now. It has the characteristics that I like to see in a stock: good recent quarterly growth, steady growth in earnings, growing free cash flow, and a good balance sheet. I would prefer a cheaper valuation...but then again you cannot always have everything!
Now, if I only had a signal from my own trading account, and I might be buying a few shares!
Thanks so much again for stopping by! If you have any questions or comments, please feel free to email me at bobsadviceforstocks@lycos.com.
Bob
Saturday, 12 February 2005
"Looking Back One Year" A review of stock picks from the week of December 22, 2003
Hello Friends! Thanks so much for stopping by and visiting my blog,
Stock Picks Bob's Advice. As I always remind you, please remember that I am an amateur investor, so please consult with your professional investment advisors prior to making any decisions based on information on this website.
I use the weekend to post a review of past stock picks on this site. I have been running Stock Picks since May, 2003, and have hundreds of stocks listed. In order to see how "we are doing", I try to look back about a year, and each week move another week ahead...and see if I had purchased each stock and had held on without regard to sales on the downside or upside, how would I have done? Of course, this is not how I personally manage my portfolio, but it can give us a rough idea how my 'system' is working!

On December 23, 2003, I
posted Ventana (VMSI) on Stock Picks at a price of $39.80. VMSI closed at $70.96 on 2/11/05, for a gain of $31.16 or 78.3%.
On February 4, 2005, VMSI
announced 4th quarter results.
For the quarter ended December 31, 2004, sales were $48 million, a 27% increase over the fourth quarter of 2003. Net income for the quarter was $8.6 million or $.48/diluted share compared with a net loss of $(2.0) million or $(.12)/diluted share the prior year. To top off this story, VMSI also announced a 2:1 stock split.

On December 23, 2003, I
posted Computer Sciences (CSC) on Stock Picks at a price of $43.80. On February 11, 2005, CSC closed at $48.51 for a gain of $4.71 or 10.8%.
On February 8, 2005, CSC
reported 3rd quarter results.
Revenue rose 6% to $3.52 billion while earnings were up 23% to $157.5 million, or $.82/share from $128.4 million or $.68/share the prior year.

On December 24, 2003, I
posted Sanderson Farms (SAFM) on Stock Picks at a price of $42.79. SAFM closed at $45.22 on 2/11/05, for a gain of $2.43 or 5.7%.
On December 7, 2004, Sanderson
reported 4th quarter 2004 results. For the quarter ended October 31, 2004, net sales came in at $259.2 million, up from $254.7 million the prior year. However, net income was $5.1 million or $.25/diluted share compared with $20.5 million or $1.04/diluted share the prior year.

On December 24, 2003, I
posted Faro Technologies (FARO) on Stock Picks at a price of $23.90. On February 11, 2005, FARO closed at $28.75, for a gain of $4.85 or 20.3% since posting.
On November 4, 2004, FARO
reported 3rd quarter 2004 results.
For the quarter ended October 2, 2004, sales increased 21.9% from $19.2 million to $23.4 million in the quarter. Net income was down slightly to $3.1 million or $.22/diluted share from $3.3 million, or $.26/diluted share in the third quarter of 2003. However, the 2003 quarter included "other income" related to a settlement from arbitration of $1.1 million or $.08/diluted share. Thus, results were actually a little bit better than last year!

The last stock picked that week was Sharper Image (SHRP), which was
picked on Stock Picks on December 26, 2003, at a price of $32.40. SHRP closed at $15.10 on 2/11/05, for a loss of $(17.30) or (53.4)% since posting.
On November 18, 2004, SHRP
reported 3rd quarter 2004 results.
Revenue climbed 20% to $153.6 million from the prior year's $128.1 million. Total store sales were up 15% to $80.1 million, but same store sales actually dropped 1%. However, catalog sales increased 28% to pick up the drop at existing stores. However, the third quarter result was a loss of $(3.3) million or $(.21)/share compared with a prior year's gain of $1.0 million or $.06/diluted share. Recently, on 2/10/04, SHRP
reduced outlook further and the stock has continued to trade lower.
Well, how did we do on these five stocks? Assuming an equal dollar amount invested in each of these five, and a buy and hold strategy, I had an average performance of a gain of 12.34%.
Thanks so much for stopping by! If you have any questions, comments, or words of encouragement, please feel free to email me at bobsadviceforstocks@lycos.com.
Bob
Newer | Latest | Older


