Stock Picks Bob's Advice
Sunday, 22 May 2005
"Looking Back One Year" A review of stock picks from the week of March 29, 2004

Hello Friends! Thanks so much for stopping by and visiting my blog,
Stock Picks Bob's Advice. As always, please remember that I am an amateur investor, and that prior to making any investment decisions based on information on this website, you need to consult with a professional investment advisor, to make sure that such investments are appropriate, timely, and likely to be profitable for you!
It is getting late Sunday evening, and if you are a regular reader of this blog, you know that I should already have a weekend review up and running! However, I went out to a birthday party for a couple of my friends hitting the ripe old age of 50, heaven forbid, and am just now getting settled to write up this review.
As I like to point out, the review assumes a "buy and hold" strategy for investing. I simply look at the price a stock was posted and the current price. In actual practice, in my
"Current Trading Portfolio", I do
not practice a buy and hold strategy; I use a quick sale at an 8% loss, and slow partial sales as a stock appreciates. This would definitely affect the performance of the stocks reviewed, but nevertheless, it is helpful to look back and see what would really have happened if you had purchased the stocks that particular week which were listed here.

On March 29, 2004, I
posted Gevity HR (GVHR) on Stock Picks at a price of $28.10. GVHR closed at $17.30 on 5/20/05 for a loss of $(10.80) or (38.4)%.

On April 21, 2005 GVHR
reported 1st quarter 2005 results. Revenues increased 22.2% to $153.9 million from $125.9 million the prior year same quarter. Net income increased 28.4% to $8.2 million or $.29/diluted share vs. $6.4 million or $.24/diluted share the prior year.

On March 31, 2004, I
posted Harvard Bioscience (HBIO) on Stock Picks at a price of $9.14. HBIO closed at $3.05 on 5/20/05 for a loss of $(6.09) or (66.3)%.
On May 5, 2005, HBIO
reported 1st quarter 2005 results. Revenue grew a slim 1% to $22.4 million from $22.2 million last year. Net income for the quarter ended March 31, 2005, came in at $.2 million or $.01/diluted share compared with a net loss of $(51,000) or $.00/diluted share last year. This was a marginally adequate report, but I would much prefer to see a robust revenue growth alongside the improvement of earnings.

On March 31, 2004, I
posted Best Buy on Stock Picks at a price of $51.65. BBY closed at $54.36 on 5/20/05, for a gain of $2.71 or 5.2%.
On April 1, 2005, Best Buy
reported 4th quarter results. Revenue for the quarter ended February 26, 2005, increased 9% to $9.2 billion, compared with $8.4 billion the prior year. Same-store sales increased 2.8% a modest, but exceptable increase.

Finally, on April 2, 2004, I
posted Schnitzer Steel (SCHN) on Stock Picks at a price of $37.62. SCHN closed at $23.20 on 5/20/05 for a loss of $(14.42) or (38.3)%.
On April 6, 2005 Schnitzer
reported 2nd quarter 2005 results. Revenue grew 33% to $215.7 milllion from $161.6 million the prior year. Earnings came in at $36 million or $1.15/diluted share for the quarter, up almost 100% to $18.5 million or $.60/diluted share! This was a great quarter for Schnitzer Steel!
So how did I do looking at the stocks a little over a year later for that particular week on the blog? In a word, awful. There is a very important lesson on this performance. Just because a stock is listed on this blog does
not mean that the stock is guaranteed to move higher! In fact, many of these stocks do move lower. Thus, the importance of being vigilant and not letting losses grow!
In fact, I had three losing stocks and only one stock with a gain on the "picked" list. The average loss on the four stocks was a significant (34.5)%!
Thanks so much for stopping by and visiting my blog. If you have any questions, comments, or words of encouragement, please feel free to email me at bobsadviceforstocks@lycos.com.
Bob
Friday, 20 May 2005
"Revisiting a Stock Pick" Kyphon (KYPH)
Hello Friends! Thanks so much for stopping by and visiting my blog,
Stock Picks Bob's Advice. As I always remind you, please remember to check with your professional investment advisors prior to making any investment decisions based on information on this website. I am an amateur investor and cannot be responsible for any of your trading decisions!

I first
posted Kyphon (KYPH) on Stock Picks on October 30, 2003, wehn it was trading at $29.15. KYPH is currently trading at $28.85, as I write, up $1.85 on 6.85% on the day. The stock is still at virtually the same level as it was in 2003 when I first wrote the stock up!

Earlier today, KYPH made the
list of top % gainers on the NASDAQ, but with the NASDAQ firming up, and the price of KYPH easing a bit, the current performance, trading at $28.81, up 6.70% on the day, is not quite a strong enough move to keep it on the list! As I wrote in the previous post, since I had sold some shares of HIBB at a gain, I was looking for a new position, and a few moments ago, I purchased 200 shares of KYPH for my trading account.
Let's take a closer look at this stock. According to the
Yahoo "Profile" on KYPH, Kyphon "...is a global medical device company specializing in the design, manufacture and marketing of medical devices to treat and restore spinal anatomy using minimally invasive technology. The Company's devices are used primarily by spine specialists, including orthopedic surgeons and neurosurgeons, interventional radiologists, and interventional neuroradiologists who repair spinal fracture caused by osteoporosis, trauma, cancer or benign lesions through performing minimally invasive surgery known as kyphoplasty."
My first step, after finding a potential investment "candidate" in reviewing a company is to check the latest quarter results. Very simply, I am looking for revenue and earnings growth, and if the company
can exceed expectations, all the more power to it!

On April 27, 2005, KYPH
reported 1st quarter 2005 results. Net sales for the quarter came in at $66.2 million, a 49% increase over the $44.4 million in net sales the same quarter the prior year. Net income came in at $6.4 million, up from $4.8 million the prior year, or on a diluted per share basis, this worked out to $.15/diluted share, up from $.11/diluted share last year.
For a 'longer-term' look at this company, I generally review the
"5-Yr Restated" finances on Morningstar.com. Here we can see the beautiful ramp-up of revenue from $6.1 million in 2000 to $235.2 million in the trailing twelve months (TTM).
Earnings have been a bit more erratic, dropping from $.65/share in 2003 to $.50/share in 2004 and increasing to $.54/share in the TTM.
Free cash flow has improved from $(2) million in 2002 to $26 million in the TTM.
The balance sheet, as presented by Morningstar.com, is gorgeous, with $128.3 million in cash, easily covering both the $30.3 million in current liabilities and the smallish $4.1 million in long-term liabilities several times over. In addition, another $71.4 million in "other current assets" is reported!

What about 'valuation' questions and other measurements on this stock? For this, I like to review the
Yahoo "Key Statistics" on KYPH. Some facts from this page include the fact that this is a mid-cap stock with a market capitalization of $1.22 billion.
The trailing p/e is a bit rich at 54.03, but the stock is growing quickly enough that the forward p/e (fye 31-Dec-06) isn't as bad at 30.32. Thus, with the quick growth, the "5 Yr Expected" PEG comes at at 1.12.
The Price/Sales ratio is reported at 4.86. Again, remembering
Paul Sturm's article from Smart Money on Price/Sales ratios, we need to compare that ratio to other stocks in the same industry group.
Looking at the "Medical Instruments/Supplies" group, we see that KYPH is somewhere in the middle of the pack on this parameter. Alcon (ACL) tops the group with a price/sales ratio of 7.7, next is Guidant (GDT) at 6.3, Kyphon (KYPH) at 4.9, Stryker (SYK) at 4.4, Boston Scientific (BSX) at 4.1, and Baxter (BAX) at 2.4. Thus Kyphon sits in the middle on this valuation measurement.
Other facts on the Yahoo page of interest include 42.38 million shares outstanding with 28.40 million of them that float. Of these, there are a LOT of shares out short, according to Yahoo, at 5.89 million as of 4/8/05, representing 20.74% of the float or 18.123 trading days of average volume. If we use the 3 day rule, like I do, then this is quite a significant short interest and could be a bullish factor for stock performance if there is a bit of a rush to get out!
No cash dividends and no stock dividends are reported on Yahoo.
What about the chart? Looking at a
"Point & Figure" chart from Stockcharts.com:
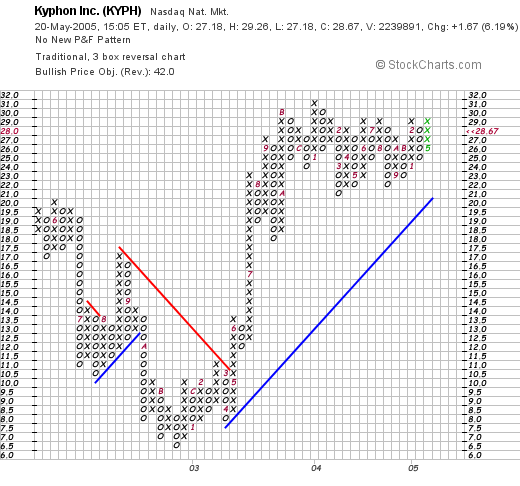
we can see that this stock was actually trading lower in 2002 from a high of $20 in June, 2002, to a low of $6.5 in late 2002. Since that point in time, the stock traded higher, breaking through resistance at $9.50 in May, 2003, and has moved to a trading range between $20 and $30 between late, 2003 and the present time. The stock has been consolidating for over a year, and may very well be "ready" to move higher!
So what do I think? Well I liked the stock enough to buy 200 shares! Seriously, the stock made a nice move today, the last quarter was great, the past five years have seen an explosive growth in revenue with a bit of inconsistency in the earnings picture. The company is generating increasing amounts of free cash and the balance sheet is gorgeous! Valuation appears a bit rich, although the Price/Sales is right in the middle of the pack. The P/E is steep but the PEG is ok. The chart appears solid to me and does not appear overextended.
Thanks again for stopping by! If you have any questions, comments, or words of encouragement, please feel free to email me at bobsadviceforstocks@lycos.com.
Bob
"Trading Transparency" Kyphon (KYPH)
Hello Friends! Thanks so much for stopping by and visiting my blog,
Stock Picks Bob's Advice. As always, please consult with your professional investment advisors prior to making any investment decisions based on information on this website. I cannot be responsible for your trades and you really need to make sure they are appropriate, timely, and likely to be profitable for you!
Well, a little earlier today, my Hibbett Stock (HIBB) had a jump in price and I sold 32 shares of my 130 share positions as it hit and passed a 240% gain target! I now have 98 shares of HIBB in my trading portfolio and selling a portion of a position at a gain, since I was only at 22 positions, gives me "permission" to add a new position.
For a long time this morning I scanned the top % gainers and couldn't find anything. The NASDAQ has firmed a bit and an old favorite, Kyphon (KYPH) showed up in the list of top % gainers. A few moments ago I purchased 200 shares of KYPH at $29.175 and I will try to post an update on the stock right here a little later today!
Thanks again for stopping by and visiting. Please feel free to leave your comments right here on the blog or email me at bobsadviceforstocks@lycos.com!
Bob
"Trading Transparency" HIBB
Hello Friends! Thanks so much for stopping by and visiting my blog,
Stock Picks Bob's Advice. As always, please remember that I am an amateur investor, so please consult with your professional investment advisors prior to making any investment decisions based on information on this website!
I just wanted to keep you posted on activity in my actual trading account. A few moments ago, I sold 32 shares of Hibbett (HIBB) at $34.41/share. This was my
sixth sale of shares of HIBB...as you may recall, I like to sell portions of my holding when they hit targets on gains....I sell 1/4 of my remaining position at 30%, 60%, 90%, 120%, 180%, 240%... Since this would be my sixth sale, my "target" was a gain of 240%.
HIBB was acquired on 3/6/03 with a cost basis of $9.74. At $34.41, this was a gain of $24.67/share or 253.3%. (!) My next targeted sale would be at a 300% gain (I go by 60% increments 2nd "round", then 90%, etc.) on the upside, or a sale at 120% on the downside. I will try to keep you posted.
Since I have just 22 positions, with 25 positions as my "goal", I am now eligible, by my own trading strategy to add a new position. That nickel is burning a hole in my pocket already!
If I see anything interesting and make a purchase, I shall keep you posted! Thanks again for stopping by and visiting. If you have any questions or comments, please feel free to email me at bobsadviceforstocks@lycos.com.
Bob
Thursday, 19 May 2005
A Reader Writes "LifeCell.....what do you think?"

Hello Friends! Thanks so much for stopping by and visiting my blog,
Stock Picks Bob's Advice. As always, please remember that I am truly an amateur investor and that you need to check with your professional investment advisors prior to making any decisions based on information on this website!
We had another good day in the market with the Dow and the Nasdaq, and particularly our stocks :), trading higher! Will the stock market go higher or pull back? Beats me! I do not believe I can predict the direction of the stock market. I just believe that we all will have the best performance simply by owning stocks with solid fundamentals and a bit of price-momentum to boot!
Looking through my mail, I realized that there was a question that I haven't addressed. My good friend George K. dropped me a note about LifeCell (LIFC). I don't know, but I suspect that he owns some shares. I do not own any LIFC shares. George wrote:
Hi Bob,
I've been enjoying your blog...it's very informative...here is a stock I would like your opinion on: LifeCell corp LIFC. It had a blowout last quarter, and the fundamental charts on Morningstar looked not too bad to me. What do you think?
George
Well, first of all thank you for writing George! I very much enjoy discussing stocks with you and you have certainly educated me about many different investments!
First of all, I
am very familiar with LIFC. I did purchase some shares back in 2003 but didn't hold on to them for long. Actually, I did
post LifeCell on Stock Picks on 6/18/03 when it closed at $5.82/share. LIFC closed today (6/19/05) two years later (!) at $13.08, up $7.26, or 124.7% since it was selected for Stock Picks two years ago!
Let's take a look at LIFC and see what's going on now.

First of all, according to the
Yahoo "Profile" on LIFC, LifeCell "...develops and markets products made from human tissue for use in reconstructive, urogynecologic and orthopedic surgical procedures to repaid soft-tissue defects."
How about the latest quarter? LIFC
reported 1st quarter 2005 results on April 26, 2005. For the quarter ended March 31, 2005, revenue came in at $19.9 million, up 45% from the $13.8 million of revenue in the same quarter the year earlier. This revenue number beat analysts expectations of $17.6 million.

Net income for the quarter rose to $2.1 million or $.07/share up from $883,000 or $.03/share last year. Analysts were looking for $.04/share, so the company again beat expectations.
To top it off, the company raised guidance both for sales and earnings above current analyst targets.
How about longer-term results? Looking at
"5-Yr Restated" financials from Morningstar.com, we can see the beautiful ramp-up of revenue from $22.8 million in 2000 to $67.3 million in the trailing twelve months (TTM).
Earnings improved from $(.54) in 2000 to a peack of $.70/share in 2003. The earnings dipped to $.22/share in 2004, but is on the rise again.
Free cash flow, while erratic, has improved from $2 million in 2002 to $6 million in the TTM.

The balance sheet is impeccable! Morningstar shows $27.8 million in cash, enough to pay off both the $9.3 million in cash and the $.2 million in long-term liabilities several times over. In addition, Morningstar reports an additional $27.1 million in other current assets.
How about valuation? What are the investment statistics on this stock? For this I like to turn to
Yahoo "Key Statistics" on LIFC. Here we can see that this is a small cap stock with a market capitalization of $382.68 million. The trailing p/e is a bit rich at 50.11, the forward p/e (fye 31-Dec-06), is a bit better at 31.90. The PEG ratio (5-yr estimated) is great at 0.84.
The Price/Sales ratio appears high at 5.66. But if we look at other stocks in the same Industry, "Biotechnology", we can see that LIFC is actually towards the bottom of the P/S ratio stocks. At top is Genentech (DNA) at 18.5, Gilead (GILD) at 12, Amgen (AMGN) at 12, Biogen Idec (BIIB) at 6, and below LIFC is Medimmune, at 5.6. Thus valuation isn't bad when you consider the particular industry group.
Other statistics on Yahoo reveal that there are 29.26 million shares outstanding with 29.10 million of them that float. Currently, there are (4/8/05) 993,000 shares out short, representing 3.41% of the float or 5.773 trading days of volume. If I use my "3-day" rule, this is a significant backlog of shares "pre-sold" that need to be covered! No cash dividend is reported. No stock splits are reported on Yahoo.
So what does the chart look like? If we check a
"Point & Figure" chart on LIFC from Stockcharts.com:
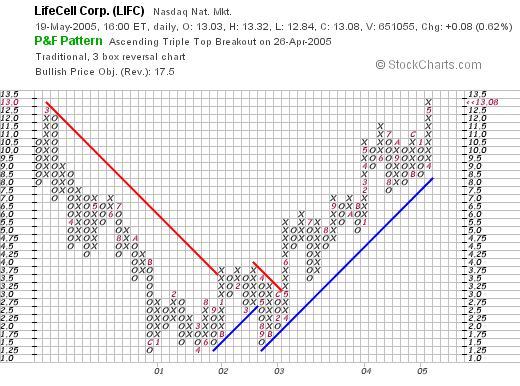
We can see that this stock was actually acting quite week from March, 200, when it was at $13, and then traded lower steadily, bottoming at $1.25 in December, 2000. The stock traded in a tight range through 2001, 2002 and into 2003. In May, 2003, the stock broke through resistance at around $3.25, and traded higher.
So George, what do I think? I still like LIFC! The recent quarter, as you noted was GREAT. The company is raising guidance on both earnings and revenue, the Morningstar 5-Yr evaluation looks great except for a bit of recent sloppiness on the earnings side of things. The company is quite solvent, generating significant free cash with a beautiful balance sheet! I guess I might even be buying some shares if the company was just fitting in to my rules...that is if I were selling a portion of my holdings at a targeted gain, and the stock was making it to the top % gainers list!
If you or anyone else has any questions or comments, please feel free to email me at bobsadviceforstocks@lycos.com!
Bob
Wednesday, 18 May 2005
"Revisiting a Stock Pick" FactSet Research (FDS)
Hello Friends! Thanks so much for stopping by and visiting my blog,
Stock Picks Bob's Advice. As I always remind you, you should consult with a professional investment advisor prior to making any investment decisions based on information on this website because I truly am an amateur! Not all investments discussed here will be appropriate, timely, or even profitable for you!
The market truly came out with a roar today, with the Dow moving up strongly along with the NASDAQ! We have had a very strong week and my investment in my trading account certainly have participated.

I was reviewin the
list of top % gainers on the NYSE today, and saw a familiar name show up on the list! FactSet Research Systems (FDS), closed at $31.53, up $2.39 or 8.20% on the day. I do not own any shares or options of FDS.
I
first posted FactSet on Stock Picks on June 17, 2003, when it was trading at $40.39. FDS had a 3:2 split 2/7/05, making the effective stock pick price $26.93. Thus, the stock hasn't really gotten away from us :) since the pick price.
According to the
Yahoo "Profile" on FDS, FactSet "...supplies financial intelligence to the global investment community. The Company combines more that 200 databases, including content regarding tens of thousands of companies from multiple stock markets, research firms, governments and other sources into a single online source of information and analytics."
On March 22, 2005, FDS
reported 2nd quarter 2005 results. For the quarter ended February 28, 2005, revenue jumped 24.6% to $76.5 million, net income was up 16.5% to $17.2 million, and on a diluted per share basis, climbed 17.2% to $.34/share.
How about longer-term? Reviewing the
"5-Yr Restated" financials, we can see the steady "ramp-up" of revenue from $134.2 million in 2000 to $281.8 million in the trailing twelve months (TTM).
Earnings have also grown nicely during this period, increasing
steadily from $.49/share in 2000 to $1.27 in the TTM.
Free cash flow has been positive, although it has declined since 2002 when it was $57 million to $21 million in the TTM. This reduction of free cash flow is due to an increase in Capital Spending from $10 million in 2002 to $40 million in the TTM.
How about the balance sheet? Again, reviewing the same Morningstar.com page, we can see that assets, particularly
current assets handily outnumber the liabilities. In fact, FDS has $63.4 million in cash and $75.8 million in other current assets, balanced against $49.2 million in current liabilities and only $16.4 million in long-term liabilities reported.
What about "valuation" questions? As I like to do, let's review some of the numbers on
Yahoo "Key Statistics" on FDS. Here we can see that the market cap is a mid-cap $1.52 billion. The trailing p/e isn't bad at 24.83, and the forward p/e (fye 31-Aug-06) is even better at 20.47. The PEG is thus reasonable at 1.26.
What about the Price/Sales ratio? As I have discussed elsewhere, and as analyst Paul Sturm has written, one of the important valuation questions of a number like this is what the other stocks in the same industry have...in other words, is this "valuation" reasonable relative to similar stocks?
FDS has a Price/Sales ratio of 4.97. In the "Information Delivery Services" industry, this is actually a bit pricey, with DST Systems (DST) at 1.6, Proquest (PQE) at 2, Alliance Data Systems (ADS) at 2.5, and only Jupitermedia (JUPM) higher at 7.2.
Other data from Yahoo reveal that there are 48.07 million shares outstanding with 35.20 million that float. Currently there are a
lot of shares out short, actually 4.33 million as of 4/8/05, representing 12.30% of the float, or 8.625 trading days of volume. Today's upward price action might be supported by short-sellers scrambling to cover to buy back shares (?) to replace their 'pre-sold' holdings. Just a thought :).
FDS pays a small dividend of $.20/share yielding 0.69%. The last stock split, as noted above, was a 3:2 split on 2/7/05.
What does a chart look like? Looking at a
Stockcharts.com "Point & Figure" chart on FDS:
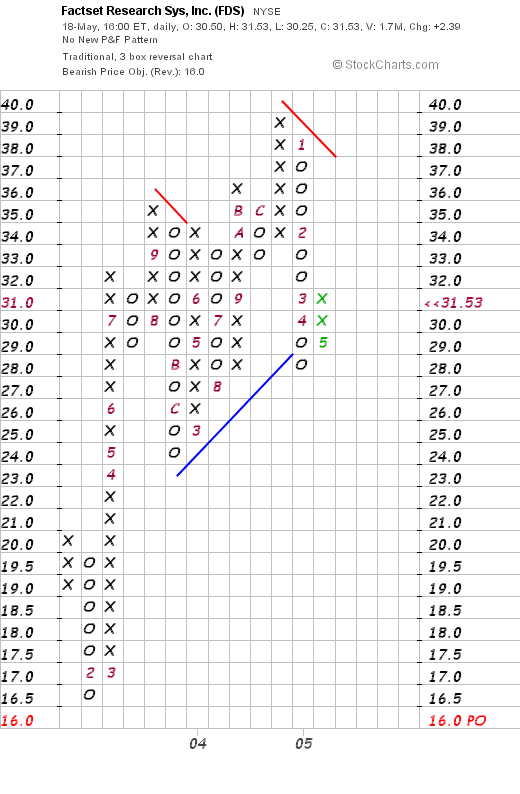
We can see that the chart actually looks pretty strong, with a move from $16.50 in February, 2003, to a peak of $39 in December, 2004. The stock recently traded lower but is now moving higher again.
What do I think about FDS? Well, I like the move today, I liked the stock two years ago, the latest quarter report was solid, the Morningstar numbers are impeccable, the valuation a la Price/Sales is a bit rich but the PEG isn't bad. The chart also looks nice to me.
I am not currently "in the market" for a new stock, although if I were, I might be nibbling on this stock.
Thanks again for stopping by! If you have any questions or comments, please feel free to email me at bobsadviceforstocks@lycos.com.
Bob
Monday, 16 May 2005
"Revisiting a Stock Pick" American Healthways (AMHC)
Hello Friends! Thanks so much for visiting my blog,
Stock Picks Bob's Advice. I have written that line so many times, that I am sure there are some of you who suspect I just say it. :) But I really
do mean it! Thank you for visiting!
I also do really mean it when I say that I am an amateur investor. I am an amateur not a professional and you really do need to check with your professional investment advisors prior to making any investment decisions based on information on this website. I am not qualified to decide whether any particular investment is a good idea for you! So please follow that advice as well!
I am now starting my third year posting here on Stock Picks! And I find it helpful to revisit some prior picks that show up in the lists of top percentage gainers.

I first
posted American Healthways (AMHC) on Stock Picks on 6/18/04 when it was trading at $24.11. I own shares of AMHC in my
"Current Trading Portfolio" and recently I introduced it to my stock club and they bought a few shares as well. The numbers are pretty compelling imho.
AMHC made the
list of top % gainers on the NASDAQ today, closing at $39.42, up $3.40 on the day or 9.44%.

According to the
Yahoo "Profile" on AMHC, American Healthways "...provides specialized comprehensive care enhancement and disease management services to health plans and hospitals in all 50 states, the District of Columbia, Puerto Rico and Guam."
What drove the stock higher today was an
announcement of an arrangement with Cigna regarding management of diabetes and congestive heart failure patients in Maryland and Washington D.C. This resulted in the
lowering of guidance for the third quarter 2005 but was viewed favorably by the "street".
On March 17, 2005, AMHC reported
2nd quarter 2005 financial results. Revenue for the second quarter ending February 28, 2005, came in at $75.3 million, a 32% increase over the $57.1 million in the same quarter the prior year. Net income climbed 59% to $8.4 million from $5.3 million the year earlier. On a diluted per share basis this came in at $.24/share up 60% from $.15/share the prior year. These were solid results!
How about longer-term? Taking a look at the
"5-Yr Restated" financials on Morningstar.com, we can see a
beautiful ramp-up of revenue from $53 million in 2000 to $283.7 million in the trailing twelve months (TTM).
Earnings have also shown an absolutely gorgeous (am I being overboard here?) progression of growth from $.01/share in 2000 to $.94 in the TTM.
Free cash flow has also been positive and growing with $10 million in 2002 growing steadily to $42 million in the TTM.
As for the balance sheet, AMHC has $35.6 million in cash, plenty to cover the current liabilities of $26.4 million and an additional $55.3 million in other current assets, easily covering the $36.9 million as well in long-term liabilities. This is solid if not spectacular.
What about valuation questions? Looking at
"Key Statistics" from Yahoo on AMHC, we can see that this is a mid-cap stock with a market capitalization of $1.3 billion. The trailing p/e
is a bit rich at 41.98, but the forward p/e at 29.86 (fye 31-Aug-06) isn't too bad at 29.86. Thus, the PEG is nice at 1.34. (5 yr expected).
Price/sales is 4.21. Using the relative valuation of the group, in this case, per Fidelity, the "Specialized Health Services" industry, we can see that AMHC
is in fact a bit pricey in here with a Price/Sales of 4.2. Other stocks include United Surgical Partners (USPI) at 2.9, Renal Care Group (RCI) at 2.1, DaVita (DVA) at 1.8, Caremark Rx (CMX) at 0.6, and Express Scripts (ESRX) at 0.5. Thus, it isn't a bargain on this particular measurement, but those numbers are
still compelling!
Going back to the Yahoo page, we can see that there are 33.17 million shares outstanding, with 31.10 million that float. Currently there are a
lot of shares out short at 6.05 million, representing 19.47% of the float (as of 4/8/05). This amounts to 6.05 trading days of volume, and if the price movement remains strong, there could be a bit of a "squeeze" on these short-sellers which would only add to the buying pressure on this stock.
The company does not pay a dividend and the last stock split reported on Yahoo was a 2:1 split on December 22, 2003.
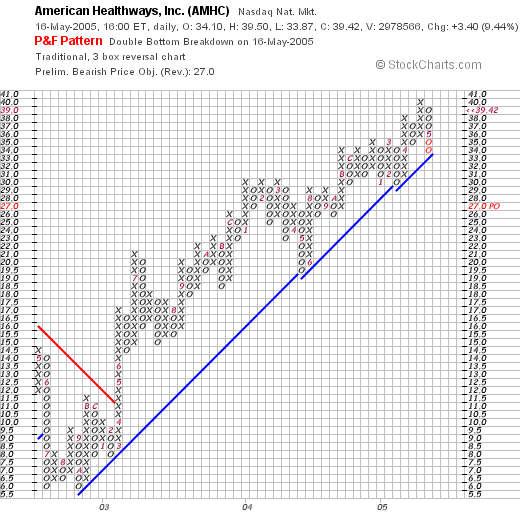
How about "technicals"? Taking a look at a
"Point & Figure" chart from Stockcharts.com, we can see that this stock has been quite strong since breaking through a resistance level in April, 2003, at around $11.00 and has traded steadily higher since. The graph looks strong to me!
Well what do I think? Well, I like this stock to own it :), so that makes me a biased observer. However, I also liked this stock before I owned it as well! The latest story about more trial management programs today is bullish, the latest quarter was extremely strong, the Morningstar.com financials are beautiful and steady, and valuation-wise, the PEG isn't too bad, the short-interest is "interesting", and the graph looks great!
On the downside, the P/E is certainly rich at its current price and the Price/Sales is also a bit rich compared to other stocks in its "industry". No bargain, but I like that Morningstar report!
Thanks so much for stopping by! If you have any questions, comments, or words of encouragement, please feel free to email me at bobsadviceforstocks@lycos.com.
Bob
Sunday, 15 May 2005
"Looking Back One Year" A review of stock picks from the week of March 22, 2004
Hello Friends! Thanks so much for stopping by and visiting my blog,
Stock Picks Bob's Advice. As always, please remember that I am an amateur investor. I am not a professional investment advisor so please consult with your professional investment advisor prior to making any decisions based on information on this website.
It is late Sunday, and I
really should have gotten this done earlier. But let me see if we can cover this quickly and get right down to business!
What I like to do on weekends, is to go back and look at prior stock picks with about a year trailing period, and see how the stocks have done since they were "selected" on this blog. This discussion assumes a buy and hold strategy which is not what I employ nor do I recommend this approach. I much rather sell my losers quickly and my winners slowly!

Red Hat (RHAT) was selected on 3/24/04 (you can go to the list of dates along the left side of the main blog, and see the original posts if you like!) at a price of $21.44. RHAT closed on 5/13/05 at $12.35 for a loss of $(9.09) or (42.4)%.
On March 31, 2005,
RHAT reported 4th quarter 2004 results. Revenue for the fourth quarter was $57.5 million, a 56% increase over the prior year, same quarter revenue. Net income came in at $11.8 million, up from $4.8 million the prior year, or on a diluted basis, up 100% to $.06/diluted share from $.03/diluted share the prior year.
On March 24, 2004, I posted Artisan Components (ARTI) at $18.88/share. ARTI was acquired by ARM holdings for $36.32/share on 12/24/04 for a gain of $17.44 or 92.4%. I had to chase down the acquisition price and that is the best I can determine from the ARM website!

Avon Products (AVP) was "picked" here on Stock Picks at $75.35/share on 3/25/04. AVP closed at $38.65/share after a 2;1 split on 6/1/04. Thus, the effective pick price was $37.68, so the stock has gained only $.97/share or 2.6%.
On May 2, 2005, AVP
reported 1st quarter 2005 results. Revenue for the quarter was up 7% to $1.88 billion. Net income grew to $172.0 million this quarter from $148.1 million the prior year. Diluted eps grew 16% to $.36/share up from $.31/share the prior year same quarter. In addition, the company raised the full year 2005 earnings outlook.

Finally, National Medical Health Card (NMHC) was selected on stock picks at $25.06 on 3/26/04. NMHC closed at $24.20 on 5/13/05, for a loss of $(.86) or (3.4)%.
On May 9, 2005, NMHC
posted 3rd quarter 2005 results. Revenue for the 2005 fiscal 3rd quarter grew to $199.3 million, up from $159.7 million the prior year. Net income was up over 100% to $3.3 million, from $1.6 million the prior year. On a diluted EPS basis, this came out to $.27/share, up from a loss of $(11.17)/share the prior year.
So how did we do during that week in March a bit over a year ago? Averaging the four stocks gives us a gain of 12.3% since posting.
Thanks again for stopping by! If you have any questions or comments, please feel free to email me at bobsadviceforstocks@lycos.com.
Bob
Saturday, 14 May 2005
A Reader Writes "Have you an opinion on NTE?"
Hello Friends! Thanks so much for stopping by and visiting my blog,
Stock Picks Bob's Advice. As always, please remember that I am an amateur investor so please consult with your professional investment advisors prior to making any investment decisions based on information on this website.
I received an email last week from Argee who had this to say:
In reading your comment on ParTech. you mentioned Nam Tai Technology (NTE)which I see is making unbelievable numbers according to Schwab.P/E 12.7, 35% projected growth '05,dividend 6.2%.Have you an opinion on NTE?
Well, first I would like to thank Argee for writing. If you have a question and would like to email me feel free to do so at bobsadviceforstocks@lycos.com. I will try to answer your questions but cannot always respond to all of the email that I receive!
Again, I am going to remind you that I am an amateur investor. Thus, I cannot predict whether investing in NTE would be a good investment or not. The price may decline in the near future, or it may be climbing, all I can do is point out whether it fits into my investing strategy! Anyhow, let's take a look at Nam Tai (NTE).

First of all, I do not own any shares or options in Nam Tai. NTE closed at $21.66, up $.27 or 1.26% on the day.
According to the
Yahoo "Profile" on NTE, Nam Tai Electronics "...is an electronics manufacturing and design services provider to original equipment manufacturers (OEMs) of telecommunications and consumer electronic products."
First, lates quarter: Nam Tai
reported 1st quarter 2005 results on May 3, 2005. Net sales climbed 64.4% to $156.9 million, from $95.4 million the prior year. Beautiful!
Net income climbed 86.9% to $13.8 million from $7.4 million last year. Gorgeous.
Diluted earnings per share were up 77.8% to $.32/share from $.18/share the prior year. Spectacular!
Thus far, I am surprised that this company has not made my list!
How about "longer-term"? Looking at the
Morningstar.com "5-Yr Restated" financials: revenue has grown nicely from $214 million in sales in 2000 to $534 million in the trailing twelve months (TTM).
Earnings which dropped from $.78/share in 2000 to $.26 in 2001, has climbed steadily since then to $1.57 in the TTM.
Free cash flow has also been positive and growing from $21 million in 2002 to $37 million. The balance sheet is solid as well with $202.6 million in cash and $132.2 million in other current assets balanced against $116.5 million in current liabilities and $38.9 million in long-term debt.
Morningstar.com report looks just fine!
How about "valuation"? Looking at
Yahoo "key statistics" on NTE, we can see that this is a mid-cap stock with a market cap of $924.12 million. The trailing p/e is cheap at 12.80, the forward p/e (?) isn't bad (I don't know why Yahoo shows it higher) at 17.06 (fye 31-Dec-06).
Price/sales is 1.53, and the PEG is 0.84, all reasonbly cheap values.
Yahoo reports 42.67 million shares outstanding with 23.50 million that float. Of these, as of 4/8/05, there were 811,000 shares out short representing 2.668 trading days or 3.45% of the float.
The company is reported to pay a dividend of $1.32 (6.09%), and last split 3:1 on 7/8/03. Hey, what is there
not to like???
What about a chart?
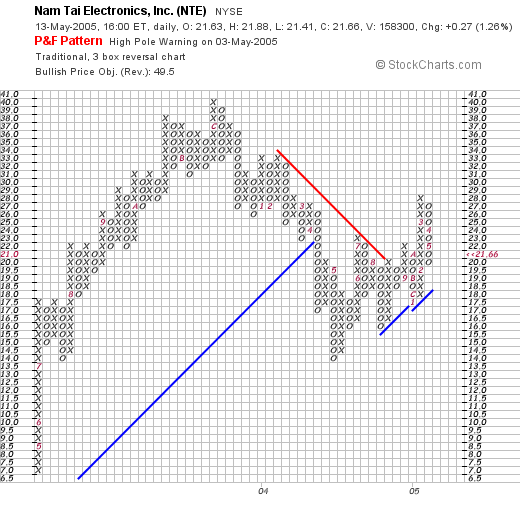
Just looking at the graph, it appears the stock broke down in late 2003 when it declined from a peak of $40 down to a low of $13.50. The stock has subsequently gotten through "resistance" at around the $21.60 level in August, 2004, and has been moving higher since. Graph, doesn't really look bad!
What do I think? Well, I hate to admit it, since I didn't pick this one :), but the latest earnings were solid, the five year track record looks nice, both in revenue and earnings growth, the free cash flow is solid, the balance sheet looks nice, valuation is reasonable, the chart looks ok, and the company even pays an above-average(!) dividend! I shall have to put this one on my watch list, and if I ever get around to buying a new position....well if the stock makes the top % gainers list....
Thanks so much for stopping by and writing! If you have any questions or comments, please feel free to email me at bobsadviceforstocks@lycos.com.
Bob
Friday, 13 May 2005
"Happy Birthday to Me!" Two Years Young!

Hello Friends! Thanks so much for stopping by and visiting my blog, Stock Picks Bob's Advice. As always, please remember that I am an amateur investor, so PLEASE remember to consult with your professional investment advisors prior to making any investment decisions based on information on this website.
It is hard to believe that I have passed the two year mark around here, starting my third year writing "Stock Picks". I hope it has been a good couple of years for you all too! I appreciate your visits, and especially your emails and comments which let me know that you are all out there reading and thinking about what I write. Of course, please never forget that I truly am an amateur! So do your own investigations and consult with your professional advisors prior to acting on what I write.
Yesterday marked the two year anniversary of Stock Picks, and I would like to share with you my first pick on Stock Picks on 5/12/03 (St Jude STJ):
May 12, 2003 St Jude Medical
This is one I picked up today. STJ is the stock symbol. I do not as I write and publish this own any shares. Am thinking about suggesting this to my stock club. Company had a great day today with a nice move on the upside. Last Quarter was good and the past five years have been steady growth. Closed at $55.30 up $2.92. So the daily momentum helped it make the list.
It is my belief, that if we can assemble portfolios of stocks that consist of companies that are growing steadily and profitably, we have an above average chance of having a profitable investing strategy.
The stocks that I write up are all stocks that I might consider buying. Of course I cannot own them all and in fact own just a small portion of the many issues that I discuss on this blog.
I also believe that some sort of portfolio management system is appropriate that lets you move more towards stocks when times are good and more towards cash when the market is retreating.
In addition, at all costs, I avoid "falling in love" with any particular stock. I sell my losing stocks quickly and my winning stocks slowly. Thus, the bias is to keep profitable stocks in the portfolio.
Does all of this work? Time will tell. In my own trading portfolio, it is not 100%, but it appears to be a profitable strategy!
I would love to hear from all of you readers as to what your own investment strategy is working, how what I write affects your own thinking, and ways that I can improve this blog. You can email me at bobsadviceforstocks@lycos.com or leave your comments right here on the website.
Thanks so much for stopping by and visiting!
Bob
Newer | Latest | Older


