Stock Picks Bob's Advice
Monday, 25 July 2005
"Revisiting a Stock Pick" Diagnostic Products (DP)
Hello Friends! Thanks so much for stopping by and visiting my blog,
Stock Picks Bob's Advice. As always, please remember that I am an amateur investor so please consult with your professional investment advisors prior to making any investment decisions based on information on this website.

Looking through the
list of top % gainers on the NYSE today, I came across Diagnostic Products (DP) which closed at $56.05, up $8.05 or 16.77% on the day! I do not own any shares of DP nor do I own any options.
I first
posted Diagnostic Products (DP) on Stock Picks on October 18, 2004, almost one year ago when it was trading at $42.18. The stock is now up $13.87 or 32.9% since posting!
According to the
Yahoo "Profile", Diagnostic Products "...engages in the development, manufacture, and marketing of immuno-diagnostic systems and immunochemistry kits worldwide, which are used in hospital, and reference and physicians' office laboratories, as well as in veterinary, forensic, and research facilities."
What drove the stock higher today was the Company announcement of
2nd quarter 2005 results. Sales jumped 14% to $125.5 million from $110.5 million last year. Earnings came in at $20.9 million or $.69/diluted share up 12% from $18.6 million or $.62/diluted share in the same quarter in 2004. This quarter came in $.03 ahead of estimates and the street responded by bidding up the price of the stock!
Taking another look at the
"5-Yr Restated" financials on Morningstar.com reveals a steady revenue growth picture from $247.9 million in 2000 to $450.0 million in the trailing twelve months (TTM).
Earnings have also grown steadily (except for a small dip in 2004) from $1.00 in 2000 to $2.08 in the TTM.
Free cash flow has been positive with $25 million reported in 2002, and $24 million reported in the TTM.
The balance sheet looks solid with $81.1 million in cash and $205.9 million in other current assets, plenty to cover both the $68.1 million in current liabilities and the $19.3 million in long-term liabilities approximately three times over.
For some numbers on this stock, we can review the
Yahoo "Key Statistics" on DP show that this company is a mid cap stock (under $3 billion in market cap and over $500 million), with a market capitalization of $1.64 billion. The trailing P/E is 26.90 with a forward P/E of 18.75 (fye 31-Dec-06). Thus, the (5 yr estimated) PEG works out to a bit over 1.0 at 1.23.
Looking at the Price/Sales ratio in the context of its industry group of "Diagnostic Substances" (per Fidelity.com), we can see that DP is very reasonable sporting a Price/Sales ratio of 3.1. At the top of the group is Human Genome Sciences (HGSI) with a P/S ratio of 579.5, Nuvelo (NUVO) at 227.4, QLT (QLTI) at 4.2, Biosite (BSTE) at 4 followed by Diagnostic Products (DP) at 3.1, and Dade Behring (DADE) at 1.9. Thus, from the measure of valuation, the stock looks cheap.
Other statistics from Yahoo show the company with 29.31 million shares outstanding with 21.7 million shares out short. This represents 4.1% of the float or 5.1 trading days of volume. This is somewhat significant relative to my own 3.0 trading days of volume for a short-ratio to be "significant" imho. The company does pay a small dividend of $.27 yielding 0.56%, and the last stock split was a 2:1 split in June, 1989.
Looking at a
"Point & Figure" chart from Stockcharts.com:
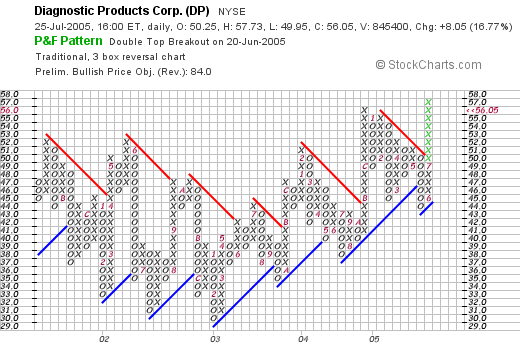
We can see that the stock was trading fairly weakly between October, 2001, when it peaked at around $52, bottoming at $30 in February, 2003, and has been trading steadily higher in a steplike fashion since that time to its current move to $57 today. The stock looks strong yet not overextended imho.
So what do I think? Well, the latest quarter looked nice, and did beat expectations. The revenue has grown steadily the past five years, however earnings have been relatively stagnant the past couple of years and it is nice to see them picking up once again. The company even pays a small dividend, the free cash flow is steady and balance sheet looks great.
Valuation-wise, the P/E is moderate with a PEG just over 1.0. The Price/Sales is very reasonable within its group and the chart looks solid and not overextended. Of course I am not in the market to buy anything, but this is a great stock to consider!
Thanks so much for stopping by and visiting! If you have any questions or comments, please feel free to email me at bobsadviceforstocks@lycos.com.
Bob
A Reader Writes: "I want to ask u some questions about BEBE."
Hello Friends! Thanks so much for stopping by and visiting my blog,
Stock Picks Bob's Advice. As always, please remember that I am an amateur investor, so please consult with your professional investment advisor prior to making any investment decisions based on information on this website.

Looking once again through my mailbox, I found that I had another question from a reader who wrote:
Hi Bob ,
I want to ask u some questions about BEBE .
I was reading ur article about bebe stores and i have some questions
for u .Do u know Bebe is using any debt what percantage of their
companys debt and equity because when i looked their balance sheet
in finance.yahoo it was written like N/A so i couldnt understand they
didnt write anything if u know anything about that can u mail me pls
cause it is important for my homework also the beta of the company is
1.75 means risky thanm they must use a debt dont u think pls reply me
as soon as possible thank u for ur helps from now . bye
Well first of all, thank you for writing and commenting on my post on BEBE. As I probably wrote then, and as I can tell you now, I don't at this time own any shares nor do I have any options on BEBE. Furthermore, I am not a financial analyst nor am I a professional advisor, but bear with me and I will share you my perspective on BEBE and their finances.
First of all I would encourage you to get familiar with Morningstar.com if you can. I do a quick financial assessment using that website that I found very easy and helpful. See if you can follow along with me.
The
Morningstar.com "5-Yr Restated" financials shows first of all that the free cash flow for BEBE is excellent. That is, BEBE had $28 million in free cash flow in 2002, $27 million in 2003, increased it to $36 million in 2004 and it has grown to $69 million in the trailing twelve months. My simple understanding of free cash flow is that this amount is the actual dollars that are either accruing to the company or being consumed by business activities. This amount
should drop down to the "cash" component of current assets if my thinking is correct. I know this is a bit of a crude assessment, but it is what I use.
Furthermore, on Morningstar, we can see that the company has $256.2 million in cash AND $53.4 million in other current assets. This is HUGE compared with the $49.8 million in current liabilities and the miniscule $28.9 million in long-term liabilities reported by Morningstar. I think their financial condition looks excellent.
As far as their "beta" is concerned, I found a nice definition
here:
Beta is a measure of a stock’s price volatility relative to the overall market. It is most often calculated using a stock's movements relative to the S&P 500 Index over the trailing 12-month period.
A stock with a beta of 1.00 will tend to move higher and lower in tandem with the S&P 500. Securities with a beta greater than 1.00 tend to be more volatile than the S&P 500, and those with betas below 1.00 tend to be less volatile than the underlying index. Securities with betas of zero generally move independently of the overall market. And finally, stocks with negative betas tend to move in the opposite direction relative to the broader market. When the S&P tumbles, stocks with negative betas will move higher, and vice versa.
Thus, the beta is nothing more than a measurement of "volatility" of a stock price. It isn't a measure of fundamental risk or have anything directly due to the debt level. It just tells you how "sedate" or how "violent" the price swings of a stock have historically been!
Please let me know if that cleared everything up. My review of the Morningstar.com page, suggests that the financial health of this company BEBE looks quite good. Of course, my information is only as good as the website, but Morningstar.com has been a very helpful investing tool for me!
If you have any other comments or questions, please feel free to email me at bobsadviceforstocks@lycos.com.
Bob
A Reader Writes, "Do you have any advice on the method of getting started?"
Hello Friends! Thanks so much for stopping by and visiting my blog,
Stock Picks Bob's Advice. As always, please remember that I am an amateur so please remember to consult with your professional investment advisors prior to making any investment decisions based on information on this website.
Checking through my mail recently, I had a nice note from Stan B. who wrote:
Bob,
I just retired from Dentistry. Am interested in setting up a portfolio that I can manage myself. Have opened an Ameritrade account & started watching some stocks. Will start with approx. 100K Do you have any advise on the method of getting started?
Thanks, Stan
First of all, I am going to remind Stan and all of you that I truly am an amateur investor and not a financial advisor, so I cannot specifically advise you on what you should buy and when, etc. However, let me once again share my thoughts on how to build a portfolio.
Any of you are welcome to share my idiosyncratic rules of trading, but I would again suggest you work with a professional investment advisor.
I would like to break down this discussion into a question of how to start, what stocks to buy, when to sell your positions, when to add new positions, and how to try to "time the market", that is, how to use your own portfolio to help you know when to be in equities and when you should be shifting into cash.
First of all, let me suggest that you define a goal of number of stocks to own in your portfolio and stick with it. For the sake of safety, for a $100,000 portfolio, let's figure on 20 stocks. I would not suggest margin, even though my own trading account is up to my ears in debt. My current goal is to pay it down in a disciplined fashion.
If you are starting out investing, you don't really know whether this is the best time to buy, the worst or somewhere between these extremes. I like to label this middle investing posture as being "neutral". So what does that mean? If your maximum is 20 positions, I would start at 50% cash and 10 positions. I would go down to a minimum of 5 positions and a maximum of 20.
However, I wouldn't rush out and pick ten positions, although that is a reasonable approach as well. I would apply my own rules for picking stocks, and slowly build up to the 10 stocks knowing you have "permission" to add new positions up to these ten. How much in each position? I wouldn't be going so much at the number of shares being the same, but rather the dollar amount being fairly equal. Thus, with $100,000 starting out, I would take $5,000 positions of each stock.
Which stocks to buy? I like to use what I call a "Zen" approach to investing. I try not to think too much :), but prefer to analyze what the market brings to my feet! In other words, I start looking at the stocks making large percentage gainers. From these, I check the latest quarterly earnings report to make sure that both revenue and earnings are growing positively. Next, I look at Morningstar.com at a "5-Yr Restated" financials to make sure that items like persistent revenue growth, earnings growth, positive free cash flow, and a healthy balance sheet is present. After this, I look at "point & figure" charts, as well as some "key statistics" from Yahoo. After a stock passes this muster, I list it in my blog. Of the stocks I list, I have purchased an actual trading portfolio of stocks.
O.K. you have gotten to ten positions, what do you do now? Here comes my own trading rules. I will sell stocks on what I believe is serious fundamental problems that might range from an SEC investigation into fraud, grossly terrible earnings or news, or anything similar. Otherwise, the key to success, imho, is to sell your losers QUICKLY and to sell your gainers SLOWLY.
This gives your entire portfolio a very aggressive posture that is optimistic and oriented to success and not failure.
On the upside, I like to sell 1/4 of a position at my own "targets" in %-appreciation. What I mean, is that if a stock appreciates 1/3, I would thus have 4/3 of value. I "sell my winnings" my selling 1/4 of my holdings at a 30% gain. I just did that today with my VIVO stock if you read my earlier post today. I repeat this at the 60%, 90%, and 120% gain levels, and YES, I have hit these sale points with some of my stocks!
Since after 4 such sales, I have essentially taken out my original investment amount, I slow down and stop punishing my successful position. That is, I go to 60% intervals: 180, 240, 300, and 360% gains. I have actually hit a 300% gain level, but have yet hit anything at 360%. After that I plan to go to 90% intervals x 4, then 120% intervals, etc.
How about on the downside? All new positions are sold as soon as I can after they have hit an 8% loss. Otherwise, if I have sold a stock once at a 30% target (like my Affymetrix (AFFX)), then I wait until the stock hits breakeven on the downside before unloading. After two or more sales at 60% or higher gain levels, I let the stock pull back to 50% of the highest gain level before unloading it. In other words, if I have sold a 1/4 position at a 60% gain, I will let a stock retrace to a 30% gain level before unloading all remaining shares.
How about the "timing the market" bit? One of my own biggest mistakes in investing is to sell a stock at an 8% loss, immediately re-invest the proceeds and go ahead and lose some more money! Thus compounding my losses!
This is again where the "Zen" approach comes in. Simply listen and watch what your own portfolio is doing and you will get a feeling for what the market is doing. This is something that I picked up from William O'Neill who in his writings always says to watch what your own stocks are doing.
But the thing I have added is sort of a "permission" to add a position. What I mean is that I use a sale at a gain as an indicator that it is safe to add a new position (up to my maximum number of positions.) When I sell a stock, I have to sit on my hands. Hopefully, in a big bear market, as some of my stocks, especially my newest purchases, hit sale points, this rule will help move my holdings into cash and I won't be replacing them unless I get down to my minimum investment position. Again, if half of a full complement is at "neutral" then the minimum would be half of that. If you have a maximum of 20 positions, you would drop down to 5 positions and then consider replacing them if they start hitting sale points.
After you get to 20 positions, and you sell at gains, then add to your cash. Consider adding position 21 if you get to a $5,000 cash position and have a buy signal. But don't add a new position until you have significant cash at least as big as an average position.
Wow, that was a long talk. I hope that was helpful. Please let me know if you have any other questions or comments. I am still working out a lot of this strategy as I am sure you can tell.
Will this work for you? I frankly don't know. It has been working for me!
Good luck and email me at bobsadviceforstocks@lycos.com if you have any questions or comments.
Bob
"Trading Transparency" VIVO
Hello Friends! Thanks so much for stopping by and visiting my blog,
Stock Picks Bob's Advice. As always, please remember that I am an amateur investor, so PLEASE consult with your professional investment advisors to make sure that all of your investment decisions are appropriate, timely, and likely to be profitable for you!

I have been away from my computer for a few days...and thus, have a few things I need to catch up on. First of all, checking my trading portfolio today, I noticed that my Meridian Bioscience (VIVO) had hit a first sale point (it is currently trading at $22.95, up $.885 or 4.00% on the day). Earlier today, I sold 100 shares of my 400 share position (a 1/4 of my shares) at $22.77. These shares were acquired on 4/21/05 (a little over three months ago!), at a cost basis of $16.67/share. Thus, I had a gain of $6.10/share or 36.6% on my original purchase price.
As you may recall, I like to sell my gaining shares slowly at targeted gains of 30%, 60%, 90%, 120%, 180%...etc. I try to sell about a 1/4 position each time of the remaining shares to allow my original investment amount to remain fairly intact. Sort of selling my "winnings" I guess you could say!
Anyhow, since I am at my goal of 25 positions, I shall be applying this sale to my margin which still remains hefty. If I had been under 25 positions, I would otherwise be using this sale as a signal to add a new position to my portfolio!
Thanks so much for stopping by. I know I have a couple of emails that I shall be answering here in a bit...but I am back at it here on the blog. If you have any comments or questions, please feel free to email me at bobsadviceforstocks@lycos.com.
Bob
Wednesday, 20 July 2005
"Trading Transparency" St. Jude Medical (STJ)
Hello Friends! Thanks so much for stopping by and visiting my blog,
Stock Picks Bob's Advice. As always, please remember that I am an amateur investor, so please consult with your professional investment advisors prior to making any investment decisions based on information on this website.

One thing I try very hard around here to accomplish is to share with you actual trades in my very real
"Trading Portfolio". I choose from the stocks that I have discussed and use the same rules to pick these holdings as I do when I review stocks on this blog.
As I have pointed out elsewhere, I have some very disciplined trading rules that I have established for my holdings. First of all I have selling rules on the downside. Let me review if you are not familiar: all stocks subject to sale at an 8% loss after first purchase. If I have sold a portion of a stock once at a 30% gain target, then I sell the remaining shares if the stock retraces back to "break-even". Otherwise, I sell all of the other stocks at 50% of their highest targeted gain-sale point. That is if I sold a portion at 60% gain, then I would allow it to retrace to a 30% gain level before unloading the issue.
On the upside, I sell 1/4 of my position at 30, 60, 90, 120% points, then increase by 60%: 180, 240, 300, and 360% target, then increase by 90%: 450%,....etc.
Going back to the subject at hand, I acquired my shares of St. Jude Medical (STJ) on 10/15/03 at a cost basis of $28.90/share. I made my first sale on 1/28/04, selling 30 shares at $69.84 (out of an original holding of 150 shares). The stock subsequently split, and with 240 shares, I have now hit a 60% gain level (my second targeted sale point), and have just a few moments ago sold 60 shares at $46.72, with a gain of $17.82/share or a 61.7% gain. Thus, my next sale will be at a target of either 90% on the upside or 30% gain on the downside.
What drove the stock higher today was an announcement just prior to the opening of
2nd quarter 2005 results which beat the street by $.02. In addition, guidance was raised for the 3rd quarter of 2005. Sales for the quarter ended June 30, 2005 came in at $724 million, a 30% increase over the prior year's same quarter. Net earnings for the quarter excluding non-recurring items (including them the result was flat at $.27), came in at $.38/diluted share, a 41% increase over the $.27/share reported the prior year.
Anyhow, things look solid for STJ and the stock as I write this note is trading at $46.70, up $2.95 or 6.74% on the day!
Regarding my own portfolio management, since I am up to 25 positions, I will not be adding a new position as a sale at a gain allows, and instead shall continue to work on paying down my sizeable margin level. Otherwise, if I sell one of my 25 on bad news, then that would open up a slot and a future sale at a gain would once again allow me to add positions up to my goal of 25.
Thanks again for stopping by! If you have any questions, comments, or words of encouragement, please feel free to email me at bobsadviceforstocks@lycos.com. Please be aware that I shall probably use your question in the blog itself! Regards to all.
Bob
Tuesday, 19 July 2005
July 19, 2005 CDW Corp (CDWC)
Hello Friends! Thanks so much for stopping by and visiting my blog,
Stock Picks Bob's Advice. As always, please remember that I am an amateur investor. That doesn't mean that what I write isn't informative! It just means that when you read what I write, if you like what you read, you STILL should check with a professional investment advisor to make sure that all information discussed is appropriate, timely, and likely to be profitable for you!
The market had a nice day today with the Dow closing at 10,646.56, up 71.57, and the NASDAQ closing at 2,173.18, up 28.31 on the day. I thought I might stop with just one post today, but curiosity got the better of me and I went back to those lists of top % gainers and found another candidate to discuss.
CDW Corp (CDWC) closed at $61.98, up $5.39 or 9.52% on the day. I do not own any shares of this stock, nor do I own any options.
According to the
Yahoo "Profile" on CDWC, the company "...and its subsidiaries engage in the direct marketing of multibrand computers, and related technology products and services in the United States." I know about CDW from receiving their catalogs in the mail!
What drove the stock higher today was the
announcement of 2nd quarter 2005 results. For the quarter ended June 30, 2005, sales climbed 11.3% to $1.54 billion from $1.38 billion in the same period last year. Net income was $67.1 million, up 15.1% from $58.3 million last year. Diluted earnings per share jumped 19.4% to $.80/share from $.67 in the second quarter last year.

Taking a look at the
Morningstar.com "5-Yr Restated" financials on CDWC, we can see a very steady growth in revenue from $3.8 billion in 2000 to $5.9 billion in the trailing twelve months (TTM).
Earnings have been steadily growing, except for a small dip after 2002 when they dropped to $2.03 from $2.10, but otherwise resumed their upward trend with $2.88 reported in the TTM.
As an added plus, the company started paying dividends with $.30 reported in 2003, and $.36 in the TTM.
Free cash flow has been solid with $221 million in 2002, and $187 million in the TTM.
Morningstar.com shows that the balance sheet is also quite attractive with $590.2 million in cash, more than enough to cover the $401.7 million in current liabilities. Interestingly, long-term liabilities are reported at -0-. In addition, the company has almost $1 billion other current assets, actually $823.1 million as reported on the page.
Looking at
Yahoo "Key Statistics" on CDWC, we can see that this is a large cap stock with a market capitalization of $5.05 billion. The trailing P/E appears reasonable at 21.55 (although the growth rate isn't that high it is still in the teens), the forward (fye 31-Dec-06) P/E is 17.76, and the PEG (5 yr expected) is a reasonable 1.03.
According to Fidelity, CDWC is priced reasonably on a Price/Sales ratio relative to other constituents of the "Computers Wholesale" industrial group. This group is topped off by Electronics for Imaging (EFII) with a Price/Sales of 3.2, Palm (PALM) at 1.1, CDWC at 0.8, Ingram Micro (IM) at 0.1, and Tech Data (TECD) also at 0.1.
Other facts from Yahoo include the shares outstanding at 81.54 million with 63.42 million that float. Currently there are 3.97 million shares out short, equivalent to 6.30% of the float, or 4.8 trading days of volume. This is above my 3 day significance level and may be a bit of a squeeze on the shorts with this release of good news.
Yahoo does show that the $.43/share dividend is yielding 0.76%, and the last stock split was a 2:1 in June, 2000.
Looking at a
"Point & Figure" chart from Stockcharts.com on CDWC:
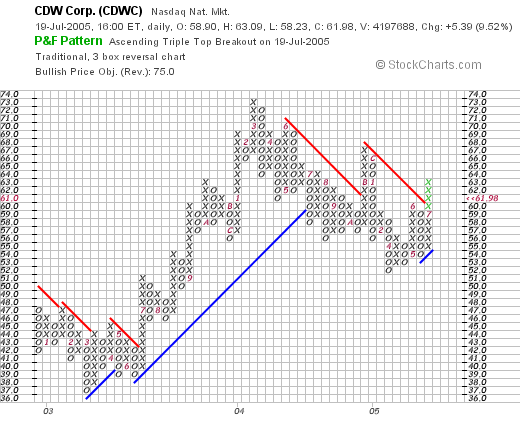
the chart appears to show a strong move between March, 2003, when the stock bottomed at around $37, to a peak at $73 in March, 2004. Since then the stock has pulled back to $52 in April, 2005, but is now breaking through resistance at the $63 level, and looks to be heading higher, at least over the short time. The chart, imho, looks mildly bullish but certainly not overextended. I would like to see the stock stay above the $55 level on its next pullback and move to higher short-term highs.
So what do I think? The stock did make a nice move higher today on what appears to be a solid earnings report. The rate of growth is probably sustainable imho, the record the past five years looks nice with a steady picture of revenue growth and an almost uninterrupted picture of earnings growth. For the "icing on the cake" the company has initiated and is increasing its dividend!
Free cash flow is strong, and the balance sheet looks nice with the cash on hand able to pay off all of the current liabilities; the company does not have any long-term liabilities per Morningstar. Valuation also looks nice with a moderate P/E in the low 20's and a PEG just barely over 1.0. The Price/Sales ratio is moderate and reasonable in the industrial group that CDWC finds itself. Finally, the chart looks at least short-term bullish imho. Certainly not over-extended, but maybe not yet convincingly on an upturn. In addition, there are a lot of shorts out there that will need to cover by buying back shares. All in all, the picture looks promising to me. Of course, I am now at 25 positions, and am not in the market to buy anything.
Thanks so much for stopping by! If you have any questions or comments, please feel free to leave them on the blog or email me at bobsadviceforstocks@lycos.com.
Bob
Posted by bobsadviceforstocks at 10:23 PM CDT
|
Post Comment |
Permalink
Updated: Tuesday, 19 July 2005 10:29 PM CDT
July 19, 2005 FileNet (FILE)
Hello Friends! Thanks so much for stopping by and visiting my blog,
Stock Picks Bob's Advice. As always, please remember that I am an amateur investor, so please consult with your professional investment advisors prior to making any investment decisions based on information on this website.

The market is moving higher today which always makes me optimistic about finding the kind of stocks that I like to write about on this website! For any newbies around here, my first step in identifying a prospect for this website is to scan the top % gainers list. These are often stocks with some news that exceeds expectations.
This morning, while looking through the list of
top % gainers on the NASDAQ, I came across FileNet (FILE) which as I write is trading at $29.97, up $2.71 or 9.94% on the day. I do not own any shares nor do I have any options in this stock.
According to the
Yahoo "Profile" on FileNet, the company "...engages in the development, marketing, sale, and support of a software platform and application develoopment framework for enterprise content management (ECM) and business process management (BPM) worldwide."
Anyhow, what drove the stock higher today was the
2nd quarter 2005 earnings report released before the open of trading today. For the quarter ended June 30, 2005, revenue came in at $104.6 million, compared with revenue of $94.1 million, an 11.1% increase. Net income was $8.7 million in the quarter, up 295% from $2.2 million the prior year and up sequentially from $8.3 million in the prior quarter. Per diluted share this came in at $.21, up 320% from $.05/diluted share in the prior year and up 5% from the $.20 in the prior quarter. Overall, the street liked what it saw, and bid up the stock price rapidly!
Longer-term, looking at the
"5-Yr Restated" financials from Morningstar.com, we can see that the company did have a difficult year in 2001, when revenue dropped from $400.4 million to $334.6 million, and earnings dropped from $1.05/share to a loss of $(.47)/share. However, since that time, both revenue and earnings have steadily been growing to the $398.1 million in revenue in the trailing twelve months (TTM) and $.82/share in earnings in the TTM.
Free cash flow has also been growing the last several years from $11 million in 2002 to $55 million in the TTM.
The balance sheet reflects this solid free cash flow performance with $365.8 million in cash reported by Morningstar, enough to cover both the $142.8 million in current liabilities AND the $4.8 million in long-term liabilities more than two times over. In addition, Morningstar reports that FILE has $56.6 million in other current assets. This is a very pretty balance sheet!
Looking at
Yahoo "Key Statistics" on FILE, we can see that this is a mid cap stock with a market capitalization of $1.19 billion. The trailing P/E is a bit rich at 35.46, and the forward P/E (fye 31-Dec-06) is a bit better at 29.87. However, the PEG isn't cheap at 1.67.
Looking at the Price/Sales ratio in terms of its relative valuation within its industrial group of "Business Software & Svcs", we see that FILE is placed midway with BEA Systems (BEAS) topping out at 3.2 Price/Sales, First Data (FDC) at 3.0, FILE at 2.8, Business Objects (BOBJ) at 2.7, Automatic Data Processsing (ADP at 2.6 and Fiserv (FISV) at 2.3. Thus, the stock appears to be reasonable valued by this particular parameter.
Other statistics on Yahoo show that there are 40.94 million shares outstanding with 40.75 million that float. Currently there are 2.54 million shares out short, representing 6.20% of the float or 5.8 trading days. Using my own 3 day rule on short interest, this
is significant, and with the good earnings report, we might be witnessing a bit of a squeeze on the shorts.
Yahoo does not report any cash dividends and the last stock split was a 2:1 split in June, 1998.
Looking at a
"Point & Figure" chart from Stockcharts.com on FILE:
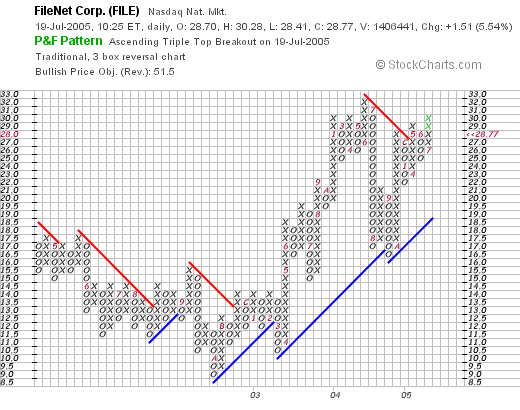
We can see that this stock was trading lower beween May, 2002, when it was in the $18.00 range, to a low of $9.00 in October, 2002. Since then, the stock has been trading fairly steadily higher to its current level of $28.67 (as I write.)
So what do I think? Let me review, the stock has moved higher today on a strong earnings report. FILE has been growing steadily the last 3-4 years, is generating lots of free cash and has a great balance sheet. Valuation is a bit steep in terms of P/E and PEG, but the Price/Sales is moderate within its "group". Finally, the chart looks strong but not over-extended. I do suspect as I look at the intra-day chart on FILE, that the initial euphoria on the earnings report might have gotten a bit overdone, but the picture remains strong, and this does not appear to be a "one day event".
Thanks so much for stopping by! If you have any comments or questions, please feel free to leave them on the blog or email me at bobsadviceforstocks@lycos.com.
Bob
Monday, 18 July 2005
July 18, 2005 Charles & Colvard (CTHR)
Hello Friends! Thanks so much for stopping by and visiting my blog,
Stock Picks Bob's Advice. As always, please remember that I am an amateur investor so please consult with your professional investment advisors prior to making any investment decisions based on information on this website.

I was looking through the
list of top % gainers on the NASDAQ this morning and came across Charles & Colvard Ltd (CTHR). I do not own any shares nor do I have any options in this company.
CTHR is having a great day in the face of an otherwise negative market; trading at $27.87, up $1.93 or 7.44% on the day as I write.
What is moving the stock higher today is a company
report that earnings will be released tomorrow (7/19/05) and an earlier
press release that upped guidance for sales.

According to the
Yahoo "Profile" on CTHR, the company "...engages in the manufacture, marketing, distribution, and sale of moissanite jewels. It sells moissanite (also known by its chemical name, silicon carbide) jewels principally in the United States and Canada."
CTHR reported
1st quarter 2005 results on April 18, 2005. For the first quarter ended March 31, 2005, CTHR reported a 100% increase in sales to $11.2 million from $5.6 million the prior year same quarter. Net income came in at $2.01 million or $.14/diluted share, a 262% increase over the last year's $555,000 or net income or $.04/diluted share.
Examining the
"5-Yr Restated" financials on Morningstar.com for CTHR, we can see that revenue did drop slightly from $12.8 million in 2000 to $11.5 million in 2001, but has rather rapidly expanded to the $29.5 million reported in the trailing twelve months (TTM).
Earnings per share have also been a bit erratic, increasing from $(.94)/share in 2000 to $.66/share in 2002. However, this was followed by a drop to $.08/share in 2003, and subsequent increases from that level.
Free cash flow has been flat with $3 million reported in 2002, dropping to $0 in the TTM.
According to Morningstar.com, the balance sheet is impeccable, with $13.5 million in cash alone, enough to cover the $3.0 million in liabilities more than four times over! There are NO long-term liabilities reported. In addition, CTHR has $34.9 million in other current assets.
Taking a look at
Yahoo "Key Statistics" on CTHR, we can see that this is a small cap stock with a market capitalization of only $403.44 million. No P/E is reported and thus no PEG ratio either.
Reviewing the Price/Sales ratio with data from
Fidelity, in the "Recreational Goods, Other" industrial group, we have CTHR at the top with a Price/Sales of 12.7. This is followed far back by RC2 Corp (RCRC) at 1.9, Fossil (FOSL) at 1.7, Orange 21 (ORNG) at 1.3, Movado (MOV) at 1.1, and LJ International (JADE) at 0.4. Thus, the stock is a bit pricey on this particular parameter.
Looking at other statistics on CTHR, we find that there are 14.39 million shares outstanding with 10.69 million shares that float. Of these, there are 604,430 shares out short representing 5.10% of the float or 4.5 trading days of volume, which will just be adding some buying pressure on this already strong stock.
The company
does pay a small dividend of $.05/share yielding 0.19%. No stock dividends are reported on Yahoo.
Taking a look at the
"Point & Figure" chart on CTHR from Stockcharts.com:
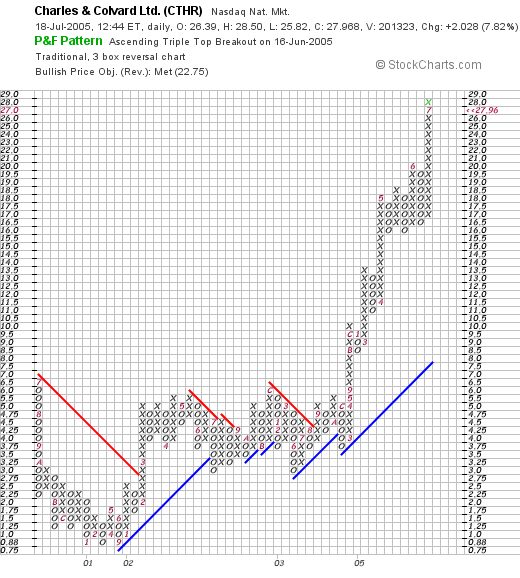
we can see that this stock was trading sideways between 2001 through August, 2003, when it broke through "resistance" at $4.50 and has moved strongly higher since then. This is a strong chart, albeit a bit overextended imho.
So what do I think? Well this is a very small company and I cannot tell what the potential is for synthetic jewels. However, the last quarter was strong, the company is raising guidance, the balance sheet is impeccable, revenue has been growing steadily, and the chart looks strong.
Valuation is a bit questionable, but this is often the case in stocks that move strongly!
Thanks so much for stopping by and visiting my blog! Be sure to email me or leave your comments right here if you have any!
Bob
Sunday, 17 July 2005
"Looking Back One Year" A review of stock picks from the week of May 24, 2004

Hello Friends! Thanks so much for stopping by and visiting my blog,
Stock Picks Bob's Advice. As always, please remember that I am truly an amateur investor so PLEASE consult with your professional investment advisors prior to acting on any information on this website!
If you are new to this blog, well "Welcome!" and please make yourself at home. I have lots of stocks that I have taken a look at you are welcome to my thoughts. If you have any questions or comments, please feel free to email me at bobsadviceforstocks@lycos.com and I will try to get back to you.
One of the things I like to do on this blog is to review my past "picks" and see how they have done over the year since posting. These analyses assume a buy and hold approach that I do not in fact employ in practice. I believe in selling losing stocks quickly and gaining stocks slowly. I use an approximately 56 week trailing period for review and each week review the next week of selections.

On May 24, 2004, I
posted PetMed Express (PETS) on Stock Picks at a price of $7.36. PETS closed at $8.07 on 7/15/05, for a gain of $.71 or 9.6% since posting.

On May 16, 2005, PETS
announced 4th quarter 2005 results. For the quarter ended March 31, 2005, net sales increased 10% to $23.5 million, from $21.5 million in the prior year same quarter. Net income came in at $2.4 million or $.10/diluted share, up 67% from $1.3 million or $.06/diluted share.

On May 25, 2004, I
posted Coldwater Creek (CWTR) on Stock Picks at a price of $25.40. CWTR has been a VERY strong stock since posting and has had TWO 3:2 stock splits: the first on 7/26/04, and the second on 3/21/05, since posting. This makes our effective stock pick price actually $11.29/share. CWTR closed at $23.70 on 7/15/05, giving me a gain of $12.41 or 110% since posting!
On May 25, 2005, CWTR
reported 1st quarter 2005 results. Net sales increased 25% for the quarter ended April 30, 2005, from $124.5 million in the same quarter last year. Net income increased 60% to $3.2 million or $.14/diluted share up from $5.3 million or $.09/diluted share the prior year same quarter.

On May 26, 2004, I
posted Copart (CPRT) on Stock Picks at $23.02. CPRT closed at $24.83, for a gain of $1.81 or 7.9%.
On June 1, 2005, CPRT
announced 3rd quarter 2005 results. For the quarter ended April 30, 2005, revenues increased 12% to $130.4 million from $116.6 million the prior year. Earnings grew 24% to $30.9 million or $.33/diluted share, up from $25.0 million or $.27/diluted share last year.

The last stock pick that week was Wendy's (WEN) which I
posted on Stock Picks on May 28, 2004 at a price of $37.43. WEN closed at $45.88 on 7/15/05 for a gain of $8.45 or 22.6% since posting.

Because of the
"finger in the chili" case scandal, sales at Wendy's restaurants were adversely affected, and sales grew during the
1st quarter 2005, results of which were posted on 4/28/05. Revenue grew 7.1% to $894 million. Earnings, however, were flat at $.45, compared with $.45/share a year ago.
So overall, this was another great week for Stock Picks! All four stocks discussed that week had nice gains ranging from a 7.9% gain for Copart to a 110% gain for Coldwater Creek. The average performance of all four stocks "picked" that week works out to a gain of 37.5%.
Thanks so much for visiting here! Please remember that past performance is NO guarantee of future performance, that I am truly an amateur and that you should check with your professional investment advisors, and always do homework on all stock market ideas yourself prior to investing!
Have a great week trading everyone!
Bob
Posted by bobsadviceforstocks at 5:04 PM CDT
|
Post Comment |
Permalink
Updated: Tuesday, 22 November 2005 6:17 AM CST
Friday, 15 July 2005
July 15, 2005 Cintas (CTAS)
Hello Friends! Thanks so much for stopping by and visiting my blog,
Stock Picks Bob's Advice. As ALWAYS, please remember that I am an amateur investor, so please consult with your professional investment advisors prior to making any investment decisions based on information on this website.

The first place I go to find a new stock pick is the top % gainers list. I use the Cnn.money site, but the USA Today site, or other internet sources are certainly workable. This afternoon, looking through the
list of top % gainers on the NASDAQ, I came across Cintas (CTAS) which closed at $44.00, up $4.20 or 10.55% on the day. I do not own any shares or options in this company.

According to the
Yahoo "Profile" on CTAS, this company "...engages in the manufacture and provision of corporate identity uniform programs, entrance mats, restroom supplies, promotional products, first aid and safety products and services, and document management services."
What drove the stock higher today, was the
4th quarter 2005 earnings report which was released after the close of trading yesterday. For the quarter ended May 31, 2005, revenue climbed 9.6% to $809.2 million, and earnings jumped 14% to $83 million or $.48/share from $72.7 million, or $.42/share in the 4th quarter of 2004. The company also guided revenue estimates for the upcoming year slightly higher.
Looking a bit longer-term, reviewing the
"5-Yr Restated" financials for CTAS on Morningstar.com, we can see a very steady improvement in revenue, with growth from $1.9 billion in 2000 to $3.0 billion in the trailing twelve months (TTM).
Earnings have also progressed in a remarkably steady fashion from $1.14 in 2000 to $1.68 in the TTM.
As a BONUS, the company also has been steadily increasing its DIVIDEND...raising it each year from $.19/share in 2000 to $.32 in the TTM.
Free cash flow has also been solid with $270 million in 2002 reported, increasing to $309 million in the TTM.
Looking at the balance sheet, we can see that CTAS has $367.8 million in cash according to Morningstar.com, and $824.5 million in other current assets. This is plenty to cover both the $385.4 million in current liabilities and the $385.4 million in long-term liabilities combined.
Reviewing
"Key Statistics" from Yahoo on CTAS, we can see that this is a large cap stock with a market capitalization of $7.57 billion. The trailing p/e isn't bad at 26.17, with a forwar p/e (fye 31-May-06) at 19.47. thus, the PEG is just a bit over 1.0 at 1.25.
Looking at the Price/Sales ratio in the context of a
Paul Sturm perspective, that is in the context of other companies in the same "industry group", we can see that Cintas is fairly reasonably valued as well. Cintas is in the "Business Services" group per Fidelity, and the steepest Price/Sales ratio in that group is Equifax (EFX) at 3.7 Price/Sales, Global Payment (GPN) at 3.3, Cintas (CTAS) at 2.3, Certegy (CEY) at 2.2, and IPAYMENT (IPMT) at 1.4. Thus, CTAS is in the middle of this group in regards to this particular valuation parameter.
Other "numbers" from Yahoo, show that there are 172.09 million shares outstanding with 140.68 million that float. As of 6/10/05, there were 5.29 million shares out short, up slightly from the prior month. This represents 3.70% of the float, or a significant (imho) 6.7 trading days of volume.
The company, as noted, does pay a small dividend of $.32/share yielding 0.80%. The last stock split was a 3:2 split in March, 2000, per Yahoo.
What about a chart? Taking a look at the
"Point & Figure" CTAS chart from Stockcharts.com:
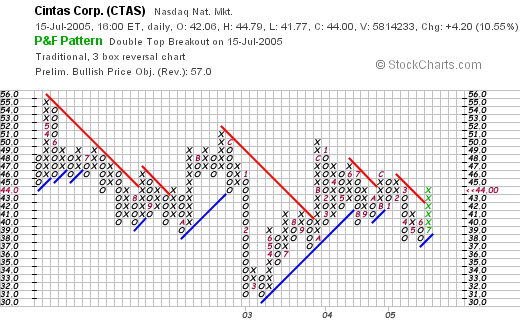
I see what looks like a long-term declining trend in stock price from $56, all the way back in May, 2002, to the $44 level where it closed today. What concerns me is what appears to be a series of declining highs, but the recent move breaking through a resistance level is moderately encouraging. Certainly the stock chart is not ahead of itself, and I wouldn't call this one over-extended. Yet the question remains whether this shows any significant upward momentum at all!
So in summary, the stock moved higher today on a positive earnings report and guidance yesterday. Other positives include the steady growth in revenue the past five years, the steady growth in earnings, and even the growth in dividends each and every year! Free cash flow is solidly positive and the balance sheet looks healthy. Valuation numbers are reasonable and there are even a lot of shares out short that need to be covered. In fact, my only particular concern is the less-than-convincing point and figure graph. But over the short-term, the chart does show the stock breaking past resistance levels....but can is sustain this advance?
In any case, I don't have any cash or a market signal to be investing! Thanks again for stopping by. I hope you all have a wonderful weekend. As always, please feel free to leave comments right here on the blog or feel free to email me at bobsadviceforstocks@lycos.com.
Bob
Newer | Latest | Older


