Stock Picks Bob's Advice
Saturday, 20 August 2005
"Looking Back One Year" A review of stock picks from the week of June 21, 2004

Hello Friends! Thanks so much for stopping by and visiting my blog,
Stock Picks Bob's Advice. As always, please remember that I am an amateur investor, so please consult with your professional investment advisors prior to making any investment decisions based on information on this website.
One of the things I like to do on this website is to look back on prior picks in a somewhat systematic fashion, and find out how they did after a year. Currently, I am up to the week of June 21, 2004, which is almost 60 weeks out, so we are looking back on stock picks from a bit over a year ago. If you would like to browse through past stock picks, you can on the blog where I have links along the left side of the page to previous picks grouped by date.
The review of past picks on these pages assumes a buy and hold strategy. That is, if I had purchased an equal dollar amount of the stocks discussed, 'what would have happened to that investment?' In reality, I have purchased only a small fraction of stocks discussed and share with the readers all of my transactions in my trading account. Furthermore, I do not ever 'buy and hold' anymore! I sell my losing stocks quickly, and sell my gaining stocks gradually at specified targeted prices. Someday, I shall have to integrate that strategy into these reviews....but for now, I shall do the best I can with a presumed 'buy and hold' review.

On June 21, 2004, I
posted Amedisys (AMED) on Stock Picks at a price of $30.74. AMED closed at $42.67 on 8/19/05, for a gain of $11.93 or 38.8%.

On August 2, 2005, AMED
reported 2nd quarter 2005 results. Net service revenue for the quarter ended June 30, 2005, increased 41% to $80.1 million from $56.9 million the prior year. Net income came in at $7.9 million or $.50/diluted share, up from $5.0 million or $.39/diluted share in the 2004 same period. The average number of shares outstanding
did increase to 15.8 million in 2005, compared with 12.8 million shares the prior year.

On June 23, 2004, I
posted NVE Corp (NVEC) on Stock Picks at a price of $36.61. NVEC closed at $14.97 on 8/19/05, for a loss of ($21.64) or (59.1%). Clearly, I do
not bat 1.000 on these stock picks!

On July 20, 2005, NVEC
reported 1st quarter 2006 results. Total revenue for the quarter ended June 30, 2005, came in at $3.03 million for the quarter compared with $2.89 million for the same quarter a year ago. Net income for the quarter worked out after "the effect of a non-cash provision for income taxes", to be $412,649 or $.09/diluted share, down from $483,671 or $.10/diluted share the prior year.

On June 24, 2004, I
posted Cohesant Technologies (COHT) on Stock Picks at a price of $10.06. On August 19, 2005, COHT closed at $9.30, for a loss of ($.76) or (7.6%).
On June 16, 2005, COHT
reported 2nd quarter 2005 results. Net sales climbed 7.8% to $5.7 million from $5.3 million the prior year same period. However, net income for the quarter came in at $406,986, down 23.1% from the $529,153 reported the previous year. On a fully diluted per share basis this came in at $.15/share in the current quarter, down from $.31/share the prior year same period.
So how did we do in the year interval since the postings? In a word, "awful". Averaging the three 'stock picks' we can see that I had one pick with a nice gain, but the other two came in at losses. In fact, the average performance of these three stocks came in at (9.3)%.
You can see that I
don't always have a great week in reviewing past stocks! Thanks so much for stopping by and visiting my blog. If you have any comments or questions, please feel free to leave them here on the blog or email me at bobsadviceforstocks@lycos.com.
Bob
Friday, 19 August 2005
August 19, 2005 LaBarge (LB)
Hello Friends! Thanks so much for stopping by and visiting my blog,
Stock Picks Bob's Advice. As always, please remember that I am an amateur investor and you should always consult with a professional investment advisor before making any investment decisions based on information on this website.
I received a nice email recently from a reader named Willy, who I believe is from Belgium (Willy please correct me if I am wrong!), and who inquired about my stock picking "techniques". With that in mind, let me try to explain my rationale with this stock pick today.
Some years back, during the go-go years of the internet stock boom, I noticed that stocks that were making large moves, as recorded on the top % gainers lists available in multiple places, often went on to make substantial gains.
Thus, I spend a lot of time in an initial search for stocks by scanning the list of top gainers. Today, I found a prospect on the
AMEX list of top % gainers. (Another of my "picks" American Vanguard (AVD) is also on the list but I have already reviewed this stock on this blog
here on December 29, 2003 and
here on May 31, 2005).
So, on the 'look-out' for something that I
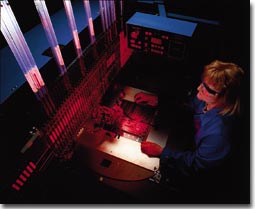
hadn't reviewed, I came across LaBarge, Inc. (LB) which closed today at $15.91, up $1.19 or 8.08% on the day. I do
not own any shares nor do I have any options on this stock.
I am a big user of the
Yahoo Finance website, and looking at the
Yahoo "Profile" on LaBarge, we can see that LB "...engages in the design, engineering, and production of electronic systems and devices, and interconnect systems on a contract basis in the United States. It manufactures printed circuit card assemblies, cables and harnesses, box-build assemblies, and electronic/electromechanical systems."
My next step was to find the latest quarterly report. Usually, this is easily found on Yahoo in the "Headlines" section, but sometimes, with the smaller companies, it is easier to locate the information on the company website.
On April 28, 2005, LaBarge
reported 3rd quarter 2005 results. Net sales for the third quarter ended April 3, 2005, rose 41% to $44.8 million, compared with $31.8 million the prior year. Net earnings increased 77% to $3.0 million or $.19/diluted share, compared with $1.7 million, or $.11/diluted share in the same quarter a year ago!
My next stop in a review of a stock for possible inclusion here is to take a bit of a longer-term view using
Morningstar. In particular, I like the
"5-Yr Restated" financials.
First of all, looking at the sales numbers, we can see that revenue has been climbing, slightly irregularly but growing from $79.6 million in 2000 to $178.1 million in the trailing twelve months (TTM).

Although I prefer to see consistency, it is not uncommon to find some fluctuations in all the numbers in these small companies. Overall the trend is still positive. Taking a look at the earnings numbers, we find (continuing operations) that earnings per share improved from a loss of $(.11)/share in 2000 to $.69/share in the TTM.
Free cash flow is also small but positive with $4 million reported in 2002, and $3 million in the TTM.
The balance sheet, as represented on Morningstar, looks good with $600,000 in cash and $68.2 million in other current assets, balanced against $42 million in current liabilities and $27.9 million in long-term debt. I prefer to see a larger multiple of assets over liabilities, but the excess of current assets over current liabilities is still about 1.5, and with the positive free cash flow, this appears just fine imho.
Generally, my next step in looking at a stock is to review the "key statistics". These are numbers that give us a feel for what may be called "valuation". Things like price/earnings, price/sales, PEG (price/earnings compared to the growth rate), and the like. The lower all of these parameters are, the better the "value" the stock represents.
For this purpose, I again return to Yahoo and look at the page on
"Key Statistics". Here we can see that this is a very small company, a "small cap" stock with a market capitalization of only $239.29 million.
The price/earnings ratio is very reasonable at 23.92 (imho), the forward p/e (fye 27-Jun-06) is reported at 19.40, even a nicer number. Thus, the PEG ratio (5 yr expected) is under 1.0 at 0.97. For GARP (Growth At a Reasonable Price) investors, PEGS at or under 1.0 are considered reasonable and a good value.
For the Price/Sales ratio, I have taken to look at Fidelity Brokerage for their research. One of the things I like to do with the Price/Sales ratio is
not to take it out of context but to view this number in relation to other similar stocks, stocks that are in the same Industry Group. This is something I have picked up from
Paul Sturm from SmartMoney.com.
In this particular group, "Scientific/Tech Instruments", we find that LaBarge is very reasonably valued with a price/sales ratio of 1.2. In fact, Garmin (GRMN) tops the list at 6.8, followed by Flir (FLIR) at 4.6, Agilent (A) at 2.1, Fisher Scientific (FSH) at 1.5 and Beckman Coulter (BEC) at 1.4. The stock appears to be a great value by this particular parameter as well!
Jumping back to Yahoo for some other numbers, we find that the company has only 15.04 million shares outstanding with 10.68 million that float. As of 7/12/05, there were 249,970 shares out short, representing 2.90% of the float or 1.3 trading days of volume (the "short ratio"). I have personally chosen three days of short interest to cover these "pre-sold" shares of speculators betting against the stock, as a level of significance. Thus, the short sales don't appear to be very large.
Yahoo reports no stock dividend and no cash dividend on this company.
Finally, I like to take a look at the chart and share this with my readers. I have for the last few years started getting very comfortable with "point & figure" charts that display the tides of the stock price with the columns of 'x's' indicating a rising price, battling against the columns of 'o's' which represent a declining stock price. The 45 degree lines super-imposed on the chart represent "support" lines if they are moving higher, and "resistance" lines if they are moving lower. Trends that stay above the support line are considered by me to be "bullish" and the those struggling below the declining resistance line are "bearish".
Let's review a
chart on LB from Stockcharts.com:
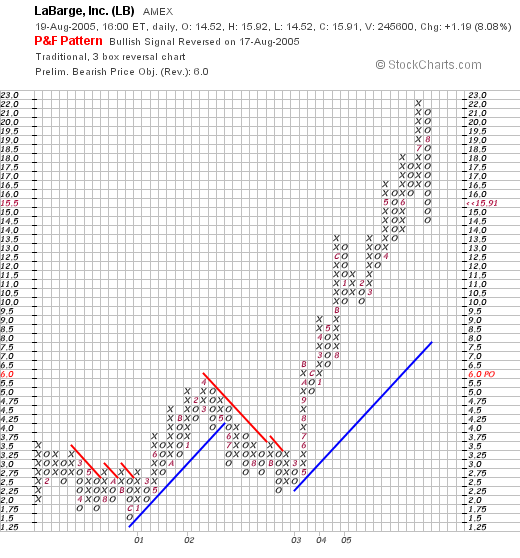
I am not a technician on stock charts nor do I claim any expertise. I just like to look at a chart and try to see if it looks like the price is moving higher, sideways or lower! Here we can see a price chart that from February, 2000, until December, 2000, was struggling under a resistance level around $3.00. The stock broke through this in early 2001, hit resistance at the $6 level in April, 2002, retraced back to $2.00/share in February, 2003, and then has been climbing strongly since then. The stock has recently pulled back slightly from what appears to be an "over-extended" price move on the upside (what I call the faster than the support line move higher), and appears to be poised to move higher yet!
So what do I think? Except that the stock appears to be a military contractor, which might be a cyclical type business, I like a lot about what I see on this stock. Let's review. The stock made a strong move higher today with the background of a very sloppy trading day. The latest quarter report was superb with very strong growth in both revenue and earnings. The past five years show impressive growth in both revenue and earnings. Free cash flow, while small, is consistently positive as the company grows its cash. The balance sheet is solid if not spectacular with valuation being very reasonable both with a p/e in the low 20's with a PEG under 1.0, and even the Price/Sales ratio is the lowest in its industrial group. On top of this the chart looks strong if a bit over-extended.
Now, if I only had sold some stock so I could buy a little of this one :). But I shall be sitting on my hands waiting for a signal to add back that 25th position! One of my concerns on this stock is the small cap size, which could add some volatility. But this can also work for you on the upside especially if the soon to be announced earnings are positive. However, watch out below if the company disappoints!
Thanks so much for stopping by. I hope I wasn't too wordy this evening (is that even a word?), but wanted to explain once again in a little more detail how I pick stocks! If you have any questions or comments, please feel free to email me at bobsadviceforstocks@lycos.com. Have a great weekend everyone!
Bob
A Reader Writes "A few questions...."
Hello Friends! Thanks so much for stopping by and visiting my blog,
Stock Picks Bob's Advice. As always, please remember that I am an amateur investor, so please consult with your professional investment advisors prior to making any investment decisions based on information on this website.

One of my favorite activities around here is to answer the occasional letter or comment that gets sent in. If you have any other questions or comments, please feel free to email me at bobsadviceforstocks@lycos.com.
Checking the "mailbox" I came across this letter from Willy who writes:
Sir,
I found you on Gordiandata.com and am impressed by your articles !
I use TC 2000 and Metastock as chartingprograms and have access to Internet
A few questions :
Which stockcharting program do you use ?
Which stockscreening program do you use ?
What are your buy criteria ?
What are your sell criteria ?
Hoping for an answer, I thank you and say Good Luck with your trading !
Willy
Since it has been awhile since I have gone over some of these points, let me try to answer these questions for Willy.
1) Regarding the stockcharting program...I
don't use any stockcharting program. I
do use
Stockcharts and simply enter the names into the box for a "point & figure" chart.
2) Which stock screening program? Again, not wishing to disappoint you with my low tech approach, I do
not use any stock screening program. I
do have an approach which is fairly disciplined to identify what I consider to be stocks likely to appreciate, but I am not using any software beyond easily available internet websites like
Yahoo "Finance" or
Morningstar.com I also have been using research from my Fidelity brokerage account.
3) What are my "buy criteria"? Well, these are the same as the criteria that I use to select a stock for this website. First, daily momentum: the stock should be on the top 50 of the highest % gainers list for the market (NYSE, NASDAQ, or AMEX). Next the latest quarter: the company should have reported positive year-over-year earnings
and revenue growth. Assuming this is acceptable, I look for a longer period of steady growth using the Morningstar "5-Yr Restated" financials. On Morningstar, besides the growth in revenue and earnings, I like to see growth in free cash flow, a solid balance sheet, and reasonable valuation. (reasonable valuation generally means a P/E not in the stratosphere, a PEG close to 1.0, a Price/Sales midway in its industrial growth, and a chart that looks solid.
4) What are my "sell criteria"? Mostly this is based on price action. However, if there is anyt piece of fundamental information that appears to be significantly negative, I shall use this as well as a rationale for selling. Such as an SEC investigation, significant lowering of guidance, or other bad news.
In general, I like to sell the stocks that I own quickly on a loss (at 8% for a first-time purchase), and slowly at increasingly high levels of price appreciation. In other words, after my initial purchase (I try to get similar $ amounts with each investment), I plan on selling 1/4 after a 1/3 gain...that is I sell 1/4 of my stock when it has appreciated to 4/3 value. Thus returning it to 3/3. Sort of selling my winning shares.
After my first sale, I continue to have targeted sales at 60%, 90% 120%, then by 120%: 180%, 240%, 300%, and 360% levels. I haven't made any sales at this time beyond the 300% appreciation level, but my next targeted price would be at 360%, 420%, 480%, and 540%. Thereafter, by 90% (x4), etc.
However, what about a stock that I have sold a portion at a gain, and then goes on to decline...do I plan on waiting for an 8% loss? No. If I have sold a stock once at a gain (presumably at the 30% appreciation level) then I sell at break-even or close to it on the declining stock price. I do not wait for a large loss to unload my shares.
And if a stock has been sold more than once at gains? In that case, I allow the stock appreciation to decline to 50% of the highese appreciation sale point prior to unloading my remaining shares. In other words, assuming a stock has appreciated adequately to justify two sales, with the last at 60% price gain, then I would allow the stock to drift back to a 30% price gain level before selling
all of the remaining shares. The same would go for three sales with the last at 90% gain level, I would allow a 50% retracement of the gain to a 45% gain level before selling.
Unfortunately, I do this manually, but there are automatic trading mechanisms to perform this in your portfolio.
5) A question you didn't ask, but which needs to be addressed, is "How do you respond to market action, that is, do you stay fully invested, or are you able to move into and out of cash vs. equities as market conditions change?" This is a question that I added to your inquiry :). (As author of this blog, I have that prerogative.)
Basically, I believe that one should establish a goal for the number of different holdings within a portfolio. For instance, in my own account, I have a 25 stock goal (I am currently at 24). I would suggest starting at 50% cash and 50% equities. After that I would either drop to 25% equities if trading "rules" dictate (and thereafter replace sales of stocks even on "bad news") or continue to add new positions in different stocks until I am invested at 100% equities. (Currently I am in margin, a condition I am working to extricate myself out of; and a condition which I do NOT recommend to any of my readers.)
Here is the simple part. I wait for a sale on a gain to add a new position (considering this a "signal" based on good news within my portfolio), and do
not replace sales on losses or bad news until such time that I have either sold a stock at a gain (good news) or I have reached my minimum investment level. This is my "investing gyroscope" that keeps me upright :).
That was a lot of explaining and I hope I didn't gloss over my approach nor did I make it too difficult to follow. Please let me know what you think.
Please remember that I really am an amateur, that I own actually a very small number of all of the stocks that I discuss, and that I do try to share with you when I actually own some shares and I try to keep you posted when I actually sell or buy shares!
In the meantime, thanks for dropping by, thanks for the kind words, and thank you for taking the time to write!
Bob
Wednesday, 17 August 2005
August 17, 2005 Raven Industries (RAVN)
Hello Friends! Thanks so much for stopping by and visiting my blog,
Stock Picks Bob's Advice. As always, please remember that I am an amateur investor, so please consult with your professional investment advisors prior to making any investment decisions based on information on this website.

What I like to do on this blog is to pick stocks :). There really isn't very much "magic" about my thinking process; I just use an approach involving looking at stocks making nice percentage gains and then examining their fundamentals.
This evening, while looking at the
list of top % gainers on the NASDAQ, I came across Raven Industries (RAVN). I do not own any shares of this company nor do I own any options.

RAVN had a nice day today, closing at $24.12 on the day, up $2.36 or 10.85%. According to the
Yahoo "Profile" on Raven, the company "...operates as an industrial manufacturer in North America. The company operates in three divisions: Flow Controls, Engineered Films, and Electronic Systems."
What drove the stock higher today was the announcement of
2nd quarter 2005 earnings. For the quarter ended July 31, 2005, sales rose 22% to $45.3 million from $37.1 million for the same quarter last year, and net income climbed 31% to $4.8 million or $.26/share, up from $3.6 million or $.20/share the prior year same quarter. This was
ahead of forecast beating expectations by a penny and was enough to push the stock price higher!
Looking longer-term at the
Morningstar.com "5-Yr Restated" financials, we can see that revenue did dip from $132.9 million in 2001 to $118.5 million in 2002, but has steadily increased since then to $180.4 million in the trailing twelve months (TTM).
Earnings, which increased from $.62/share in 2001, jumped to $.93/share in 2002 before dropping to $.60/share in 2003. Since then earnings have grown steadily to $1.07 in the TTM.
Free cash flow while a bit inconsistent has stayed positive increasing slightly from $7 million in 2003 to $8 million in the TTM.
The balance sheet, as reported by Morningstar.com, looks solid with $4.1 million in cash and $56.4 million in other current assets, plenty to cover both the $18.5 million in current liabilities and the $1.4 million in long-term liabilities combined three times over.
What about other "Key Statistics"? Looking in
Yahoo for this, we can see that RAVN is a small mid-cap stock with a market capitalization of $435.41 million. (In some lists, this size would be considered small cap!). The trailing p/e is reasonable at 22.58 with a forward p/e (fye 31-Jan-07) even nicer at 16.52. The "5 yr expected" PEG is only 1.05.

In terms of the price/sales ratio, looking at other stocks in the "Printed Circuit Boards" industrial group, per Fidelity.com, we see that RAVN with a price/sales ratio of 2.2 leads the group with the other stocks lower. Jabil Circuit (JBL) comes in at 0.8, Flextronics (FLEX) at 0.5, Solectron (SLR) at 0.4, Celestics (CLS) at 0.3, and Sanmina (SANM) at 0.2. Thus, in this particular parameter, Raven actually comes in pricey!
Other information on Yahoo shows Raven with 18.05 million shares outstanding with 15.80 million of them that float. Currently there are 530,000 shares out short (as of 7/12/05), representing 3.30% of the float or 4.6 trading days. Being above 3 days, this looks like it may be a factor imho.
The company
does pay a small dividend of $.22/share yielding 1.02%. The last stock split was a 2:1 split on October 18, 2004.
What about a chart? Looking at a
"Point & Figure" Chart on Raven from Stockcharts.com:
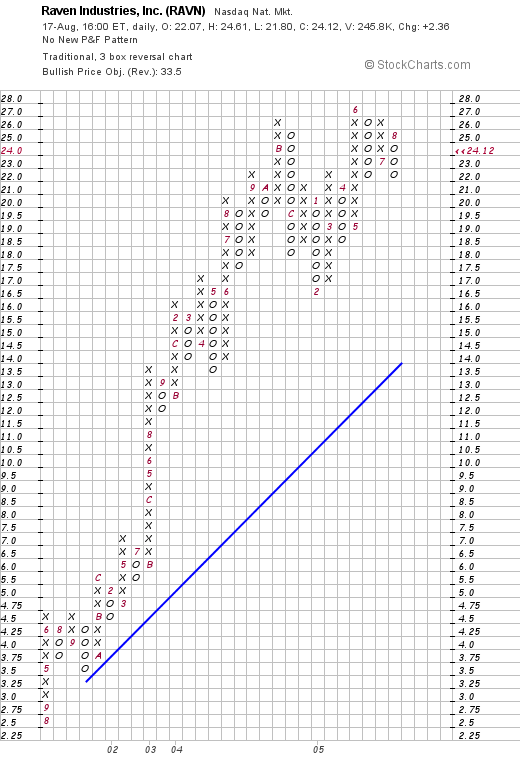
We can see what appears to me to be a rather gorgeous graph with a strong upward move from $2.50/share in August 2001 to the current close of $24.12. The graph looks nice if not a tad over-extended.
So what do I think? Well, let's review: the stock made a nice move higher today in a bit of a sloppy market on what appears to be a great earnings report that did beat expectations. The company has been growing steadily for at least the last several years, is generating growing free cash flow, has a solid balance sheet and is valued reasonably with a PEG just over 1.0. The Price/Sales figure is a bit rich for the group it is in but otherwise valuation seems fine. In addition the company pays a small dividend and has a chart that would be tough to beat :). So I like it. Even though it is a bit small!
Anyhow, I don't have any money right now to buy any stocks; although I am close, and could possibly add a 25th position if I can generate a sale on a gain. In fact, my Joseph Bank (JOSB) is trading fairly weakly on anemic same store sales growth of 0.5%. The jury is still out on that one!
Thanks so much for stopping by! If you have any comments or questions, please feel free to email me at bobsadviceforstocks@lycos.com or just leave a message right on the blog!
Bob
Tuesday, 16 August 2005
"Revisiting a Stock Pick" Fargo Electronics (FRGO)
Hello Friends! Thanks so much for stopping by and visiting my blog,
Stock Picks Bob's Advice. As always, please remember that I am an amateur investor and that you should always consult with a professional investment advisor prior to making any decisions based on information on this website.

Needless to say, today was a very weak trading day with the Dow down 120.93 to 10,513.45, and the NASDAQ off 29.98 points to 2,137.06. However, not all stocks declined! In fact, reviewing the
list of top % gainers on the NASDAQ, I came across Fargo Electronics (FRGO) which closed at $17.76, up $1.53 or 9.43% on the day. I do own some shares of Fargo in a managed retirement account.
I first
posted Fargo (FRGO) on Stock Picks on October 6, 2003, when it was trading at $14.82. Thus, I have a "gain" on this selection of $2.94 or 19.8% since the original post. Let's take another look at FRGO and see if it
still deserves to be on Stock Picks!

According to the
Yahoo "Profile" on Fargo, the company "...engages in the development, manufacture, and supply of secure technologies for identity card issuance systems. It offers secure card printer/encoders, materials, and software."
As you probably know if you have been on the blog before, one of the key things I like to review is the latest quarterly report. On July 26, 2005, Fargo
reported 2nd quarter 2005 results. Net sales for the quarter ended June 30, 2005, grew to $18.9 million, compared with $17.5 million last year same quarter. Net income for the quarter came in at $2.4 million or $.18/diluted share, up from $1.7 million or $.14/diluted share last year.
Taking a look at the
Morningstar.com "5-Yr Restated" financials, we can see that revenue has been growing almost perfectly from $57.8 million in 2000 to $75.5 million in the trailing twelve months (TTM).
Morningstar.com also shows that earnings have grown nicely from $.34/share in 2001 to $.66/share in the trailing twelve months (TTM). During this time, free cash flow has grown from $9 million in 2002 to $11 million in the TTM.
Looking at the Morningstar.com balance sheet we find that FRGO now reports $27.0 million in cash as well as $18.3 million in other current assets. The cash alone is enough to cover the $8.7 million in current liabilities more than three times over. In addition, Morningstar reports FRGO with -0- in long-term liabilities.
Reviewing
Yahoo "Key Statistics" on FRGO, we can see that this is a pretty tiny company, almost at the "micro" cap level with a market capitalization of $224.42 million. The trailing p/e is nice at 25.44, and the forward p/e (fye 31-Dec-06) is nicer at 20.65 with a "5 yr expected" PEG of only 1.23.
Insofar as the price/sales ratio is concerned, using the
Paul Sturm approach to Price/Sales ratios, and referring to Fidelity.com for information, we can see that FRGO is reasonably priced midway in value with a price/sales ratio of 2.7. Topping the industry group of "Business Software & Svcs" is BEA Systems (BEAS) at 3.3, followed by Business Objects (BOBJ) at 3.2, First Data (FDC) at 3.1, and then FRGO tied with Automatic Data Processing (ADP) at 2.7, with Fiserv (FISV) at the bottom of this list with a parice/sales ratio of 2.3.
Looking back at the Yahoo statistics on FRGO we can see that there are only 12.64 million shares outstanding. Currently there are 169,320 shares out short representing 3.80% of the float but only 2.1 trading days of volume. No cash dividend and no stock splits are reported.
What about the chart? Looking at a
"Point & Figure" chart on FRGO from Stockcharts.com:
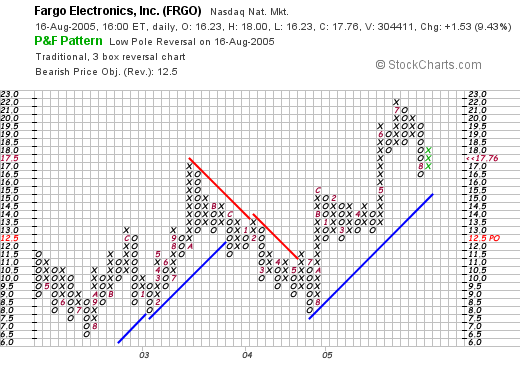
, we can see what looks to me to be a steady but strong chart for FRGO. The stock bottomed at $6.50 in July, 2002, but has since moved higher except for a sell-off from $17 in October, 2003, to a low of $8.00 in July, 2004. However, since then, the stock has continued to move above the support line.
So what do I think? Well, I do own some shares :) but I didn't make that particular decision as those shares are in a managed retirement account. However, this is the 2nd time I have listed this stock on Stock Picks! The latest quarter was strong and the past five years have showed steady growth in revenue, earnings, free cash flow, in conjunction with a very solid balance sheet. Valuation is reasonable and the chart looks nice.
Now, if I had sold something at a gain (not the QSII which was late), well, this might be a stock I might be adding to my portfolio! Thanks so much for stopping by. If you have any questions or comments, please feel free to post them right here on the blog or email me at bobsadviceforstocks@lycos.com.
Bob
"Trading Transparency" Quality Systems (QSII)
Hello Friends! Thanks so much for stopping by and visiting my blog,
Stock Picks Bob's Advice. As always, please remember that I am an amateur investor so please consult with your professional investment advisors prior to making any investment decisions based on information on this website.
Last night, while reviewing my sale strategy with my son, who is still learning about investing and not quite sure about what I do :), I realized that I had "missed" a sale target on my strongest stock in my portfolio, Quality Systems (QSII).
If you are new to my strategy, I personally like to sell my losers quickly (as I just did with my ANF stock--see previous post) and sell my gainers
slowly; selling 1/4 of remaining position at targeted price gains of 30, 60, 90, 120%; and then 180, 240, 300, and 360%; with planned sales increasing by 30% intervals x 4, so that the next sale gains would be at 450, 540, 630, and 720%...etc.
Anyhow, somehow, since I do all of this manually :(, I missed a sale on Quality Systems. Since I am at 24 positions, this would also be a signal to me normally to be entitled to add a postion to the portfolio. However, since this was a mistake, I shall be sitting on my hands.
Back to the point, I realized last night that my gain on QSII exceeded 300% which would be my 7th sale of shares of this stock. Until this morning, I had sold QSII six times (!), which would make the last sale at the 240% target.
A few moments ago, I sold 25 shares (of my 102 share position remaining) at $69.02. These shares were acquired 7/28/03 with a cost basis of $15.50 (!!), thus giving me a gain of $53.52/share or 345.3%. I am thus closing on my next sale target of 360%!
Anyway, I shall not be going to 25 positions until I get a real (not delayed) sale at a gain! And in the interim, this also works to reduce my significant, but hopefully gradually shrinking, margin level!
Thanks again for visiting! If you have any questions or comments, please feel free to leave them right here on the blog or you can email me at bobsadviceforstocks@lycos.com.
Bob
"Trading Transparency" Abercrombie & Fitch (ANF)
Hello Friends! Thanks so much for stopping by and visiting my blog,
Stock Picks Bob's Advice. As always please remember that I am an amateur investor, so please consult with your professional investment advisors prior to making any investment decisions based on information on this website.
This is a quick morning update :). The stocks are correcting a bit today, and my ANF stock was sitting on the edge of a sale near an 8% loss prior to the opening. With the downward pressure on prices, ANF passed my 8% loss threshold and I sold my shares.
In summary, a few moments ago I sold my 160 shares of ANF at $61.62. These shares were just acquired on 6/7/05 at a cost basis of $68.14. Thus, I had a loss of ($6.52) or (9.6%) on my investment. This drops me down to 24 positions, and I am about to sell a portion of my QSII at a gain....but this should have been sold earlier, so it still will not trigger a purchase back to 25. But I shall be waiting for a true sale at a gain, and thus be once more in the market to move to 25. In the meantime, this sale will help to reduce margin in this sloppy market!
Thanks for dropping by! If you have any questions or comments, please feel free to email me at bobsadviceforstocks@lycos.com or just leave your messages right here on the blog.
Bob
Sunday, 14 August 2005
"Looking Back One Year" A review of stock picks from the week of June 14, 2004
Hello Friends! Thanks so much for stopping by and visiting my blog,
Stock Picks Bob's Advice. As always, please remember that I am an amateur, and that you need to check with your professional investment advisors prior to making any investment decisions based on information on this website.
As I like to point out, these weekend reviews are about stocks that I have selected to review for this blog. Most of these stocks are
not in my actual trading portfolio. This week, I shall be review American Healthways (AMHC), which
does happen to be a holding of mine. I do not own any shares of the other stocks discussed.
The review assumes a buy and hold approach to investing. This is
not what I actually do in practice. In fact, I sell my stocks quickly if they develop any losses, and sell my gaining stocks slowly, selling portions of my holdings on the way up. In addition, it is always helpful to remember that past performance is
no guarantee of future performance. Just because a stock has done well in the past does not guarantee that it will continue to appreciate and the opposite is true as well.

On June 14, 2004, I
posted Curtiss Wright (CW) on Stock Picks at a price of $49.46. CW closed on 8/12/05 at $62.50 for a gain of $13.04 or 26.4% since posting.
Curtiss-Wright reported
2nd quarter 2005 results on July 28, 2005. Net sales jumped 27% to $283.2 million from $222.4 million in the prior year. Net earnings increased 25% to $17.9 million or $.82/diluted share, up from $14.3 million or $.67/diluted share the prior year. In addition, the company
increased full year 2005 guidance!

On June 15, 2004, I
posted Palomar Medical Technologies (PMTI) on Stock Picks at a price of $14.83. PMTI closed at $27.46 on August 12, 2005 for an increase of $12.63 or 85.2%.
On July 28, 2005, Palomar
reported 2nd quarter 2005 results. Total revenues for the quarter ended June 30, 2005, increased 38% to $18.2 million, up from $13.2 million. Net income jumped 100% to $4.0 million or $.21/diluted share, vs. net income of $2.0 million or $.12/diluted share the prior year. (This was actually a 75% increase on a per diluted share basis).

On June 16, 2004, I
posted Greg Manning Auctions (GMAI) on Stock Picks at $15.70/share. GMAI closed at $14.41 on August 12, 2005, down ($1.29) or (8.2)% since posting.
On May 12, 2005 GMAI
reported 3rd quarter 2005 results. For the quarter ended March 31, 2005, aggregate sales totaled $74.7 million, down from $82.0 million the prior year. However, net income jumped 61% to $21 million from
$13 million the prior year. For the quarter, net income rose 26% to $8.2 million or $.29/diluted share, up from $6.5 million, or $.23/diluted share. In other words, revenue, imho, was a negative dropping to a lower level, however income did increase which was helpful in stabilizing the stock price. (just my view!).

Finally, on June 18, 2004, I posted
American Healthways (AMHC) on Stock Picks when it was trading at $24.11. AMHC closed on August 12, 2005, at a price of $42.59, for a gain of $18.48 since listing it heree. This amounts to a gain of 76.6% since posting!
On June 20, 2005, AMHC
announced 3rd quarter 2005 results. Revenue climbed 20% to $78.4 million for the quarter ended May 31, 2005, up from $65.4 million last year same period. Net income came in up under 10% to $8.5 million from $7.5 million last year or $.24/diluted share up from $.22/share last year.
So how did I do picking stocks that week about a year ago? In one word, phenomenal. I wish I could do that all the time :). I had three stocks moving higher with one (Greg Manning) moving slightly lower. The overall average performance worked out to a gain of 45%!
Thanks so much for stopping by! If you have any questions or comments, please feel free to leave them right here on the blog, or email me at bobsadviceforstocks@lycos.com. Have a great week trading and investing everyone!
Bob
Thursday, 11 August 2005
A Reader Writes "Amedisys (AMED)...What do you think?"
Hello Friends! Thanks so much for stopping by and visiting my blog,
Stock Picks Bob's Advice. As always please remember that I am an amateur investor, so please consult with your professional investment advisors prior to making any investment decisions based on information on this website.
I was browsing through my mailbox, (spending a lot of time deleting SPAM!), and came across a nice letter from Lisa who writes:
Hi Bob,
I've been lurking on your website for awhile now. I find it pretty interesting how many very good stocks you've uncovered. I like your sell discipline.
I've been screening for stocks that move 2% or more on a given day with the following additional criteria:
EPS qtr vs qtr >10%
EPS yr vs yr >10%
Rev qtr vs qtr >10%
Rev yr vs yr >10%
Expected EPS growth next yr >10%
Avg daily volume >150K
Mkt Cap > $500M (I'm not that comfortable trading smaller co's)
It's amazing how many stocks this simple screen turns up each day! From there I perform alot of the same steps you review - rev, cash flow, PE, chart, etc.
Recently, Amedisys (AMED) has turned up on my radar screen 2x this month. What do you think? I've already put my toe in the water with an initial position today @ $41.
Keep up the great work!
Lisa G
Lisa, thanks so much for visiting and now contributing to my blog. I look forward to more questions and comments from you and your ideas about picking stocks.
First of all, let me comment on your "system". I think that it makes just as much sense as what I am doing here. You are looking at, if I understand right, stocks making a nice upward move ("2% or more"), growing earnings (both sequential and year over year), growing revenue (both sequential and year over year), estimated growth over 10%, and significant daily volume and at least mid-cap size. In addition, you state you do a lot of the same stuff I do, like revenue, cash flow, chart, etc.
I was once accused of "due diligence". I think you are suffering from the same disease :). In other words, I think that we are, as you might say, reading from the same page! I believe that your approach makes sense, is indeed a bit different than what I am doing, but on the other hand, we are placing emphasis on many of the same criteria.
Now the second part of your question, "Amedisys?". What do I think?
I first
posted Amedisys (AMED) on Stock Picks on June 21, 2004, when it was trading at $30.74. I do not currently own any shares or options on this stock. But let's take a quick look and see what is "cooking".
AMED closed today at $41, up $1.00 or 2.50% on the day.
What about the latest quarter? On August 2, 2005, AMED reported
2nd quarter 2005 earnings results. This is the gist of what was reported: for the quarter ended 6/30/05, "net service revenue" climbed 41% to $80.1 million from $56.9 million last year. Net income grew from $5.0 million to $7.9 million this year, and on a per share diluted basis, increased from $.39/share to $.50/share in 2005. So far so good :).
To top off this strong report, AMED "increases guidance for 2005" as noted in the same article. Great earnings with raised guidance is about as "good as it gets"....well not as good as the Jack Nicholson movie by the same name :), but you know what I mean.
Looking at the
"5-Yr Restated" financials from Morningstar.com, we can see that revenue growth has been uninterrupted, increasing from $88.2 million in 2000 to $250.2 million in the trailing twelve months (TTM).
Earnings, which dropped from $.87 in 2000 to a low of $.08 in 2002, have improved sequentially since then to a $1.62 reported in the TTM.
On a negative note, the company has been using stock apparently to finance this growth with the company growing from 4 million shares in 2000 to 15 million in the TTM. Apparently the company has been issuing shares every year since 2000, at least that is what it appears to be doing on the balance sheet.
Free cash flow is solidly positive with $12 million reported in 2002, increasing to $20 million in the trailing twelve months.
The balance sheet still looks nice with $78.9 million in cash and $31.3 million in other current assets which is plenty to cover both the $48.1 million in current liabilities and the $10.8 million in long-term liabilities combined.
Finally, let's look at the
"Point & Figure" chart from Stockcharts.com:
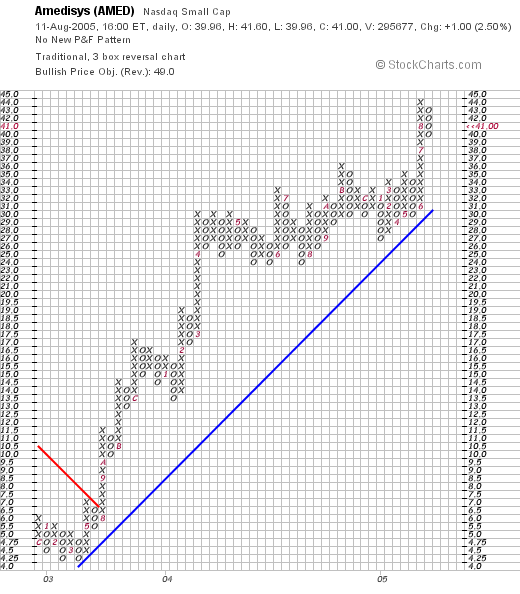
Again, please rember that I am NOT a technician, nor a professional chart reader, etc. But looking at the graph, the stock looks like it was starting to run into the support level, then once again broke out to the upside. It looks strong to me.
What do I think? Well, I think you know the answer to that. Let's review. First of all, I posted this stock last year at about 30% lower price! The latest stock report was solid. And the company management raised guidance! The Morningstar.com report looks nice and the chart is solid. Looks pretty strong to me.
I would advise to have a plan established about selling as well as buying....know when, according to your system, you will sell on the downside or on the upside! Good luck and keep me posted!
If you have any questions or comments about this or any other stocks, please feel free to leave them right on the blog or email me at bobsadviceforstocks@lycos.com .
Bob
"Revisiting a Stock Pick" Par Technology (PTC)
Hello Friends! Thanks so much for stopping by and visiting my blog,
Stock Picks Bob's Advice. As always, please remember that I am an amateur investor, so please consult with your professional investment advisors prior to making any decisions based on information on this website.
Prior to making my brief "revisit" I wanted to share with you a beautiful Wayne Thiebaud painting that was sold a couple years back at Sotheby's at
auction:

The painting is called "Freeways".
I first posted Par (PTC) on Stock Picks on 5/9/05 when it was trading at $22.17. Currently, PTC is trading at $31.36, up $1.61 or 5.41% on the day. I don't own any shares or options on this stock.
Anyhow, the latest quarterly report was superb, the Morningstar looks nice, and the graph is pretty! Something to still consider.
Just wanted to drop all of you a short note today. I shall be keeping things a bit briefer around here!
Bob
Newer | Latest | Older


