Stock Picks Bob's Advice
Friday, 26 August 2005
"Revisiting a Stock Pick" Lifeway Foods (LWAY)
Hello Friends! Thanks so much for stopping by and visiting my blog,
Stock Picks Bobs's Advice. As always, please remember that I am an amateur investor so please remember to consult with your professional investment advisors prior to making any investment decisions based on information on this website.

Alan Greenspan is throwing a little
cold water on the market today, warning about the increasing value of stocks and real estate. In the face of this, I still managed to find a stock from the
list of top % gainers on the NASDAQ today.

I first
posted Lifeway (LWAY) on Stock Picks on August 21, 2003, when it was trading at $14.51/share. LWAY had a 2:1 stock split, making our effective "pick price" only $7.26. I actually owned a few shares for awhile, although I do not currently own any shares or options in this company.
Today, LWAY, as I write, is trading at $16.18, up $2.09 or 14.83% on the day. This is an increase of $8.92 or 122.9% from my pick price almost exactly two years ago!
What is driving the stock higher today, in the face of a fairly sloppy market, was the
news that Wal-Mart will be carrying some of its kefir milk-based products in up to 17 of their stores in the Chicago area.
According to the
Yahoo "Profile" on LWAY, Lifeway "...manufactures probiotic, cultured, and functional dairy and nondairy health products. It offers Kefir, a drinkable product, which is similar to but distinct from yogurt, in various flavors sold under the name 'Lifeway's Kefir'; a plain farmer's cheese sold under the name 'Lifeway's Farmer's Cheese'; a fruit sugar-flavored product similar to cream cheese sold under the name of 'Sweet Kiss'; and a dairy bevarage, similar to Kefir, with protein and calcium, sold under the name 'Basics Plus'."

On August 15, 2005, LWAY reported
2nd quarter 2005 earnings. Revenues for the quarter ended June 30, 2005, came in at $5.07 million, up 27% from last year's second quarter revenue of $4.00 million. Net income for the quarter came in at $556,845 or $.07/share in 2005, up from $432,109 or $.05/split-adjusted share in 2004.
Looking longer-term at a
"5-Yr Restated" financials from Morningstar, we can see a nice, steady picture of revenue growth from $9.2 million in 2000 to $17.0 million in the trailing twelve months (TTM).
Earnings have also steadily grown from $.11/share in 2000 to $.24/share in the TTM, except for a slight dip from $.26/share in 2003 to $.24 in 2004.
Free cash flow, while small, has stayed positive with $3 million reported in 2002 and $2 million in the TTM.
The balance sheet also is beautiful with $12.3 million in cash alone reported, more than enough to pay off both the current liabilities of $.9 million and the long-term liabilities of $.9 million combined more than six times over. In addition, LWAY is reported by Morningstar to have an additional $3.8 million in other current assets.

Looking at
Yahoo "Key Statistics" on LWAY, we can see that this is a TINY company with a market cap of only $135.61 million. The trailing p/e is a bit rich at 63.62, and the forward p/e is still high at 40.40 (fye 31-Dec-06). No PEG is listed.
The stock also looks rich on a price/sales basis. According to my Fidelity brokerage account research, Lifeway (LWAY) tops the list of price/sales ratios in the "Dairy Products" industrial group at 7.0. This is followed by Dreyer's (DRYR) at 4.8, Galaxy Nutritional (GXY) at 0.8, and Dean Foods (DF) at 0.5.
Looking back at Yahoo for some other valuation measures, we find that LWAY now has 8.39 million shares outstanding. As of 7/12/05, there were 255,780 shares out short representing 6.50% of the float or 4 days of trading. So this isn't that significant imho. No cash dividend is paid, and the last stock split was the 2:1 mentioned earlier on 3/9/04.
What about the chart? Looking at a
"Point & Figure" chart on LWAY from Stockcharts.com:
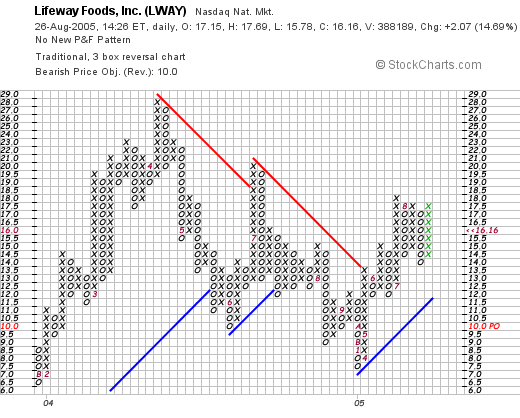
We can see a chart that initially was quite strong early in 2004 when it climbed from $7 to $28 in April, 2004, but then sold off for the nex year until bottoming recently at $8.00 in January, 2005. The stock subsequently broke through resistance at $14, and is now trading higher. The stock looks positive, but certainly not the strongest chart in the world. On the other hand, it doesn't look overextended as many of the graphs I post on stocks look. Anyhow, you make the call :).
So what do I think? Well, the latest quarter was solid. It is a very tiny stock and a tiny company which makes a big move on news of having its yogurt drink carried by 17 Wal-Mart stores. But then again, there are a LOT of Wal-Mart stores out there....so that could be big news (?). Anyway, the Morningstar looks nice, with the exception of a big of a dip in earnings this past year (the latest quarter shows that this is likely already history). Free cash flow is positive and the balance sheet is gorgeous.
The valuation is a bit rich with both p/e and p/sales significantly higher than its peers.
The chart looks positive and not over-valued.
In summary, this is a very small company with what appears to be a very positive outlook. I do believe that these companies may be the ones that produce the largest gains in stock price, but may also be the most volatile as large investors have no choice but make waves as they enter and depart shares.
Thanks so much for stopping by! If you have any questions or comments, please feel free to email me at bobsadviceforstocks@lycos.com, or just leave them right here on the blog. Have a great weekend everyone!
Bob
Thursday, 25 August 2005
A Reader Writes: "What is your take on LaBarge?"
Hello Friends! Thanks so much for stopping by and visiting my blog,
Stock Picks Bob's Advice. As always, please remember that I am an amateur investor, so please consult with your professional investment advisors prior to making any investment decisions based on information on this website.

A friend of mine and a regular blog reader dropped me a line today about La Barge (LB). La Barge is a recent stock pick of mine, in fact, I
posted La Barge (LB) on Stock Picks on 8/19/05 just six days ago when it was trading at $15.91/share. LB had a
terrible day in the market, closing at $13.38, down $3.26 or (19.59%) on the day. Which leads me to my friend, Bob K.'s question. He wrote:
Hi Bob,
What is your take on La Barge? I thought their 4th quarter numbers announced today were impressive. They announced a buy back of 1 million shares (which should stimulate the price). yet the stock has fallen almost 20% today. Is it time to sell? I continue to enjoy your blog.
Thanks,
Bob
Well Bob, thanks for the kind words about the blog. And if you did buy some shares of LB, this reveals the volatility of stocks and the potential for losses when a company disappoints. That is the role of a portfolio with multiple issues, to dampen the peaks and valleys of individual investments.
After I opened this email, I went on a search to try to figure out what happened. If you read through the
4th quarter 2005 earnings report, you will first see that sales jumped 10% and earnings increased 14%. So far so good. Where we hit the glitch is down further into the report under the title "Outlook and Commentary" where Mr. La Barge writes:
Mr. LaBarge concluded, "Based on the strength of current backlog and the healthy array of new business opportunities in the pipeline, we expect to achieve double-digit growth in fiscal 2006 full-year sales and earnings. However, we anticipate first-quarter sales and earnings per share will be down slightly from the prior-year's levels due to several customer-requested delays in certain planned shipments. We are projecting fiscal 2006 first-quarter sales in the range of $41 million to $42 million and diluted earnings per share of $0.12 to $0.13, compared with sales of $43.6 million and diluted earnings per share of $0.15 in the fiscal 2005 first quarter."
I added all of that emphasis for effect. But one of the biggest things about stock prices is about
expectations and the street hates any sign of disappointment. And this was a warning about the next quarter being light on both revenue and earnings.
What should you do? Well that is certainly up to you. In my trading account, I sell stocks, even sometimes after owning them a day, if I hit an 8% loss. Should you? The rest of the report states that the following quarter should be quite strong. But there is something called the "cockroach theory" of investing, which goes something like this: "If you see one bad result it is like a cockroach, there are likely to be many more hidden elsewhere."
Bob, please remember that I am truly an amateur investor, so I too face the same problems of losses in investments. The secret overall, imho, is to minimize the losses, selling on set loss limit points quickly, and selling your gainers slowly.
Thanks again for visiting and I hope that you continue to read and write in...I do like the email...and hopefully next time it will be about good news!
Bob
Posted by bobsadviceforstocks at 5:58 PM CDT
|
Post Comment |
Permalink
Updated: Thursday, 25 August 2005 6:00 PM CDT
"Revisiting a Stock Pick" Coldwater Creek (CWTR)
Hello Friends! Thanks so much for stopping by and visiting my blog,
Stock Picks Bob's Advice. As always, please remember that I am an amateur investor, so please consult with your professional investment advisors prior to making any investment decisions based on information on this website.

I'm at this a little early today, but was happy to see an 'old favorite' of mine making the
list of top % gainers on the NASDAQ today. As I write, Coldwater Creek (CWTR) is trading at $29.81, up $3.66 or 14.0% on the day. I do not own any shares nor do I have any options on this stock.

I first
posted CWTR on Stock Picks on May 25, 2004, when the stock was trading at $25.40. Coldwater subsequently split 3:2 on 7/26/04, and 3:2
again (boy do I wish I actually had bought this stock), on 3/21/05, making our effective stock pick price actually $11.29. (To calculate this, we need to multiply the $25.40 by 2/3 for each of the 3/2 stock splits) Thus, the stock has actually already appreciated $18.50 or 164% (!) since the stock was listed here.
What drove the stock higher today, was the
announcement of 2nd quarter 2005 results after the close of trading yesterday. In a nutshell, net sales for the quarter ended July 30, 2005, increased 39% to $154.6 million from $111.2 million in the same quarter last year. Net income for the same period increased $3.6 million or 109% to $7.0 million or $.11/diluted share, up from $3.3 million or $.06/diluted share for the same period a year ago.
Taking a quick look at Morningstar.com, we can see that revenue has grown steadily from $458 million in 2001 to $590 million in the trailing twelve months (TTM).
Earnings have been a bit erratic, dropping from $.24/share in 2001 to $.02/share in 2002, but have increased steadily since then to $.48/share in the TTM.
Free cash flow has been positive and steady in the high teens ($millions), with $20 million in 2003, and $18 million in the TTM.
The balance sheet looks strong on Morningstar with $111.2 million in cash and $91.1 million in other current assets balanced against $85.8 million in current liabilities and only $40.5 million in long-term liabilities.

Looking at some
"Key Statistics" from Yahoo, we can see that this is a large cap stock with a market capitalization of $1.80 billion. The trailing p/e is rich at 56.91, but the forward p/e (fye 29-Jan-07) is better at 33.31. The "5 yr expected" PEG is nice at 0.97 with a very rapid growth anticipated.
Within the "Catalog/Mail Order houses" industrial group, we find that Coldwater is the "richest" in valuation with a price/sales of 2.6. Other companies in this group (per Fidelity research) are J. Jill (JILL) at 0.8, ValueVision Media (VVTV) at 0.8, Insight Enterprises (NSIT) at 0.3, and PC CONNECTION (PCCC) at 0.1.
Reviewing some other statistics on CWTR, we find that there are 60.84 million shares outstanding with 36.34 million that float. As of 7/12/05 there were 3.97 million shares out short representing 10.7% of the float or 8.6 trading days of volume (the "short ratio"). Since I arbitrarily use a 3 day short ratio limit as a cut-off in significance, this looks impressive to me and we may be witnessing a bit of a "squeeze" of the short-sellers who are scrambling to buy shares (?) to cover. That is just speculation on my part, but the short sellers do tend to get squeezed when a stock rises in price on good news.
No cash dividend is reported on Yahoo and the last stock split, as noted above, was a 3:2 on 3/21/05.
What about the chart? If we look at a
"Point & Figure" chart from Stockcharts.com on CWTR:
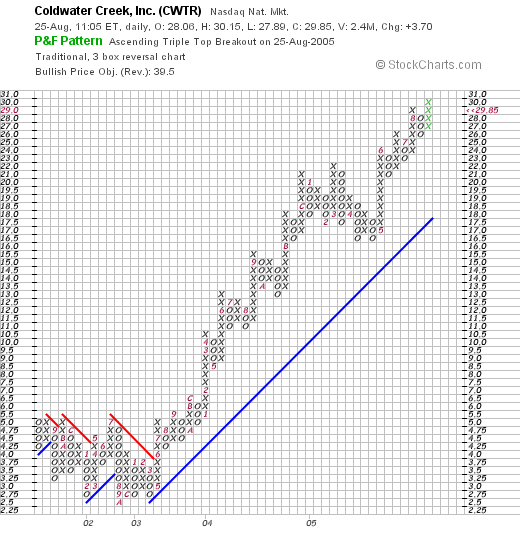
We can see a gorgeous stock chart with the stock trading sideways through much of 2001 through mid 2003, and breaking through a resistance level in May, 2003, at about the $3.75 level (adjusted for splits) and then heading higher in a very strong and steady fashion. I am not much of a technician, but the stock looks strong to me.
In summary, what do I think? Well, I am still kicking myself for not buying any shares :). But the latest quarterly report was strong, the past five years have been steady with revenue and earnings growing nicely, the free cash flow looks nice, the balance sheet is solid, and the chart looks very strong.
On the downside, this is no undiscovered bargain :(. The stock carries a p/e which is over 50, the PEG however, is under 1.0, but the Price/Sales ratio is also a bit rich relative to other stocks in the group. As long as the stock continues to report solid reports, things should continue to do well. I guess that is why I suggest 8% stops under purchases!
Thanks again for stopping by and visiting! If you have any questions or comments, please feel free to email me at bobsadviceforstocks@lycos.com or leave them right here on the blog.
Bob
Posted by bobsadviceforstocks at 9:46 AM CDT
|
Post Comment |
Permalink
Updated: Thursday, 25 August 2005 10:26 AM CDT
Wednesday, 24 August 2005
"Revisiting a Stock Pick" Giant Industries (GI)
Hello Friends! Thanks so much for stopping by and visiting my blog,
Stock Picks Bob's Advice. As always, please remember that I am an amateur investor, so please consult with your professional investment advisors prior to making any investment decisions based on information on this website.

I was looking through the list of
top % gainers on the NYSE this morning and came across Giant Industries (GI), a stock that I had
posted on Stock Picks on 2/11/04 when it was trading at $15.94/share. GI is currently trading, as I write, at $41.72/share, up $2.42 on the day for a gain of 6.16%. This is up $25.78 or 161.7% since posting! Unfortunately, I don't own any shares or options on this stock at this time.
According to the
Yahoo "Profile", Giant "...engages in the refining and sale of petroleum products in the United States. The company operates in three groups: Refining, Retail, and Phoenix Fuel."
On August 3, 2005, Giant
reported 2nd quarter 2005 earnings results. Net revenue for the three months ended June 30, 2005, grew 32% to $863.4 million from $654.0 million the prior year same period. Net earnings were $20.6 million or $1.51/diluted share, up from $5.0 million or $.44/diluted share the prior year.
If we look longer-term at a
"5-Yr Restated" financials from Morningstar.com, we can see a steady picture of revenue growth from $1 billion in 2000 (with a slight dip to $900,000 in 2001) increasing to $2.9 billion in the trailing twelve months (TTM).
Earnings have improved rapidly from a loss of $(1.08) in 2002 to $2.83/share in the TTM.
Free cash flow has been strong with $25 million reported in 2002 and $40 million in the TTM.
The balance sheet, as reported on Morningstar, looks good with $59.9 million in cash and $265.0 million in other current assets, balanced against $176.9 million in current liabilities and $355.0 million in long-term liabilities.
Looking at some
"Key Statistics" on GI from Yahoo, we can see that this is a small mid-cap stock with a market capitalization of $558.71 million. The trailing p/e is downright reasonable at 14.28 and the PEG ratio is one of our lowest on the website at 0.38, once again suggesting reasonable valuation.
Taking a look at the price/sales ratio, in relation to other stocks in the same industrial group "Oil & Gas Refining/Marketing", we can see that this stock is also a good value by this measurement. All of these stocks sell at low multiples to sales, with Murphy Oil (MUR) toppping the list at 1.0, followed by Amerada Hess (AHC) at 0.6, Marathon Oil (MRO) and Valero (VLO) are at 0.4, Tesoro (TSO) is at 0.3, and at the bottom of the list is Giant Industries (GI), the stock we are currently reviewing, at 0.2.
Looking at some other numbers from Yahoo, we can see that there are only 13.42 million shares outstanding. As of 5/10/05 there were 705,800 shares out short, a bit of a 'stale' statistic, representing 4.4 trading days of volume or 5.30% of the float. No dividend and no stock splits are reported on Yahoo.
Checking a
"Point & Figure" chart on GI from Stockcharts.com:
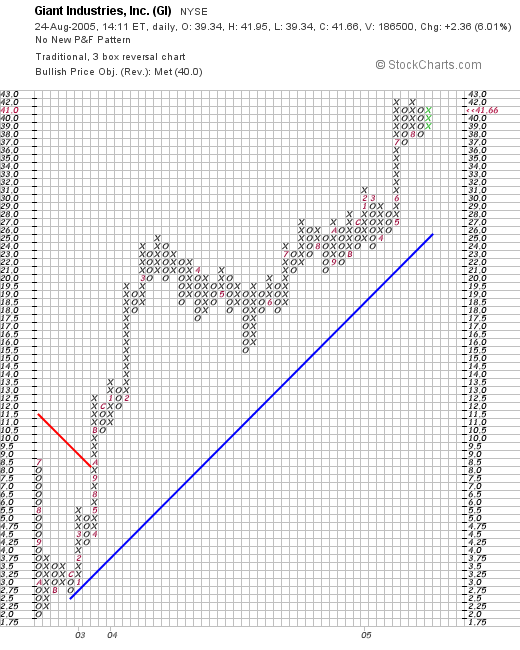
We can see what looks like a very strong chart to me with the price bereaking through resistance (the red declining line) in September, 2004, when the stock price passed $8.00/share. The stock has been climbing steadily since and appears poised (imho) to advance further.
So what do I think? Well, I really like this company, but of course, like any energy stock, this will depend on continued strength in the oil market. Let's review a few findings: stock is moving nicely higher today, the latest quarterly report was superb with a tremendous growth in both revenue and earnings, the past five years have also been quite strong, free cash flow is solidly positive, and the balance sheet is strong. Valuation is excellent with a p/e under 15, a PEG under 1.0, and a price/sales under 1.0 and furthermore, the lowest in its group! Topping it off, the chart looks strong!
Now, if only I was in the market to buy a stock :). Oh well. Thanks again for stopping by and visiting. I hope that my approach is helpful to you in looking at stocks! Please feel free to drop me a line with your comments, questions, or suggestions, at bobsadviceforstocks@lycos.com or leave your messages right here in the blog!
Bob
Monday, 22 August 2005
August 22, 2005 Moody's Corp (MCO)
Hello Friends! Thanks so much for stopping by and visiting my blog,
Stock Picks Bob's Advice. As always, please remember that I am an amateur investor so please consult with your professional investment advisors prior to making any investment decisions based on information on this website.

I was looking through the
list of top % gainers on the NYSE this morning and came across Moody's (MCO) which as I write is trading at $49.37, up $1.88 or 3.96% on the day. I do not own any shares in Moody's nor do I own any options.
According to the
Yahoo "Profile", Moody's "...provides credit ratings, and research and analysis covering debt instruments and securities in the capital markets worldwide, as well as credit assessment services, credit training services, and credit process software to banks and other financial institutions."
On July 29, 2005 Moody's
reported 2nd quarter 2005 results which showed revenue growing 25% to $446.8 million for the quarter ended June 30, 2005, up from $357.6 million the prior year same quarter. Net income came in at $145.4 million, up from $103.5 million last year, or $.47/diluted share, up from $.34/diluted share the prior year.
Looking at the
"5-Yr Restated" financials from Morningstar, we can see a beautiful picture of revenue growth, with revenue growing steadily from $600 million in 2000 to $1.6 billion in the trailing twelve months (TTM).
Earnings per share have also
consistently been growing, increasing from $.49/share in 2000 to $1.58/share in the TTM. The company does pay a small dividend which has been a bit erratic but is a nice feature on a stock in any case.
Free cash flow has been solid and growing from $317 million in 2002 to $611 million in the TTM.
The balance sheet is also solid if not overwhelming with $930.8 million in cash, almost enough to pay off
both the $843.2 million in current liabilities and the $239.0 million in long-term liabilities combined. In addition, MCO has $439.9 million in other current assets per Morningstar.
Looking at
"Key Statistics" from Yahoo, we find that this is a large cap stock with a market capitalization of $14.82 billion. The trailing p/e is a bit rich at 31.24, with a forward p/e of 25.79 (fye 31-Dec-06) and a PEG (5 yr expected) of 1.82.
Using my Fidelity account for research, we find that the price/sales ratio is also a bit rich for the industrial group. In the "Business Services" group, we find that Moody's (MCO) is top at a price/sales of 9.0. Further down the list is Equifax (EFX) at 3.3, Global Payments (GPN) at 3.3, Cintas (CTAS) at 2.3, Certegy (CEY) at 1.9, and IPAYMENT (IPMT) at 1.2. Thus, in this parameter, once again Moody's is
no 'screaming bargain'.
Looking at some other key statistics, we can see that there are 300.9 million shares outstanding (that is a lot for this blog!). The float isn't listed on Yahoo. There are 8.71 million shares out short (as of 5/10/05) representing 2.90% of the float for a short ratio of 6.4 (meaning 6.4 trading days of average volume to cover). In my view, 3 days is a "cut-off" for significance when I look at stocks so 6.4 is significant. However, these numbers are a bit 'stale' so it would be nice to know the current short interest.
MCO does pay a small dividend of $.16/share yielding 0.33%. The last stock split was a 2:1 just this year in May, 2005.
Reviewing the
"Point & Figure" chart on MCO from Stockcharts.com:
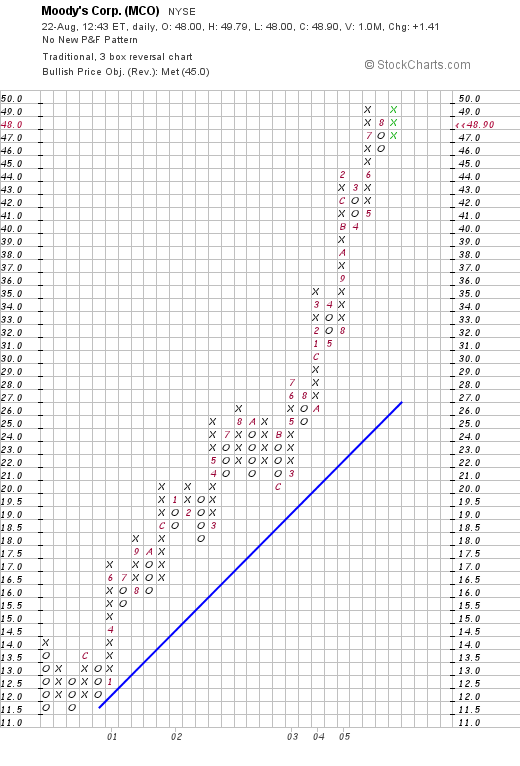
We can see a VERY strong chart with a steady move higher from about $11.50 in late 2000. The chart does appear a bit over-extended with a pull-back to support levels in the mid 30's not unreasonable. But then again, I am not a technician :) so you make the call!
What do I think? Well, I am not even sure whether the stock is on the top % gainers still (I started this post earlier today), but the latest quarter was strong, the past five years have been superb, the free cash flow is impressive and the balance sheet also looks nice. The problem is we aren't the first one to discover this stock :). Valuation is a bit rich, with a p/e over 30, a PEG over 1.5, and a price/sales in the stratosphere in its group. In addition, while the chart looks strong, it is a tad (?) over-extended. So it is a tough sell on this stock in a purely value fashion. I think we are a bit late to this party!
Anyhow, that's my take on the stock which does fit a bunch of the criteria that I use here on the blog. I think we find better value in the smaller cap stocks that aren't as widely known and followed as a large cap stock like Moody's!
Have a great day trading and investing! If you have any questions or comments, please feel free to email me at bobsadviceforstocks@lycos.com or leave them right here on the blog.
Bob
Posted by bobsadviceforstocks at 9:57 AM CDT
|
Post Comment |
Permalink
Updated: Monday, 22 August 2005 12:10 PM CDT
Saturday, 20 August 2005
"Looking Back One Year" A review of stock picks from the week of June 21, 2004

Hello Friends! Thanks so much for stopping by and visiting my blog,
Stock Picks Bob's Advice. As always, please remember that I am an amateur investor, so please consult with your professional investment advisors prior to making any investment decisions based on information on this website.
One of the things I like to do on this website is to look back on prior picks in a somewhat systematic fashion, and find out how they did after a year. Currently, I am up to the week of June 21, 2004, which is almost 60 weeks out, so we are looking back on stock picks from a bit over a year ago. If you would like to browse through past stock picks, you can on the blog where I have links along the left side of the page to previous picks grouped by date.
The review of past picks on these pages assumes a buy and hold strategy. That is, if I had purchased an equal dollar amount of the stocks discussed, 'what would have happened to that investment?' In reality, I have purchased only a small fraction of stocks discussed and share with the readers all of my transactions in my trading account. Furthermore, I do not ever 'buy and hold' anymore! I sell my losing stocks quickly, and sell my gaining stocks gradually at specified targeted prices. Someday, I shall have to integrate that strategy into these reviews....but for now, I shall do the best I can with a presumed 'buy and hold' review.

On June 21, 2004, I
posted Amedisys (AMED) on Stock Picks at a price of $30.74. AMED closed at $42.67 on 8/19/05, for a gain of $11.93 or 38.8%.

On August 2, 2005, AMED
reported 2nd quarter 2005 results. Net service revenue for the quarter ended June 30, 2005, increased 41% to $80.1 million from $56.9 million the prior year. Net income came in at $7.9 million or $.50/diluted share, up from $5.0 million or $.39/diluted share in the 2004 same period. The average number of shares outstanding
did increase to 15.8 million in 2005, compared with 12.8 million shares the prior year.

On June 23, 2004, I
posted NVE Corp (NVEC) on Stock Picks at a price of $36.61. NVEC closed at $14.97 on 8/19/05, for a loss of ($21.64) or (59.1%). Clearly, I do
not bat 1.000 on these stock picks!

On July 20, 2005, NVEC
reported 1st quarter 2006 results. Total revenue for the quarter ended June 30, 2005, came in at $3.03 million for the quarter compared with $2.89 million for the same quarter a year ago. Net income for the quarter worked out after "the effect of a non-cash provision for income taxes", to be $412,649 or $.09/diluted share, down from $483,671 or $.10/diluted share the prior year.

On June 24, 2004, I
posted Cohesant Technologies (COHT) on Stock Picks at a price of $10.06. On August 19, 2005, COHT closed at $9.30, for a loss of ($.76) or (7.6%).
On June 16, 2005, COHT
reported 2nd quarter 2005 results. Net sales climbed 7.8% to $5.7 million from $5.3 million the prior year same period. However, net income for the quarter came in at $406,986, down 23.1% from the $529,153 reported the previous year. On a fully diluted per share basis this came in at $.15/share in the current quarter, down from $.31/share the prior year same period.
So how did we do in the year interval since the postings? In a word, "awful". Averaging the three 'stock picks' we can see that I had one pick with a nice gain, but the other two came in at losses. In fact, the average performance of these three stocks came in at (9.3)%.
You can see that I
don't always have a great week in reviewing past stocks! Thanks so much for stopping by and visiting my blog. If you have any comments or questions, please feel free to leave them here on the blog or email me at bobsadviceforstocks@lycos.com.
Bob
Friday, 19 August 2005
August 19, 2005 LaBarge (LB)
Hello Friends! Thanks so much for stopping by and visiting my blog,
Stock Picks Bob's Advice. As always, please remember that I am an amateur investor and you should always consult with a professional investment advisor before making any investment decisions based on information on this website.
I received a nice email recently from a reader named Willy, who I believe is from Belgium (Willy please correct me if I am wrong!), and who inquired about my stock picking "techniques". With that in mind, let me try to explain my rationale with this stock pick today.
Some years back, during the go-go years of the internet stock boom, I noticed that stocks that were making large moves, as recorded on the top % gainers lists available in multiple places, often went on to make substantial gains.
Thus, I spend a lot of time in an initial search for stocks by scanning the list of top gainers. Today, I found a prospect on the
AMEX list of top % gainers. (Another of my "picks" American Vanguard (AVD) is also on the list but I have already reviewed this stock on this blog
here on December 29, 2003 and
here on May 31, 2005).
So, on the 'look-out' for something that I
hadn't reviewed, I came across LaBarge, Inc. (LB) which closed today at $15.91, up $1.19 or 8.08% on the day. I do
not own any shares nor do I have any options on this stock.
I am a big user of the
Yahoo Finance website, and looking at the
Yahoo "Profile" on LaBarge, we can see that LB "...engages in the design, engineering, and production of electronic systems and devices, and interconnect systems on a contract basis in the United States. It manufactures printed circuit card assemblies, cables and harnesses, box-build assemblies, and electronic/electromechanical systems."
My next step was to find the latest quarterly report. Usually, this is easily found on Yahoo in the "Headlines" section, but sometimes, with the smaller companies, it is easier to locate the information on the company website.
On April 28, 2005, LaBarge
reported 3rd quarter 2005 results. Net sales for the third quarter ended April 3, 2005, rose 41% to $44.8 million, compared with $31.8 million the prior year. Net earnings increased 77% to $3.0 million or $.19/diluted share, compared with $1.7 million, or $.11/diluted share in the same quarter a year ago!
My next stop in a review of a stock for possible inclusion here is to take a bit of a longer-term view using
Morningstar. In particular, I like the
"5-Yr Restated" financials.
First of all, looking at the sales numbers, we can see that revenue has been climbing, slightly irregularly but growing from $79.6 million in 2000 to $178.1 million in the trailing twelve months (TTM).

Although I prefer to see consistency, it is not uncommon to find some fluctuations in all the numbers in these small companies. Overall the trend is still positive. Taking a look at the earnings numbers, we find (continuing operations) that earnings per share improved from a loss of $(.11)/share in 2000 to $.69/share in the TTM.
Free cash flow is also small but positive with $4 million reported in 2002, and $3 million in the TTM.
The balance sheet, as represented on Morningstar, looks good with $600,000 in cash and $68.2 million in other current assets, balanced against $42 million in current liabilities and $27.9 million in long-term debt. I prefer to see a larger multiple of assets over liabilities, but the excess of current assets over current liabilities is still about 1.5, and with the positive free cash flow, this appears just fine imho.
Generally, my next step in looking at a stock is to review the "key statistics". These are numbers that give us a feel for what may be called "valuation". Things like price/earnings, price/sales, PEG (price/earnings compared to the growth rate), and the like. The lower all of these parameters are, the better the "value" the stock represents.
For this purpose, I again return to Yahoo and look at the page on
"Key Statistics". Here we can see that this is a very small company, a "small cap" stock with a market capitalization of only $239.29 million.
The price/earnings ratio is very reasonable at 23.92 (imho), the forward p/e (fye 27-Jun-06) is reported at 19.40, even a nicer number. Thus, the PEG ratio (5 yr expected) is under 1.0 at 0.97. For GARP (Growth At a Reasonable Price) investors, PEGS at or under 1.0 are considered reasonable and a good value.
For the Price/Sales ratio, I have taken to look at Fidelity Brokerage for their research. One of the things I like to do with the Price/Sales ratio is
not to take it out of context but to view this number in relation to other similar stocks, stocks that are in the same Industry Group. This is something I have picked up from
Paul Sturm from SmartMoney.com.
In this particular group, "Scientific/Tech Instruments", we find that LaBarge is very reasonably valued with a price/sales ratio of 1.2. In fact, Garmin (GRMN) tops the list at 6.8, followed by Flir (FLIR) at 4.6, Agilent (A) at 2.1, Fisher Scientific (FSH) at 1.5 and Beckman Coulter (BEC) at 1.4. The stock appears to be a great value by this particular parameter as well!
Jumping back to Yahoo for some other numbers, we find that the company has only 15.04 million shares outstanding with 10.68 million that float. As of 7/12/05, there were 249,970 shares out short, representing 2.90% of the float or 1.3 trading days of volume (the "short ratio"). I have personally chosen three days of short interest to cover these "pre-sold" shares of speculators betting against the stock, as a level of significance. Thus, the short sales don't appear to be very large.
Yahoo reports no stock dividend and no cash dividend on this company.
Finally, I like to take a look at the chart and share this with my readers. I have for the last few years started getting very comfortable with "point & figure" charts that display the tides of the stock price with the columns of 'x's' indicating a rising price, battling against the columns of 'o's' which represent a declining stock price. The 45 degree lines super-imposed on the chart represent "support" lines if they are moving higher, and "resistance" lines if they are moving lower. Trends that stay above the support line are considered by me to be "bullish" and the those struggling below the declining resistance line are "bearish".
Let's review a
chart on LB from Stockcharts.com:
I am not a technician on stock charts nor do I claim any expertise. I just like to look at a chart and try to see if it looks like the price is moving higher, sideways or lower! Here we can see a price chart that from February, 2000, until December, 2000, was struggling under a resistance level around $3.00. The stock broke through this in early 2001, hit resistance at the $6 level in April, 2002, retraced back to $2.00/share in February, 2003, and then has been climbing strongly since then. The stock has recently pulled back slightly from what appears to be an "over-extended" price move on the upside (what I call the faster than the support line move higher), and appears to be poised to move higher yet!
So what do I think? Except that the stock appears to be a military contractor, which might be a cyclical type business, I like a lot about what I see on this stock. Let's review. The stock made a strong move higher today with the background of a very sloppy trading day. The latest quarter report was superb with very strong growth in both revenue and earnings. The past five years show impressive growth in both revenue and earnings. Free cash flow, while small, is consistently positive as the company grows its cash. The balance sheet is solid if not spectacular with valuation being very reasonable both with a p/e in the low 20's with a PEG under 1.0, and even the Price/Sales ratio is the lowest in its industrial group. On top of this the chart looks strong if a bit over-extended.
Now, if I only had sold some stock so I could buy a little of this one :). But I shall be sitting on my hands waiting for a signal to add back that 25th position! One of my concerns on this stock is the small cap size, which could add some volatility. But this can also work for you on the upside especially if the soon to be announced earnings are positive. However, watch out below if the company disappoints!
Thanks so much for stopping by. I hope I wasn't too wordy this evening (is that even a word?), but wanted to explain once again in a little more detail how I pick stocks! If you have any questions or comments, please feel free to email me at bobsadviceforstocks@lycos.com. Have a great weekend everyone!
Bob
A Reader Writes "A few questions...."
Hello Friends! Thanks so much for stopping by and visiting my blog,
Stock Picks Bob's Advice. As always, please remember that I am an amateur investor, so please consult with your professional investment advisors prior to making any investment decisions based on information on this website.
One of my favorite activities around here is to answer the occasional letter or comment that gets sent in. If you have any other questions or comments, please feel free to email me at bobsadviceforstocks@lycos.com.
Checking the "mailbox" I came across this letter from Willy who writes:
Sir,
I found you on Gordiandata.com and am impressed by your articles !
I use TC 2000 and Metastock as chartingprograms and have access to Internet
A few questions :
Which stockcharting program do you use ?
Which stockscreening program do you use ?
What are your buy criteria ?
What are your sell criteria ?
Hoping for an answer, I thank you and say Good Luck with your trading !
Willy
Since it has been awhile since I have gone over some of these points, let me try to answer these questions for Willy.
1) Regarding the stockcharting program...I
don't use any stockcharting program. I
do use
Stockcharts and simply enter the names into the box for a "point & figure" chart.
2) Which stock screening program? Again, not wishing to disappoint you with my low tech approach, I do
not use any stock screening program. I
do have an approach which is fairly disciplined to identify what I consider to be stocks likely to appreciate, but I am not using any software beyond easily available internet websites like
Yahoo "Finance" or
Morningstar.com I also have been using research from my Fidelity brokerage account.
3) What are my "buy criteria"? Well, these are the same as the criteria that I use to select a stock for this website. First, daily momentum: the stock should be on the top 50 of the highest % gainers list for the market (NYSE, NASDAQ, or AMEX). Next the latest quarter: the company should have reported positive year-over-year earnings
and revenue growth. Assuming this is acceptable, I look for a longer period of steady growth using the Morningstar "5-Yr Restated" financials. On Morningstar, besides the growth in revenue and earnings, I like to see growth in free cash flow, a solid balance sheet, and reasonable valuation. (reasonable valuation generally means a P/E not in the stratosphere, a PEG close to 1.0, a Price/Sales midway in its industrial growth, and a chart that looks solid.
4) What are my "sell criteria"? Mostly this is based on price action. However, if there is anyt piece of fundamental information that appears to be significantly negative, I shall use this as well as a rationale for selling. Such as an SEC investigation, significant lowering of guidance, or other bad news.
In general, I like to sell the stocks that I own quickly on a loss (at 8% for a first-time purchase), and slowly at increasingly high levels of price appreciation. In other words, after my initial purchase (I try to get similar $ amounts with each investment), I plan on selling 1/4 after a 1/3 gain...that is I sell 1/4 of my stock when it has appreciated to 4/3 value. Thus returning it to 3/3. Sort of selling my winning shares.
After my first sale, I continue to have targeted sales at 60%, 90% 120%, then by 120%: 180%, 240%, 300%, and 360% levels. I haven't made any sales at this time beyond the 300% appreciation level, but my next targeted price would be at 360%, 420%, 480%, and 540%. Thereafter, by 90% (x4), etc.
However, what about a stock that I have sold a portion at a gain, and then goes on to decline...do I plan on waiting for an 8% loss? No. If I have sold a stock once at a gain (presumably at the 30% appreciation level) then I sell at break-even or close to it on the declining stock price. I do not wait for a large loss to unload my shares.
And if a stock has been sold more than once at gains? In that case, I allow the stock appreciation to decline to 50% of the highese appreciation sale point prior to unloading my remaining shares. In other words, assuming a stock has appreciated adequately to justify two sales, with the last at 60% price gain, then I would allow the stock to drift back to a 30% price gain level before selling
all of the remaining shares. The same would go for three sales with the last at 90% gain level, I would allow a 50% retracement of the gain to a 45% gain level before selling.
Unfortunately, I do this manually, but there are automatic trading mechanisms to perform this in your portfolio.
5) A question you didn't ask, but which needs to be addressed, is "How do you respond to market action, that is, do you stay fully invested, or are you able to move into and out of cash vs. equities as market conditions change?" This is a question that I added to your inquiry :). (As author of this blog, I have that prerogative.)
Basically, I believe that one should establish a goal for the number of different holdings within a portfolio. For instance, in my own account, I have a 25 stock goal (I am currently at 24). I would suggest starting at 50% cash and 50% equities. After that I would either drop to 25% equities if trading "rules" dictate (and thereafter replace sales of stocks even on "bad news") or continue to add new positions in different stocks until I am invested at 100% equities. (Currently I am in margin, a condition I am working to extricate myself out of; and a condition which I do NOT recommend to any of my readers.)
Here is the simple part. I wait for a sale on a gain to add a new position (considering this a "signal" based on good news within my portfolio), and do
not replace sales on losses or bad news until such time that I have either sold a stock at a gain (good news) or I have reached my minimum investment level. This is my "investing gyroscope" that keeps me upright :).
That was a lot of explaining and I hope I didn't gloss over my approach nor did I make it too difficult to follow. Please let me know what you think.
Please remember that I really am an amateur, that I own actually a very small number of all of the stocks that I discuss, and that I do try to share with you when I actually own some shares and I try to keep you posted when I actually sell or buy shares!
In the meantime, thanks for dropping by, thanks for the kind words, and thank you for taking the time to write!
Bob
Wednesday, 17 August 2005
August 17, 2005 Raven Industries (RAVN)
Hello Friends! Thanks so much for stopping by and visiting my blog,
Stock Picks Bob's Advice. As always, please remember that I am an amateur investor, so please consult with your professional investment advisors prior to making any investment decisions based on information on this website.

What I like to do on this blog is to pick stocks :). There really isn't very much "magic" about my thinking process; I just use an approach involving looking at stocks making nice percentage gains and then examining their fundamentals.
This evening, while looking at the
list of top % gainers on the NASDAQ, I came across Raven Industries (RAVN). I do not own any shares of this company nor do I own any options.

RAVN had a nice day today, closing at $24.12 on the day, up $2.36 or 10.85%. According to the
Yahoo "Profile" on Raven, the company "...operates as an industrial manufacturer in North America. The company operates in three divisions: Flow Controls, Engineered Films, and Electronic Systems."
What drove the stock higher today was the announcement of
2nd quarter 2005 earnings. For the quarter ended July 31, 2005, sales rose 22% to $45.3 million from $37.1 million for the same quarter last year, and net income climbed 31% to $4.8 million or $.26/share, up from $3.6 million or $.20/share the prior year same quarter. This was
ahead of forecast beating expectations by a penny and was enough to push the stock price higher!
Looking longer-term at the
Morningstar.com "5-Yr Restated" financials, we can see that revenue did dip from $132.9 million in 2001 to $118.5 million in 2002, but has steadily increased since then to $180.4 million in the trailing twelve months (TTM).
Earnings, which increased from $.62/share in 2001, jumped to $.93/share in 2002 before dropping to $.60/share in 2003. Since then earnings have grown steadily to $1.07 in the TTM.
Free cash flow while a bit inconsistent has stayed positive increasing slightly from $7 million in 2003 to $8 million in the TTM.
The balance sheet, as reported by Morningstar.com, looks solid with $4.1 million in cash and $56.4 million in other current assets, plenty to cover both the $18.5 million in current liabilities and the $1.4 million in long-term liabilities combined three times over.
What about other "Key Statistics"? Looking in
Yahoo for this, we can see that RAVN is a small mid-cap stock with a market capitalization of $435.41 million. (In some lists, this size would be considered small cap!). The trailing p/e is reasonable at 22.58 with a forward p/e (fye 31-Jan-07) even nicer at 16.52. The "5 yr expected" PEG is only 1.05.

In terms of the price/sales ratio, looking at other stocks in the "Printed Circuit Boards" industrial group, per Fidelity.com, we see that RAVN with a price/sales ratio of 2.2 leads the group with the other stocks lower. Jabil Circuit (JBL) comes in at 0.8, Flextronics (FLEX) at 0.5, Solectron (SLR) at 0.4, Celestics (CLS) at 0.3, and Sanmina (SANM) at 0.2. Thus, in this particular parameter, Raven actually comes in pricey!
Other information on Yahoo shows Raven with 18.05 million shares outstanding with 15.80 million of them that float. Currently there are 530,000 shares out short (as of 7/12/05), representing 3.30% of the float or 4.6 trading days. Being above 3 days, this looks like it may be a factor imho.
The company
does pay a small dividend of $.22/share yielding 1.02%. The last stock split was a 2:1 split on October 18, 2004.
What about a chart? Looking at a
"Point & Figure" Chart on Raven from Stockcharts.com:
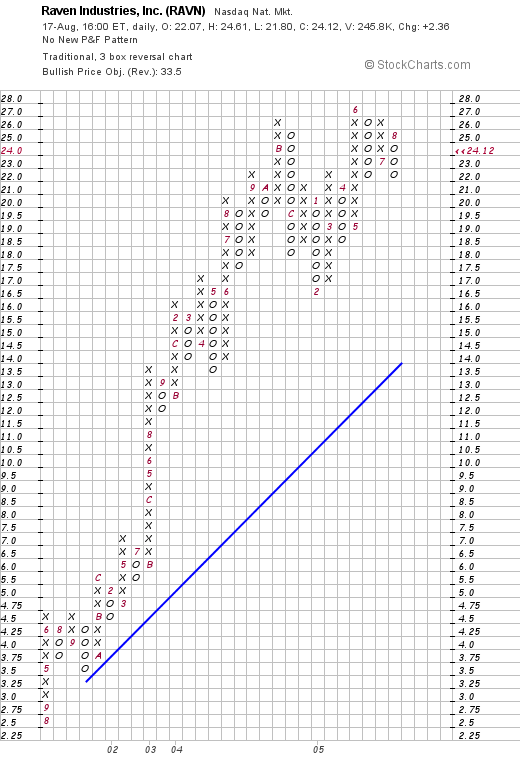
We can see what appears to me to be a rather gorgeous graph with a strong upward move from $2.50/share in August 2001 to the current close of $24.12. The graph looks nice if not a tad over-extended.
So what do I think? Well, let's review: the stock made a nice move higher today in a bit of a sloppy market on what appears to be a great earnings report that did beat expectations. The company has been growing steadily for at least the last several years, is generating growing free cash flow, has a solid balance sheet and is valued reasonably with a PEG just over 1.0. The Price/Sales figure is a bit rich for the group it is in but otherwise valuation seems fine. In addition the company pays a small dividend and has a chart that would be tough to beat :). So I like it. Even though it is a bit small!
Anyhow, I don't have any money right now to buy any stocks; although I am close, and could possibly add a 25th position if I can generate a sale on a gain. In fact, my Joseph Bank (JOSB) is trading fairly weakly on anemic same store sales growth of 0.5%. The jury is still out on that one!
Thanks so much for stopping by! If you have any comments or questions, please feel free to email me at bobsadviceforstocks@lycos.com or just leave a message right on the blog!
Bob
Tuesday, 16 August 2005
"Revisiting a Stock Pick" Fargo Electronics (FRGO)
Hello Friends! Thanks so much for stopping by and visiting my blog,
Stock Picks Bob's Advice. As always, please remember that I am an amateur investor and that you should always consult with a professional investment advisor prior to making any decisions based on information on this website.

Needless to say, today was a very weak trading day with the Dow down 120.93 to 10,513.45, and the NASDAQ off 29.98 points to 2,137.06. However, not all stocks declined! In fact, reviewing the
list of top % gainers on the NASDAQ, I came across Fargo Electronics (FRGO) which closed at $17.76, up $1.53 or 9.43% on the day. I do own some shares of Fargo in a managed retirement account.
I first
posted Fargo (FRGO) on Stock Picks on October 6, 2003, when it was trading at $14.82. Thus, I have a "gain" on this selection of $2.94 or 19.8% since the original post. Let's take another look at FRGO and see if it
still deserves to be on Stock Picks!

According to the
Yahoo "Profile" on Fargo, the company "...engages in the development, manufacture, and supply of secure technologies for identity card issuance systems. It offers secure card printer/encoders, materials, and software."
As you probably know if you have been on the blog before, one of the key things I like to review is the latest quarterly report. On July 26, 2005, Fargo
reported 2nd quarter 2005 results. Net sales for the quarter ended June 30, 2005, grew to $18.9 million, compared with $17.5 million last year same quarter. Net income for the quarter came in at $2.4 million or $.18/diluted share, up from $1.7 million or $.14/diluted share last year.
Taking a look at the
Morningstar.com "5-Yr Restated" financials, we can see that revenue has been growing almost perfectly from $57.8 million in 2000 to $75.5 million in the trailing twelve months (TTM).
Morningstar.com also shows that earnings have grown nicely from $.34/share in 2001 to $.66/share in the trailing twelve months (TTM). During this time, free cash flow has grown from $9 million in 2002 to $11 million in the TTM.
Looking at the Morningstar.com balance sheet we find that FRGO now reports $27.0 million in cash as well as $18.3 million in other current assets. The cash alone is enough to cover the $8.7 million in current liabilities more than three times over. In addition, Morningstar reports FRGO with -0- in long-term liabilities.
Reviewing
Yahoo "Key Statistics" on FRGO, we can see that this is a pretty tiny company, almost at the "micro" cap level with a market capitalization of $224.42 million. The trailing p/e is nice at 25.44, and the forward p/e (fye 31-Dec-06) is nicer at 20.65 with a "5 yr expected" PEG of only 1.23.
Insofar as the price/sales ratio is concerned, using the
Paul Sturm approach to Price/Sales ratios, and referring to Fidelity.com for information, we can see that FRGO is reasonably priced midway in value with a price/sales ratio of 2.7. Topping the industry group of "Business Software & Svcs" is BEA Systems (BEAS) at 3.3, followed by Business Objects (BOBJ) at 3.2, First Data (FDC) at 3.1, and then FRGO tied with Automatic Data Processing (ADP) at 2.7, with Fiserv (FISV) at the bottom of this list with a parice/sales ratio of 2.3.
Looking back at the Yahoo statistics on FRGO we can see that there are only 12.64 million shares outstanding. Currently there are 169,320 shares out short representing 3.80% of the float but only 2.1 trading days of volume. No cash dividend and no stock splits are reported.
What about the chart? Looking at a
"Point & Figure" chart on FRGO from Stockcharts.com:
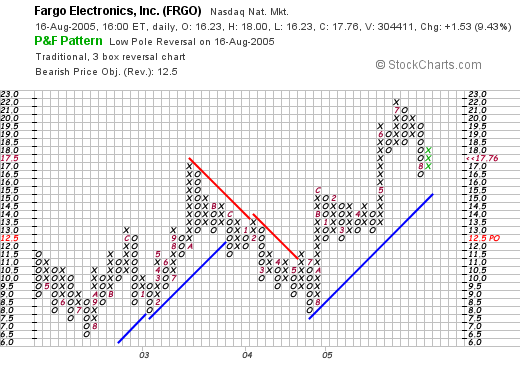
, we can see what looks to me to be a steady but strong chart for FRGO. The stock bottomed at $6.50 in July, 2002, but has since moved higher except for a sell-off from $17 in October, 2003, to a low of $8.00 in July, 2004. However, since then, the stock has continued to move above the support line.
So what do I think? Well, I do own some shares :) but I didn't make that particular decision as those shares are in a managed retirement account. However, this is the 2nd time I have listed this stock on Stock Picks! The latest quarter was strong and the past five years have showed steady growth in revenue, earnings, free cash flow, in conjunction with a very solid balance sheet. Valuation is reasonable and the chart looks nice.
Now, if I had sold something at a gain (not the QSII which was late), well, this might be a stock I might be adding to my portfolio! Thanks so much for stopping by. If you have any questions or comments, please feel free to post them right here on the blog or email me at bobsadviceforstocks@lycos.com.
Bob
Newer | Latest | Older


