Stock Picks Bob's Advice
Wednesday, 11 January 2006
"Revisiting a Stock Pick" Manitowoc Co. (MTW)
Hello Friends! Thanks so much for stopping by and visiting my blog,
Stock Picks Bob's Advice. As always, please remember that I am an amateur investor, so please remember to consult with your professional investment advisor prior to making any investment decisions based on information on this website.
Click
HERE for the PODCAST on MANITOWOC CO
As I have commented on elsewhere in this blog, I like to write about stocks that I actually own and also many stocks that I don't own but appear to have attractive characteristics that might be worth consideration. Since I am now approaching three years of blogging, I have many stocks that have been reviewed and occasionally choose to take a second look at these stocks. My policy, is to wait at least a year prior to a repeat posting of a stock on this blog.

I was looking through the list of top % gainers on the NYSE today, and I came across The Manitowoc Company (MTW), an old favorite of mine from this blog, which closed at $58.70, up $3.35 or 6.05% on the day. I do not own any shares of this stock nor do I have any options. I first posted MTW on Stock Picks Bob's Advice on November 22, 2004, a little over a year ago, when it was trading at $38.29. The stock is now up $20.41 or 53.3% since posting. I answered an inquiry from a reader about MTW on Stock Picks Bob's Advice just two months ago, on November 13, 2005, when MTW was trading at $46.96, so the stock has appreciated $11.74, or 25% just in the last six or seven weeks!
 Let's take another look at this company starting with the Yahoo "Profile" on Manitowoc Co.. According to Yahoo, the company
"...engages in the manufacture and sale of cranes, foodservice equipment, and marine equipment worldwide. The company operates in three segments Cranes and Related Products (Crane), Foodservice Equipment (Foodservice), and Marine."
And what was the news that pushed the stock higher today? First, the company
announced that fiscal '05 would exceed previous guidance followed by an
upgrade from Robert W. Baird.
How about the latest quarterly results? On November 2, 2005, Manitowoc (MTW)
announced 3rd quarter financial results. For the quarter ended September 30, 2005, net sales increased 23% to $564.9 million, from $460.8 million in the same quarter last year. Net earnings came in at $17.1 million up from $12.7 million the prior year. On a fully diluted eps basis, this came in at $.55/share this year vs $.47/share the prior year. In addition, the company increased full year eps guidance from $2.15-$2.30/share, up to $2.30 to $2.35/share in the year ahead. I have taken to calling earnings reports that show increasing revenue, earnings, and increased guidance a "trifecta", which would be just about as good a report as we can currently identify.
And how about longer-term? Taking a look at the
Morningstar.com "5-Yr Restated" financials, we can see the steady growth in revenue from $.7 billion in 2000 to $2.0 billion in 2004 and $2.2 billion in the trailing twelve months (TTM). Earnings have been far more erratic, dropping from $2.40/share in 2000 to $(.80)/share in 2002. However, since that point in time, earnings have grown steadily to $1.74 in the TTM.
Free cash flow has also been a bit erratic, but has stayed positive with $62 million reported in 2002, and $39 million in the TTM.
The balance sheet is reasonable with $122.6 million in cash and $749.8 million in other current assets. This should be enough to cover the $643.2 million in current liabilities and some of the $735.4 million in long-term debt.
Looking at
Yahoo "Key Statistics" on MTW, we find that this is a mid cap stock with a market capitalization of $1.78 billion. The trailing p/e is a bit rich 33.30, but with the rapid growth in earnings expected, we have a forward p/e (fye 31-Dec-06) is much nicer at 16.72.
According to the
Fidelity.com eResearch website on MTW, the company is in the "Farm/Construction Machinery" Industrial Group. The Price/Sales of MTW at 0.8 is in the middle of the group with Joy Global (JOYG) at the top with a Price/sales ratio of 2.9. This is followed by Caterpillar (CAT) at 1.2, Manitowic (MTW) at 0.8, Deere (DE) at 0.8, AGCO (AG) at 0.3, and CNH Global (CNH) at 0.3.
Looking at some additional statistics from Yahoo, we can find that there are 30.25 million shares outstanding with 4.90% of the shares out short as of 12/12/05, representing 5.7 trading days of volume. The company pays a small dividend of $.28/share yielding 0.5%. The last stock split was a 3:2 split in April, 1999.
What about a chart? Looking at the
"Point & Figure" chart from Stockcharts.com:
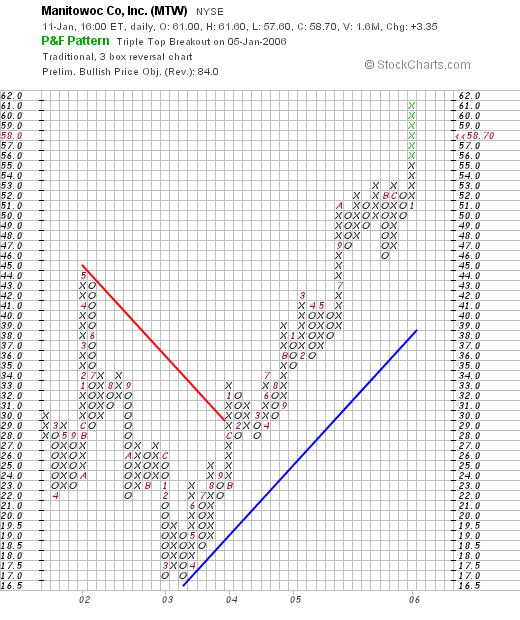
We can see the sell off from the $45 peak in May, 2002, down to a low of $17 in February, 2003. Since that time, the stock has exploded to the upside, charging ahead to its current level around $58.70.
So what do I think? Well, the stock made a great move higher today. The latest quarterly report was superb with all of my "trifecta" findings of increased revenue, earnings, and raised guidance. The Morningstar.com report looks solid, except for a bit of an erratic performance during 2002. Since then, things look much for optimistic. Valuation appears reasonable and the chart looks nice.
It is just that I am not in the market to buy anything now. I am waiting for a "permission slip" with a sale of a portion of one of my holdings at an appreciation target.
If you have any questions or comments, you can reach me at bobsadviceforstocks@lycos.com or go ahead and leave your words on the blog itself.
Bob
Posted by bobsadviceforstocks at 4:03 PM CST
|
Post Comment |
Permalink
Updated: Thursday, 12 January 2006 12:24 AM CST
Monday, 9 January 2006
"Revisiting a Stock Pick" Palomar Medical Technologies (PMTI)
Hello Friends! Thanks so much for stopping by and visiting my blog,
Stock Picks Bob's Advice. As always, please remember that I am an amateur investor so please remember to consult with your professional investment advisors prior to making any investment decisions based on information on this website.
Click
HERE for the PODCAST on PALOMAR MEDICAL TECHNOLOGIES (PMTI)
I was scanning the
list of top % gainers on the NASDAQ today, and came across an 'old favorite' of mine, Palomar Medical Technologies (PMTI), which is trading as I write at $39.05, up $4.37 or 12.60% on the day. I do not own any shares nor do I have any options on this stock.
I first
reviewed PMTI on Stock Picks Bob's Advice on June 15, 2004, when the stock was trading at $14.83. Thus, the stock has appreciated an impressive $24.22 or 163.3% since my first post. Too bad I
didn't buy any shares!
Palomar is on the move today, in part from
Jim Cramer on "Mad Money" who plugged the stock on Friday. But the stock also has criteria that makes it a great investment without this endorsement. However, when we can find stocks that fit the things I screen for, and somebody influential like Cramer comes along and adds an endorsement, that is only a 'plus' for the future price appreciation imho.
Let's take a closer look at this stock and let me show you why I wrote up this company a year-and-a-half ago and why I still like this stock.
First of all, let's review their business. According to the
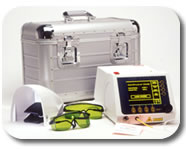
Yahoo "Profile" on PMTI, the company
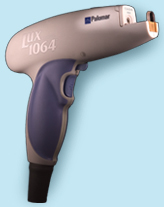
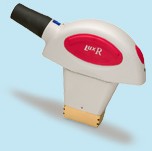
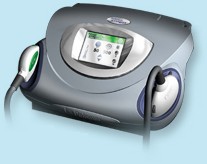
"...engages in the research, development, manufacturing, and distribution of light based systems for hair removal and other cosmetic treatments. It offers products based on technologies that include hair removal, removal of benign pigmented lesions, such as age and sun spots; tattoo removal; acne treatment; wrinkle removal; pseudofolliculitis barbae or pfb treatment; treatment of red pigmentation in hypertrophic and keloid scars; treatment of verrucae, skin tags, seborrheic keratosis; deep tissue heating for relief of muscle and joint pain; noninvasive treatment of facial and leg veins and other benign vascular lesions, such as rosacea, spider veins, port wine stains and hemangiomas; and other skin treatments."
So basically, they treat skin disease problems with a laser.
What about their latest quarterly result? On October 27, 2005, Palomar
reported 3rd quarter 2005 results. Revenues for the quarter ended September 30, 2005, came in at $19.3 million, up 44% from the $13.9 million reported in the same quarter a year ago. Net income for the quarter came in at $4.6 million or $.24/diluted share, up about 100% from the $2.1 million or $.12/diluted share reported in the same quarter last year. This was a very strong report imho.
And what about longer-term results? Looking at the
Morningstar.com "5-Yr Restated" financials, we can see a pretty picture of revenue growth with $13.2 million in revenue reported in 2000, growing steadily to $54.4 million in 2004 and $71 million in the trailing twelve months (TTM).
Earnings have also improved steadily from a loss of $(.97) in 2000, to a profit of $.94 in the TTM. Free cash flow has been improving steadily as well, from $(1) million in 2002 to $11 million in 2004 and $17 million in the TTM.
Morningstar.com shows the balance sheet to be gorgeous with $39.7 million in cash, which by itself can cover the combined $13.6 million in current liabilities and the $-0- of long-term liabilities almost 3x over! In addition, the company has an additional $17.3 million in other current assets per Morningstar. This looks quite solid to me!
And what about valuation? Looking through
Yahoo "Key Statistics" on Palomar for some numbers on this, we find that this is a mid-cap stock with a market capitalization of $660.26 million. The trailing p/e is a bit rich at 42, and the forward p/e (fye 31-Dec-06) is a bit better at 33.24. The PEG ratio (5 yr expected) is 1.44.
According to the
Fidelity.com eResearch website, Palomar is in the "Medical Appliances/Equipment" group, and within this group is priced the most expensive in terms of the price/sales ratio. PMTI tops the list with a ratio of 9.3, followed by St. Jude (STJ) at 7.4, Medtronic (MDT) at 6.7, Zimmer Holdings (ZMH) at 5.3, Biomet (BMET) at 4.7, and Edwards Life Sciences (EW) at 2.6.
Going back to Yahoo for a few more numbers, we can see that there are 16.98 million shares outstanding and as of 12/12/05, there were 3.50 million of them out short representing 22% of the float! This is a short ratio of, get this, 21.8 days! (the short ratio). I use a ratio of 3 days for significance, and I really suspect that Cramer's plug of this stock with the huge short interest probably added to a squeeze of the shorts, and there are likely short-sellers who are trying desparately to cover their short-sales rather frantically as the stock climbs today! (Now all of that last part is just speculation on my part, but the large number of shares out short in the face of a sharp rise in the price can only give one pause!)
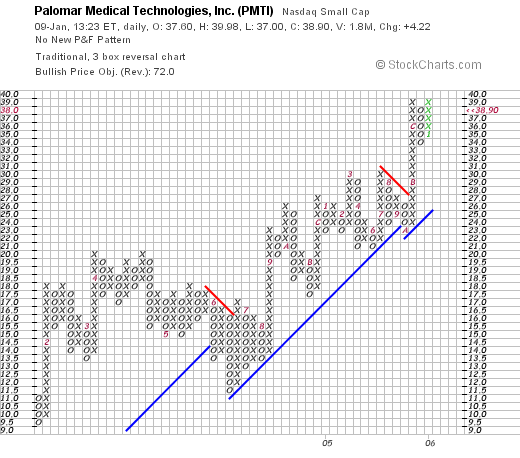
What about the chart? Looking at the
"Point & Figure" chart on Palomar from Stockcharts.com, we can see the sharp rise in price from $9.50/share in January, 2005, to the $38.90 level it is trading at today. The graph looks strong except for a mile sell-off in June, 2004, to the $10.50 level.
So what do I think? Well, I wish I had bought some shares back in 2004! However, the stock still looks strong with a nice move today with LOADS of short-sellers in the stock, the last quarter was strong with both earnings and revenue growth galore, steadily growing earnings and free cash flow and a very solid balance sheet. Valuation is a bit rich with the stock with a Price/Sales ratio in the top of its group, the P/E in the 40's and a PEG at 1.44. However, except for that, most everything else looks solid!
Thanks so much for stopping by! If you have any questions or comments, please feel free to leave them on the blog or email me at bobsadviceforstocks@lycos.com.
Bob
Posted by bobsadviceforstocks at 1:29 PM CST
|
Post Comment |
Permalink
Updated: Thursday, 12 January 2006 12:49 AM CST
Saturday, 7 January 2006
"Looking Back One Year" A review of stock picks from the week of October 25, 2004

Click
HERE for the ***PODCAST*** on SYNERON (ELOS) question and CABOT (CCMP)Hello Friends! Thanks so much for stopping by and visiting my blog,
Stock Picks Bob's Advice. As always, please remember to consult with your professional investment advisors prior to making any investment decisions based on information on this website.

Mitchell Park Domes Milwaukee
One of the tasks that I try to accomplish each weekend (and sometimes do not get around to getting it done!) is to look back about a year earlier on the blog and see how the picks that I have discussed have performed. Of course, this analysis is based on a buy and hold strategy and actually in actual practice, I advocate selling losing stocks quickly and totally at an 8% loss after an initial purchase, and selling gaining stocks slowly and partially at targeted intervals. Thus, actual performance of stock picks will vary depending on the management of those holdings. However, for the purposes of this post, I shall be assuming a buy and hold strategy for evaluating the performance of our pick(s).
 On October 28, 2004, I posted Cabot Microelectronics (CCMP) on Stock Picks Bob's Advice at a price of $37.50. CCMP closed at $30.14 on 1/6/06, for a loss of $(7.36) or (19.63)% since posting.
 On October 27, 20005, Cabot (CCMP) reported 4th quarter 2005 results. Total revenues for the quarter ended September 30, 2005, came in at $73.9 million, up 13.6% from the prior quarter, but down 10.7% from the $82.7 million in revenue in the same period last year. The picture for net income looked even worse, coming in at $8.25 million, down 1% sequentially, and down 37.3% from the $13.17 million in the same quarter a year earlier. Diluted eps came in at $.34, equal to the prior quarter, but down from the $.53/share reported in the fourth quarter of 2004.
Cabot was the only stock I "picked" during this period. Thus, my performance for the week was identical to the single stock owned which was a loss of (19.63)% since posting!
Thanks so much for stopping by. If you have any comments or questions, please feel free to email me at bobsadviceforstocks@lycos.com, or leave your comments and questions right on the blog itself.
Bob
Posted by bobsadviceforstocks at 6:37 PM CST
|
Post Comment |
Permalink
Updated: Sunday, 8 January 2006 11:35 PM CST
A new ***PODCAST*** on Sybron Dental Specialties (SYD)
Hello Friends! Here is the
Link for the ***PODCAST*** on Sybron (SYD). Thanks so much for visiting!
Bob
"Weekend Trading Portfolio Analysis" Sybron Dental Specialties (SYD)

Hello Friends! Thanks so much for stopping by and visiting my blog,
Stock Picks Bob's Advice. As always, please remember that I am an amateur investor, so please remember to consult with your professional investment advisors prior to making any investment decisions based on information on this website.

I am continuing my review of stocks in my trading portfolio this evening. Last weekend I
reviewed St. Jude Medical (STJ) on Stock Picks Bob's Advice. Going alphabetically, Sybron Dental Specialties (SYD) is next!
I currently own 113 shares of SYD which closed Friday, January 6, 2006, at $41.38, up $.38 or .93% on the day. I have a cost basis of $25.84 on these shares which were acquired 11/18/03, representing a gain of $15.54 or 60.1%. I have sold shares twice previously, at the 30% and 60% gain targets and thus am waiting for the stock to appreciate to a 90% gain before selling 1/6th of remaining shares (1.9 x $25.84 = $49.10) or to drop back to the 30% gain level (1/2 of my highest sale point thus far; or 1.3 x $25.84 = $33.59) prior to selling
all of my remaining shares of SYD.
Let's take a closer look at Sybron (SYD).
First of all, according to the
Yahoo "Profile" on Sybron Dental, the company
"...through its subsidiaries, engages in the manufacture and sale of dental products in the United States and other countries. It offers various products for the dental profession, including orthodontics, endodontics, and implantology, as well as various infection prevention products for use by the medical profession."
Let's take a look at the latest quarterly results. On December 12, 2005, SYD
reported 4th quarter 2005 results. Net sales for the quarter ended September 30, 2005, grew 17% to $170.4 million compared with $145.7 million in net sales for the prior year same period. Net income for the quarter was $21.5 million, a 33.5% increase over net income of $16.1 million the prior year. Fully diluted earnings per share came in at $.52/share in the quarter, up 30.0% over the fully diluted earnings of $.40/share in the same quarter last year.
And what about longer-term? Is the record still intact? Looking at the
Morningstar.com "5-Yr Restated" financials for SYD, we can see the steady growth in revenue intact, increasing from $439.5 million in 2001 to $649.7 million in the trailing twelve months (TTM). Earnings have increased steadily from $.81/share in 2002 to $1.85/share in 2005. Free cash flow is solidly positive with $78 million reported in 2003 and $81 million in 2005.
The balance sheet is good if not spectacular with $58.6 million in cash and $225.4 million in other current assets, enough to easily cover the $92.5 million in current liabilites and to pay off a great deal of the $255.8 million in long-term liabilities.
And what about valuation numbers? Looking at
Yahoo "Key Statistics" on Sybron Dental, we find that this is a mid cap stock with a market capitalization of $1.67 billion. The trailing p/e is reasonable at 22.37, with a forward p/e (fye 30-Sep-07) of 18.81. However, the anticipated earnings growth rate is still not as great as the p/e and we find a PEG of 2.02.
Looking at valuation from the perspective of the Price/Sales ratio, we find on
fidelity.com eResearch website, that Sybron is quite reasonably priced in the "Medical Instruments/Supplies" Industrial Group. Topping this group is Alcon (ACL) with a Price/Sales ratio of 10, followed by Guidant (GDT) at 6.1, Stryker (SYK) at 3.9, and Boston Scientific (BSX) at 3.4. Sybron (SYD) is next at 2.6 followed by Baxter (BAX) at 2.5.
With some additional numbers from Yahoo, we can see that there are 40.41 million shares outstanding and as of 12/12/05, there were 1.41 million shares out short representing 3.50% of the float or 6.1 trading days of volume (the short ratio). This appears significant, and being over my arbitrary 3 day level, may contribute to a short squeeze if the conditions are appropriate.
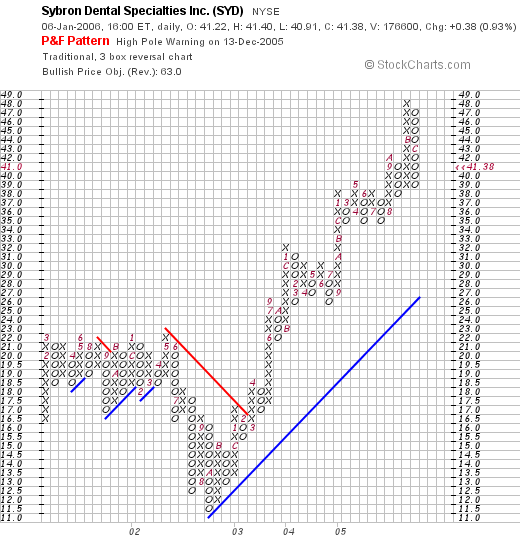
And the chart? Looking at a
"Point & Figure" chart on SYD from Stockcharts.com, we can see that the stock appeared to be trading weakly when it declined in May, 2002, from $22 to a low of $11.50 in September, 2002, but then since that time, after breaking through resistance at $16 in March, 2003, the stock has been trading strongly higher to the upside. The graph looks quite strong to me!
So what do I think? Well, it looks solid enough to keep on owning the stock :). In any case, the latest quarter was solid, Morningstar.com looked reasonable, the valuation was a bit rich based on PEG but not on Price/Sales and the chart looks nice!
Thanks so much for stopping by and visiting my blog! If you have any comments or questions, please feel free to leave them right here on the blog or feel free to email me at bobsadviceforstocks@lycos.com.
Bob
Friday, 6 January 2006
A New ***PODCAST*** on AngioDynamics (ANGO)
Hello Friends! Here is the
***PODCAST*** for AngioDynamics (ANGO). If you have any comments or questions, please feel free to reach me at bobsadviceforstocks@lycos.com.
Bob
January 6, 2006 AngioDynamics (ANGO)
Hello Friends! Thanks so much for stopping by and visiting my blog,
Stock Picks Bob's Advice. As always, please remember that I am an amateur investor, so please remember to consult with your professional investment advisors prior to making any investment decisions based on information on this website.

Earlier today I had the good fortune of hitting a sale point on my Meridian Biosciences (VIVO) stock and I sold a 1/6th of my position at a 120% gain. Besides being a terrific performer for me, this sale was also a "signal" that I use in my portfolio management strategy of 'listening to my portfolio' to decide whether to be adding to equity or moving from equity into cash. Since I am below my 25 maximum positions then this sale at 'good news' meant that I could add a new position. And that nickel started burning a hole in my pocket right away!
Earlier today, Angiodynamics (ANGO) was on the
list of top % gainers on the NASDAQ, and meeting most of my criteria, I went ahead and purchased 240 shares of this stock at an average cost of $26.22 in my Trading Account. By the end of the day, even though ANGO closed strongly higher, other stocks had squeezed this one off the list. ANGO closed at $26.28/share, up $2.09 or 8.64% on the day.
And what
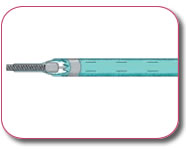
does ANGO actually do? According to the
Yahoo "Profile" on AngioDynamics (ANGO), the company
"...engages in the design, development, manufacture, and marketing of medical devices for the minimally invasive diagnosis and treatment of peripheral vascular disease. Its products include angiographic catheters, hemodialysis catheters, plasma thromboplastin antecedent dilation catheters, thrombolytic products, image-guided vascular access products, endovascular laser venous system products, and drainage products.
And the latest quarterly results? On December 19, 2005, ANGO
reported 2nd quarter 2006 results. Net sales for the quarter ended November 26, 2005, grew 30% to $18.7 million, up from $14.4 million in the same quarter the prior year. Net income for the quarter came in at $1.7 million or $.13/diluted share, up 60% in net income from $1.04 million the prior year, and up 44% in diluted earnings per share from $.09 in the same quarter last year.
And how about longer-term results? Reviewing the
Morningstar.com "5-Yr Restated" financials on AngioDynamics, we can see the steady growth in revenue from $23.4 million in 2001 to $63.6 million in the trailing twelve months (TTM).
Earnings reports start in 2005 (AngioDyanmics had an IPO at $11 in 6/2004), and show that ANGO earned $.37/share in 2005 and $.41/share in the TTM. Free cash flow has been improving with $(3) million in 2003, improving to $1 million in 2004, $3 million in 2005 and $4 million in the TTM.

The balance sheet as reported by Morningstar.com appears solid to me with $28.8 million in cash alone reported, enough to cover both the $6.4 million in current liabilitis
and the $2.9 million in long-term liabilities approximately 3x over! In addition, the company is reported to have $22.2 million in other current assets.
What about valuation? Looking at
"Key Statistics" on AngioDynamics from Yahoo, we can see that this is a small cap stock with a market capitalization of only $321.43 million. The trailing p/e is a rich 58.79, and the forward p/e (fye 28-May-07) is still a bit rich at 36.50. However, with a strong "5 yr expected" earnings growth, the PEG comes in at 1.27, not much over 1.00.
Within the industrial group of "Medical Instruments/Supplies", AngioDynamics (ANGO) comes in somewhere in the middle of the pack in terms of the Price/Sales ratio according to the
Fidelity.com eResearch website. At the top of the list is Alcon, with a Price/Sales ratio of 9.9, followed by Guidant (GDT) at 6.1, then AngioDynamics (ANGO) at 4.9, Stryker (SYK) at 3.9, Boston Scientific (BSX) at 3.3, and Baxter Int'l (BAX) at 2.4.
Looking back at Yahoo for some additional numbers, we find that there are 12.23 million shares outstanding. Of these, as of 11/10/05, there were 195,920 shares out short representing 2% of the float or 2 trading days of volume (the short ratio). This doesn't look like a lot of shares out short as of the last report available on Yahoo.
The company does not pay a dividend and no stock splits are reported.
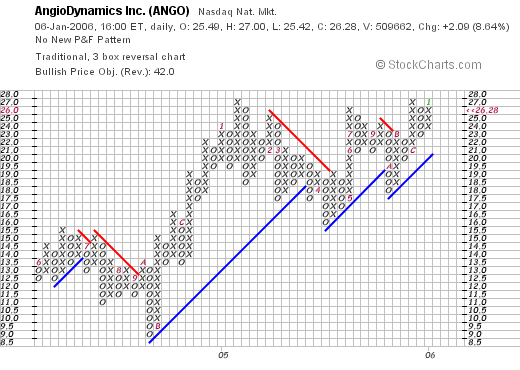
And how about a chart? Looking at a
"Point & Figure" chart on AngioDynamics from Stockcharts.com, we can see that this stock traded as high as $15.5 in June, 2004, and then traded lower to $9.00/share in October, 2004. Since that period of time, the stock has been steadily moving higher in a saw-tooth pattern with higher lows and now has broken out higher at the $27 region. The chart looks strong to me, yet not over-extended in valuation.
So what do I think? Well as you know I liked the stock enough to buy some shares! The stock made a nice move higher today, has a great latest quarterly report, a nice Morningstar.com report which except for the limited time period of earnings reported, shows strong and steady revenue growth, growing earnings, increasing free cash flow, and a solid balance sheet. Valuation-wise the p/e is rich but the PEG suggests that the stock isn't as over-valued as one might think. And the Price/Sales ratio is midway in its group. Technically, the stock chart looks strong with the stock showing price momentum towards a higher price, with what appears to be a measured appreciation.
Anyhow, that's the rest of the story as Paul Harvey might say! If you have any questions or comments, please feel free to leave them on the blog or email me at bobsadviceforstocks@lycos.com.
Bob
"Trading Transparency" VIVO and ANGO
Hello Friends! Thanks so much for stopping by and visiting my blog,
Stock Picks Bob's Advice. As always, please remember that I am an amateur investor, so please remember to consult with your professional investment advisors prior to making any investment decisions based on information on this website.

Wisconsin Dells and "Ducks" Boat
As many of you probably know, I like to post ideas for investment on this blog and share with you my actual trading portfolio. I manage my portfolio with targeted sales, selling entire positions on "bad news" or declines in the stock price, and selling portions (currently 1/6 of holding) at targeted appreciation levels.
Currently my appreciation targets for sales are at 30, 60, 90 and 120% appreciation, then 180, 240, 300, and 360%, and then 450%, 540%.... Earlier today, my Meridian Biosciences hit a targeted appreciation level and I sold 43 shares (approximately 1/6th of my holding of 253 shares) at $24.52. I purchased these shares 4/21/05 with a cost basis of $11.13. Thus, I had a gain of $13.39/share or 120.3%. This was my fourth sale of VIVO on this original purchase (I had briefly owned shares in April/May, 2004), and thus my targeted appreciation level was at 120% (having previously sold shares at 30%, 60%, and 90% levels).
On the upside, my next targeted sale will be a 1/6th position at a 180% level, which would be 2.8 x $11.13 = $31.64, or at a 60% appreciation level on the downside (1/2 of my top gain which would be the sale today at the 120% level) or 1.60 x $11.13 = $18.08.
Having sold a portion of one of my holdings at a gain, and being under my maximum number of positions I have planned (25), this "entitled" me to add a new position. And as I like to say, that nickel started burning a hole in my pocket right away (!) and looking through the top % gainers list I came across Angiodynamics (ANGO), which I shall write up later today, and it appeared to fit my criteria and I purchased 240 shares of this company at an average price of $26.21.
Anyhow, that's the update for now. I shall get cracking on the ANGO write-up. Regards!
If you have any questions or comments, please feel free to leave them on the blog or email me at bobsadviceforstocks@lycos.com.
Bob
Thursday, 5 January 2006
A ***PODCAST*** for True Religion Apparel (TRLG)
Hello Friends! Here is the
***PODCAST*** for TRUE RELIGION (TRLG). Thanks for stopping by!
Bob
January 5, 2006 True Religion Apparel (TRLG)
Hello Friends! Thanks so much for stopping by and visiting my blog,
Stock Picks Bob's Advice. As always, please remember that I am an amateur investor, so please remember to consult with your professional investment advisors prior to making any investment decisions based on information on this website.

I was looking through the
list of top % gainers on the NASDAQ tonight and came across True Religion (TRLG), which closed at $19.40, up $2.54 or 15.07% on the day. I do not own any shares of this stock, nor do I own any options.
According to the
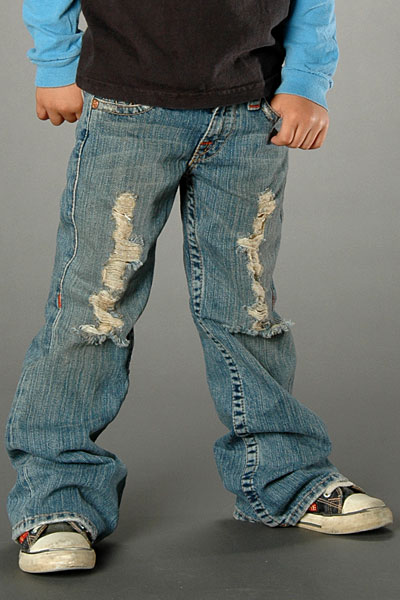
Yahoo "Profile" on TRLG, the company,
"...through its wholly owned subsidiary, Guru Denim, Inc., engages in the design, development, manufacture, marketing, distribution, and sale of fashion jeans and other apparel. Its products include jeans, skirts, denim jackets, and tops. The company also operated a retail store in Manhattan Beach, California, as of December 5, 2005."
As reported, the stock price surged after a trio of brokerage firms
issued favorable reports on the company.
As is my strategy, let's take a look at the latest quarterly report. On November 10, 2005, TRLG
reported 3rd quarter 2005 results. For the quarter ended September 30, 2005, net sales increased to $35.0 million compared with $7.4 million in the same quarter last year. Net income grew from $954,000 to $7.4 million this year. On a per share basis, this came in at $.33/diluted share, up sharply from $.05/diluted share last year. On top of a great earnings report the company went ahead and raised sales and earnings guidance for fiscal 2005.
How about longer-term? For that, I like to review the Morningstar.com results. Looking at the
Morningstar.com "5-Yr Restated" financials on True Religion, we can see the rapid growth of this very young company from $2.4 million in sales in 2003 to $27.7 million in 2004 and $90.7 million in the trailing twelve months (TTM).
The limited earnings history shows earnings/share of $.20 in 2004 and $.79/share in the TTM. Free cash flow was $0 in 2002, $(1) million in 2003, $1 million in 2004 and $8 million in the TTM.
The balance sheet as presented on Morningstar.com looks solid with $10.5 million in cash, enough to cover both the $8.2 million in current liabilities and $.1 million in long-term liabilities combined. In addition, the company has an additional $26.5 million in other current assets.

What about some valuation 'numbers'? Reviewing the
Yahoo "Key Statistics" on True Religion, we can see that this is a small cap stock with a market capitalization of $428.57 million. The trailing p/e is a moderate 24.04 with a forward p/e (fye 31-Dec-06) of only 16.30. Thus, with the rapid earnings growth, the PEG (5 yr estimated) comes in at a dirt cheap 0.60.
Yahoo reports the Price/Sales ratio at 4.11. Checking the
Fidelity eResearch website, we find that TRLG is in the "Textile-Apparel Clothing" Industrial Group. The company is the richest in valuation in terms of Price/Sales with a ratio over 4.0. Next is Guess? (GES) AT 1.9, Polo Ralph Lauren (RL) at 1.7, Columbia Sportswear (COLM) at 1.6, Quiksilver (ZQK) at 1.1, and Hot Topic (HOTT) at 0.9 at the bottom of the list.
What about some additional Yahoo numbers? The company has 22.09 million shares outstanding with 4.06 million shares out short as of 11/10/05, representing 30.90% of the float or 9 trading days of volume. This is significant imho, with 3 days as my cutoff. The current rise in the stock price may well be partially due to a "squeeze" of the short sellers. No cash dividend is paid and no stock splits are reported on Yahoo.
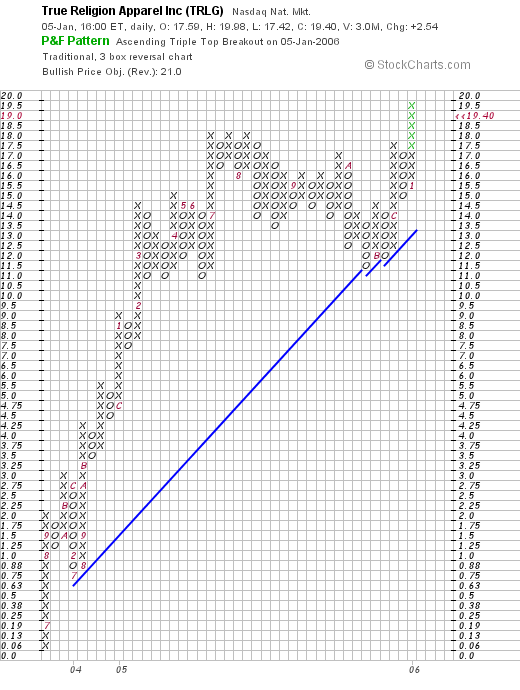
And what does the chart look like? If we look at a
"Point & Figure" chart on TRLG from Stockcharts.com we can see the virtual explosion in the stock price from $.06/share in June, 2003 to a peak of $18.50/share in July, 2005. The stock moved sideways over the past six months consolidating in price and only this month has once again moved strongly to the upside.
So what do I think? Well, the stock made a great move higher today. The latest quarterly result was incredible with revenue and earnings up 600%, the Morningstar.com report looks nice if incredibly short. The company is generating free cash flow and has a solid balance sheet. Valuation-wise the p/e looks reasonable and the PEG is under 1.0. The Price/Sales ratio does appear a bit rich and the chart looks strong. Overall, this is an interesting stock. One downside, my son told me he thought this concept was a bit old and I was late with this stock. Time will tell!
Thanks so much for stopping by and visiting! If you have any questions or comments, please feel free to leave them on the blog or email me at bobsadviceforstocks@lycos.com.
Bob
Posted by bobsadviceforstocks at 9:52 PM CST
|
Post Comment |
Permalink
Updated: Wednesday, 1 February 2006 3:24 PM CST
Newer | Latest | Older


