Stock Picks Bob's Advice
Friday, 28 April 2006
AngioDynamics (ANGO) "Revisiting a Stock Pick"
Hello Friends! Thanks so much for stopping by and visiting my blog,
Stock Picks Bob's Advice. As always, please remember that I am an amateur investor, so please remember to consult with your professional investment advisors prior to making any investment decisions based on information on this website.

Earlier today, as I noted in another post, I purchased 200 shares of AngioDynamics (ANGO) at $30.24/share. AngioDynamics (ANGO) closed at $2.91, up 10.33% on the day.
I recently had ANGO in my 'trading portfolio' and in fact,
reviewed AngioDynamics on Stock Picks Bob's Advice on February 11, 2006, a little over two months ago.

I purchased 240 shares of AngioDynamics at a cost of $26.26 on 1/6/06. These shares were sold on 3/2/06, last month (!), at a price of $23.46, for a loss of $(2.80) or (10.6)%. Showing up again on the list of top % gainers, and having a 'permission slip' to add a new position having sold 1/6th of my Ventana (VMSI) at a 90% gain, I decided to give ANGO another shot!
Let's review some of the latest information on this company and see if it is worth another purchase.
1. What does this company do?According to the
Yahoo "Profile"on AngioDynamics, the company
"...engages in the design, development, manufacture, and marketing of medical devices for the minimally invasive diagnosis and treatment of peripheral vascular disease. Its products include angiographic catheters, hemodialysis catheters, plasma thromboplastin antecedent dilation catheters, thrombolytic products, image-guided vascular access products, endovascular laser venous system products, and drainage products."
 2. How did the company do in the latest quarter?
On March 21, 2006, AngioDynamics
reported 3rd quarter 2006 results. For the quarter ended February 25, 2006, net sales increased 28% to $19.8 million, up from $15.5 million in the same quarter the prior year. Net income for the quarter was $1.9 million or $.14/diluted share, up 73% from $1.09 million the prior year and up 56% from the $.09/diluted share reported in the same quarter last year. To finish out what I call a "trifecta" in earnings reports, the company raised guidance stating:
"The Company is revising upwards its fiscal 2006 financial guidance. AngioDynamics now expects net sales growth to exceed 29% over fiscal 2005, to at least $78.0 million. Year-over-year net income growth is expected to exceed 60%, to $7.3 million, which includes an anticipated one-time charge totaling $400,000, net of income taxes, to be incurred in connection with the Company's requirement to comply by May 2006 with Section 404 of the Sarbanes-Oxley Act. This compares with the Company's prior guidance for net sales of at least $76.0 million, and net income of at least $6.7 million for fiscal 2006. The Company now expects its earnings per diluted share to increase to $0.57 for fiscal 2006, compared with its prior guidance of $0.52 per diluted share."
 3. How about longer-term results?
Reviewing the
Morningstar.com "5-Yr Restated" financials on ANGO, we see the steady progression in revenue from $23.4 million in 2001 to $60.3 million in 2005 and $72.2 million in the trailing twelve months (TTM). We have only two years of earnings to examine: the company reported $.37/share in 2005 and $.50/share in the TTM. Total shares were 12 million in 2005 and 13 million in the TTM.
Free cash flow is now positive and has been improving, with $(3) million in 2003, $1 million in 2004, $3 million in 2005 and the TTM.
The balance sheet is solid with $28.9 million in cash, enough by itself to pay off the combined $10.1 million in current liabilities and the $2.8 million in long-term liabilities more than 2x over. When combined with the $27.2 million in other current assets, the current ratio is calculated at 5.55. This looks solid to me!
4. How about some valuation numbers on this company?
Looking through the
Yahoo "Key Statistics" on ANGO, we find that this is a small cap stock with a market capitalization of only $388.50 million. The trailing p/e is rich at 61.52. The forward p/e (fye 28-May-07) is estimated at 41.43. However, with the rapid '5 yr expected' earnings growth, the PEG is a reasonable 1.39.
The company appears rather richly valued by Price/Sales ratio according to the
Fidelity.com eresearch website. Fidelity reports AngioDynamics with the richest Price/Sales ratio in the group of "Medical Instruments/Supplies" industrial group. AngioDynamics (ANGO) leads the group with a Price/Sales ratio of 5.1. This is followed by Stryker (SYK) at 3.7, Boston Scientific (BSX) at 3.1, Becton Dickinson (BDX) at 2.9, Baxter (BAX) at 2.4, and Bausch & Lomb (BOL) at 1.2. Certainly, by this measure, ANGO is not a screaming bargain.
Referring back to Yahoo, we find that there are only 12.50 million shares of this company outstanding with 10.23 million that float. Of these shares, 187,230 or 1.60% of the float was out short as of 3/10/06, representing 2.4 trading days of volume (the short ratio). This does not appear to be much of a factor imho. No cash dividends and no stock dividends are reported on Yahoo.
5. What does the chart look like?Looking at the
"Point & Figure" chart on AngioDynamics from StockCharts.com:
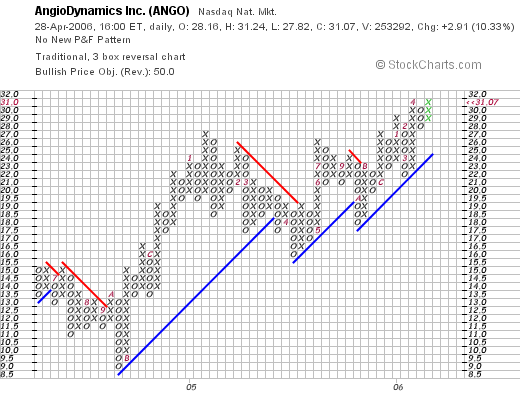
We can see that the stock which was trading at $15/share in June, 2004, dropped to a low of $9.00/share in October, 2004, and since then, through fits and starts has been heading higher to the current $31.07 level. The chart looks strong to me but not over-extended.
6. Summary
So what do I think? Well, I liked this stock enough to take another position in this stock even after being stopped out last month at a loss! The latest quarter was very nice with the company even boosting guidance. The Morningstar record is also solid but there isn't a long record of increasing earnings as it appears that this company has not been public too long (a negative). However, revenue has been growing nicely, and whatever results on earnings shows steady growth. Free cash flow is now positive and growing and the balance sheet looks nice.
Valuation-wise, the p/e is rich although the PEG at under 1.5 isn't too bad. The Price/Sales ratio is also rich with the company at the top of its group. Finally, the chart looks nice.
I basically like this company that is doing just fine. Hopefully, the stock price will cooperate better allowing me to stay a little longer than last time!
Thanks so much for stopping by! If you have any comments or questions, please feel free to leave your comments on the blog or email me at bobsadviceforstocks@lycos.com. Also feel free to listen to my January 6, 2006 PODCAST on ANGO. Please excuse a few technical glitches on this early podcast of mine. For a list of all of my podcasts, be sure to come and visit my Stock Picks PODCAST Website.
I hope you all have a wonderful weekend!
Bob
"Trading Transparency" ANGO
Hello Friends! Thanks so much for stopping by and visiting my blog,
Stock Picks Bob's Advice. As always, please remember to check with your professional investment advisors prior to making any investment decisions based on information on this website.
I have had a very busy Friday! After selling my 300 shares of Dynamic Materials (BOOM) that I bought yesterday (!), and selling a 1/6th position of my Ventana (VMSI) that hit a 90% appreciation point, this gave me "permission" to add a new position (being under my 25 position maximum).
Looking through the list of top % gainers I came across AngioDynamics (ANGO) a stock that I owned about 6 weeks ago, and had sold. The stock still met criteria, and deciding to give it another go (?), I bought 200 shares at $30.24. As I write, ANGO is trading at $31.00, up $2.84 or 10.09% on the day.
Anyhow, that's how it all worked out! Thanks so much for stopping by. If you have any comments or questions, please feel free to leave them on the blog or email me at bobsadviceforstocks@lycos.com. Please also be sure to visit my
Stock Picks Bob's Advice Podcast Site where you can listen to me talk about many of the stocks I discuss on my blog.
If I get a chance, I shall try to write up something about this ANGO trade in greater detail this weekend.
Bob
"Trading Transparency" BOOM
Hello Friends! Thanks again for visiting my blog,
Stock Picks Bob's Advice. As always, please remember that I am an amateur investor, so please remember to consult with your professional investment advisors prior to making any investment decisions based on information on this website.
Not wishing to mix apples and oranges in my trading account, and not wishing to NOT buy a new position, I undid my 300 share purchase of BOOM a few moments ago, selling them at $38.17. I had added these 300 shares with a cost basis of $36.89 yesterday on a strong belief that the selling was totally overdone. I was right. I made my point. I made a few $'s. And I am back on the wagon. LOL.
Back to disciplined purchases and sales :).
Anyhow, I am back in the market for a new position now since I
did sell my Ventana at a gain target!
Bob
"Trading Transparency" Ventana Medical Systems (VMSI)
Hello Friends! Thanks so much for stopping by and visiting my blog,
Stock Picks Bob's Advice. As always please remember that I am an amateur investor, so please remember to consult with your professional investment advisors prior to making any investment decisions based on information on this website.
Earlier this morning, I sold 37 shares of my Ventana Medical Systems (VMSI) stock at $46.49. These shares were purchased 4/16/04 with a cost basis of $23.47/share. Thus I had reached an actual gain of $23.02 or 98% since my purchase. This exceeded my 90% appreciation target, so I sold 1/6th of my holding. This was my third partial sale of my Ventana stock, having sold 50 shares 11/29/04 and 75 shares on 4/4/05.
In general this entitles me to add a new position to my portfolio. However, I am thinking about unloading my new 300 shares of BOOM, otherwise my margin will begin excessive. BOOM is moving higher today as the sell-off yesterday was overdone. I don't want to mix up my portfolio management system too badly, so I am thinking hard about this last trade with Dynamic Materials.
I shall keep you posted :).
Bob
Thursday, 27 April 2006
"Trading Transparency" BOOM---Breaking ALL of my Rules!!!
Hello Friends! Thanks so much for stopping by and visiting my blog,
Stock Picks Bob's Advice. As always, please remember that I am an amateur investor, so please remember to consult with your professional investment advisors prior to making any investment decisions based on information on this website. A few minutes ago I lost my cool. I am just about as human as the next guy (?) I guess. In the midst of a massive decline in Dynamic Materials (BOOM) I went ahead and purchased 300 shares. Let's just call this an experiment (?). The company reported fabulous earnings. An announcement was made by France's Group SNPE that they will be selling 5.15 million shares and the stock price literally fell through the floor. I don't see anything
fundamentally wrong with the stock. Maybe I am missing something. It appears that all of the momentum players threw in the towel. Anyhow, on a lark, I put on my contrarian hat, dropped all of my trading rules (YIKES!) and purchased 300 shares at 36.856. I plan on sticking with all of the remaining rules....but every once in awhile....I mean what IS an investor supposed to do? If you have any words of encouragement, condemnation, questions or humor, drop me a line at bobsadviceforstocks@lycos.com or leave them on the blog. Happy Trading everyone! Bob
Posted by bobsadviceforstocks at 2:57 PM CDT
|
Post Comment |
Permalink
Updated: Thursday, 27 April 2006 6:55 PM CDT
Wednesday, 26 April 2006
j2 Global Communications (JCOM) Revisiting a Stock Pick
Hello Friends! Thanks so much for stopping by and visiting my blog,
Stock Picks Bob's Advice. As always, please remember that I am an amateur investor so please remember to consult with your professional investment advisors prior to making any investment decisions based on information on this website.

I was looking through the
list of top % gainers on the NASDAQ this evening from trading earlier today, and came across j2 Global Communications (JCOM) which closed at $49.40, up $3.76 or 8.24% on the day.
I wanted to write this one up before I crashed for the night, because it really, truly, is an
old favorite of mine! I do not own any shares or options on this stock. However, I
posted JCOM on Stock Picks Bob's Advice on May 14, 2003. This was my second selection on the blog (!) the first being St. Jude Medical (STJ) which I recently sold on weakness. Being rather new at the blog, I forgot even to mention the stock price on that date. Looking up for
historic prices of JCOM on Yahoo, I discovered that JCOM closed at $34.93 on May 14, 2003, or $17.47 adjusted for a 2:1 stock split on September 2, 2003. Thus, I actually have a "gain" on the stock pick price of $31.93 or 182.8% since posting!
But let's take a brief look at this stock and see why it deserves another 'revisit'!
1. What does the company do?According to the
Yahoo "Profile" on JCOM, the company
"...provides outsourced and value-added messaging and communications services worldwide. It offers faxing and voicemail solutions; document management solutions; hosted email, email perimeter protection, and email marketing services; call management; and conference calling services."
2. How did the company do in the latest quarter?Just yesterday, April 25, 2006, JCOM
reported 1st quarter 2006 results. For the first quarter ended March 31, 2006, revenues grew 30% to $42.0 million from $32.2 million in the same quarter the prior year. Net earnings came in at $12.3 million or $.48/diluted share compared with net earnings the prior year same period of $10.2 million or $.40/diluted share.
The company reaffirmed previous revenue guidance of $43.6 -$44.6 million for second quarter 2006 revenue with "non-GAAP EPS of $.55-$.57/share". (non-GAAP EPS came in at $.52/share the just-reported quarter for comparison). In addition, in a move appreciated by stock investors, the company announced, subject to stockholder approval, a 2:1 stock split. This doesn't really add any real 'value' to a stock, but it is still an indication of confidence by management and is often appreciated by investors who like to psychologically see those numbers of shares grow :).
3. How about longer-term results?Reviewing the
"5-Yr Restated" financials from Morningstar.com, we can see the rapid and steady revenue growth of this company from $33.3 million in 2001 to $143.9 million in 2005.
Earnings have been a bit more erratic, with a loss of $(.35)/share reported in 2001, increasing to a gain of $1.42 in 2003, dropping to $1.27 in 2004 and growing to $2.00/share in 2005. The number of shares outstanding has been fairly steady with 23 million reported in 2001 increasing to 25 million shares in the trailing twelve months (TTM).
Free cash flow has been positive and growing with $29 million in 2003, $44 million in 2004 and $55 million in 2005.
The balance sheet as presented on Morningstar looks great with $112.8 million in cash, enough to cover the $18.2 million in current liabilities more than 5 times over, without even including the $14.7 million in other current assets. Thus, the 'current ratio' works out to 7! The company reports a tiny $100,000 in long-term liabilities per Morningstar.
4. How about some valuation numbers on this stock?Reviewing
Yahoo "Key Statistics" on j2 Global Communications, we find that this company is a mid-cap sized company with a market cap of $1.23 billion. The trailing p/e isn't bad at 24.65 (imho), and the forward p/e (fye 31-Dec-07) is even nicer at 17.27. Thus, the "5 yr expected" PEG works out to what I would call a dirt-cheap 0.79 level.
According to the
Fidelity.com eresearch website, JCOM is in the "Internet Software & Services" industrial group. Within this group, JCOM is priced midway in terms of the Price/Sales ratio which works out to 8.1 for JCOM. Leading this group is Salesforce.com (CRM) at 13.5, Ebay (EBAY) at 10.1, followed by JCOM at 8.1, then Symantec (SYMC) at 4.9, VeriSign (VRSN) at 3.9 and Internet Security Systems (ISSX) at 3.1. Thus, JCOM appears to be valued in an average fashion by this ratio.
Looking for some more numbers from Yahoo, we find that there are 24.81 million shares outstanding with 23.05 million of them that float. Currently there are 4.78 million shares out short (as of 3/10/06), up from 4.44 million shares the prior month. This is a relatively large number for this company representing 20% of the float or 9.4 trading days of volume (the short ratio). With the latest strong earnings report, and now the announcement of a stock split, this may panic the short-sellers who may well be scrambling to buy shares to cover those borrowed and already sold. Just my take on it I guess :).
5. What about a chart?Looking at a
"Point & Figure" chart on JCOM from StockCharts.com:
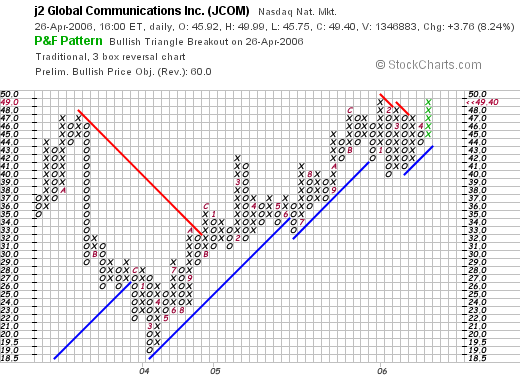
We can see that the stock actually broke down between October, 2003, when it was trading at $47.00 down to a low of $19.00 in February, 2004. However, from that low in early 2004, the company stock has been bullishly been moving higher to the current level of $49.40, higher than the levels reached in late 2003.
6. So in summary, what do I think about this stock now?
Well, quite frankly, I find the company very interesting! I am not in a position to be buying any stocks, but if I were, it would be the kind of stock I would be buying. The stock moved ahead strongly today on the back of a very solid earnings report. They announced a 2:1 stock split, and re-affirmed strong earnings and revenue growth. The Morningstar.com evaluation looks strong for the past several years and free cash flow is positive and growing. The company is flush with cash and has little debt and valuation isn't bad with a p/e in the low 20's and a PEG under 1.0. The Price/Sales ratio is a tad rich, but for the group, nothing special. On top of this there are loads of people betting against this stock and they are likely in a bit of a panic right now as the company stock price charges ahead and a split has been announced. Finally the chart looks fine to me.
Thanks again for stopping by and visiting my blog. If you have any comments or questions, please feel free to leave them on the blog or email me at bobsadviceforstocks@lycos.com. Also, remember to stop by and visit my Stock Picks Bob's Advice Podcast Site.
Bob
A Reader Writes "...your advice on a company called Lamson & Sessions."
Hello Friends! Thanks so much for stopping by and visiting my blog,
Stock Picks Bob's Advice. As always please remember that I am an amateur investor, so please remember to consult with your professional investment advisors prior to making any investment decisions based on information on this website.

I had a nice email earlier today. It reminded me how disorganized my blog really is. How difficult it can be to search throught it. My son Ben is probably right! He says I should get it fixed up. That maybe it has some real potential.
I am currently working on developing a new "Stock Picks" format. If all goes well, I shall have more for you on this in the near future!
Meanwhile, remember to use Google and search through the blog by entering in the words "Stock Picks Bob's XXXX" where xxxx represents the symbol for the name of the stock you are investigating. Usually, but not always, I will be near the top of the search engine...
Anyhow, Jeff was kind enough to drop me a line:
"Bob,
I would like your advice on a company called Lamson Sessions (Symbol LMS). The company is a maker of electrical products used in construction and the telecom industry.
The company just raised guidance and is set to report a blockbuster quarter on Friday, April
28th. It seems to have the qualities that you look for when you are selecting stocks.
Please advise as I appreciate your insight.
Sincererly,
Jeff in Indiana"
Well Jeff, thank you again for writing! In fact, LMS is a favorite of mine! I
wrote up Lamson & Sessions on Stock Picks Bob's Advice on November 28, 2005, when the stock was trading at $23.70. Not only that (!), but I even did a
podcast on Lamson & Sessions the same day! It has been my policy
not to repeat my "revisits" for at least a year. But with LMS, let me make a bit of an exception and take another brief look at the stock! I do not own any of this stock nor do I have any options.

First of all, LMS closed today at $25.90, up $1.10 or 4.44% on the day. Thus the stock has actually appreciated $2.20 or 9.3% since my original post.
 1. What does this company do?
According to the
Yahoo "Profile" on Lamson & Sessions, the company
"...engages in the manufacture and distribution of thermoplastic electrical, consumer, telecommunications, and engineered sewer products primarily in the United States, Canada, and Caribbean. It operates in three segments Carlon, Lamson Home Products, and PVC Pipe."
2. How did the company do in the latest quarter?On February 16, 2006, the company reported
reported 4th quarter 2005 results. Net sales for the quarter ended December 31, 2005, increased 48% to $143.3 million from $97.1 million in the same quarter the prior year. Net income came in at $14.6 million or $.93/share in the quarter representing a 1000% increase over the $1.3 million or $.09/diluted share in the same quarter the prior year. These were great results!
As Jeff pointed out in his email, LMS has even
raised guidance for first quarter 2006, with earnings now expected at $.53-$.56/share, up from the $.41-$.44/share previous guidance. Net sales are now expected to be $132 to $135 million, up from the prior guidance of $123 million to $127 million previously announced. This is another strong point for the stock and the company imho.
3. How about "longer-term"?
Taking a look at the
Morningstar.com "5-Yr Restated" financials on LMS, we can see that revenue dipped from $350.9 million in 2001 to $312.4 million in 2002. However, since 2002, revenue has steadily improved to the $494.2 million reported in 2005.
Earnings also dipped from a loss of $(.28) in 2001 to a loss of $(2.99) in 2002. After that, LMS turned profitable at $.07/share in 2003, and has had earnings improve strongly to $1.82/share in 2005. The number of shares has been very stable with 14 million reported in 2001 and increasing only to 15 million in the trailing twelve months (TTM).
Free cash flow has been positive and improving nicely, with $1 million in 2003, increasing to $5 million in 2004 and $20 million in 2005.
The Morningstar report shows that the company has only $1.2 million in cash, but has $128.0 million in other current assets. Balanced against the $72.0 million in current liabilities gives us a "current ratio" of 1.79. This appears healthy with my cut-off as I have reviewed elsewhere of 1.5. The company has an additional $77.7 million in long-term liabilities.
 4. What about some 'valuation' statistics?
Generally, for this I have been using Yahoo and for this company, the
"Key Statistics" on Lamson & Sessions. Some of the things that are important include the size of the company: LMS is a small cap stock (under $500 million) with a market capitalization of only $396.71 million. The trailing p/e is a downright reasonable 14.22 with a forward p/e of only 13.78. I don't have a PEG ratio reported (probably because there aren't any analysts giving 5 year expected results on this small company).
By the Price/Sales ratio, at least according to the
Fidelity.com eresearch website, LMS is in the "Diversified Electronics" industrial group, and has the most reasonable Price/Sales ratio of the group coming in at a dirt cheap 0.8. Topping this group is Evergreen Solar (ESLR) at 21, followed by JDS Uniphase (JDSU) at 6.5, International Game Technology (IGT) at 6, Amphenol (APH) at 2.9, and WMS Industries (WMS) at 2.8. Way back is sitting Lamson & Sessions, another plus, imho, for this stock.
Additional information from Yahoo includes the fact that the company has 15.32 million shares outstanding with only 12.91 million that float. Currently there are 2.60 million shares out short as of 3/10/06, representing 20.20% of the float, or 5.4 trading days of volume (the short ratio). This is up over a million shares out short from 1.52 million shares the prior month. I do not know what these short-sellers are seeing. Unless they know something I don't, they are in for a rude awakening, and may be a factor in the stock's continued rise (?).
No dividend is paid, and no stock splits are reported on Yahoo.
5. What about a chart?Taking a look at the
"Point & Figure" chart on Lamson & Sessions from StockCharts.com:
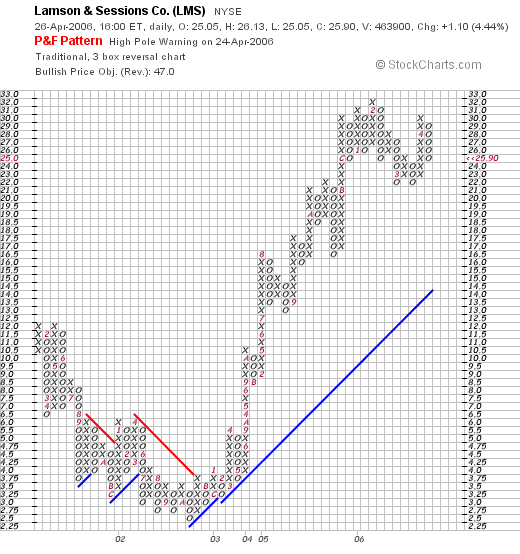
We can see that while the stock traded lower (parallel to the poor earnings and revenue growth during that period) between 2001 and 2002, in late 2002, sometime in October, the company bottomed at $2.50/share and then started moving higher, breaking into higher territory in January, 2003, and moving to a peak of $32 in February, 2006. The stock recently pulled back to $22, where it appears to have had a "double bottom" as the technicians say (sort of bouncing twice off the same support area as I understand it) and then moved higher to the current $25.90 level. The chart looks good to me!
6. What do I think?
Well, I don't really know if Jeff has any shares of this stock....if I were a gambling man, I would bet he did :). I would even hazard a guess (?) that Jeff knew that I wrote this up....???....and that he knew I would like it and would write it up again ????....Well maybe not. But figure he has some shares :). Good for him. And thank you Jeff for writing. If you are indeed sincere at this question, I give you credit for picking this one and knowing I would like it. And if not, well I guess it was just about time to revisit this stock in any case!
But back to the stock. The company's latest quarter was great, the Morningstar.com looks very nice with steady growth in both revenue, earnings, and free cash flow the past few years. The balance sheet looks nice, and valuation is terrific with a p/e in the low teens and a Price/Sales under 1.0 and the lowest in its group. Finally, the chart looks nice and the company has just raised guidance. What else could an investor want?
Thanks again for writing. And Jeff, you can write some more anytime! I sure like having you as a reader around here!
If you or anyone else has any questions, please feel free to leave them on the blog or email me at bobsadviceforstocks@lycos.com. Please be sure to drop by and visit my Stock Picks Bob's Advice Podcast Site where you can download and listen to many of my podcasts on much the same subjects I write about!
Have a great day trading tomorrow!
Bob
Posted by bobsadviceforstocks at 8:41 PM CDT
|
Post Comment |
Permalink
Updated: Wednesday, 26 April 2006 9:00 PM CDT
Monday, 24 April 2006
A Reader Writes: "...a review of P&F charts and top NYSE gainers."
Click
HERE FOR MY PODCAST ON P&F CHARTS AND TOP % GAINERSHello Friends! Thanks so much for stopping by and visiting my blog,
. As always, please remember that I am an amateur invastor, so please remember to consult with your professional investment advisors prior to making any investment decisions based on information on this website.
One of the things I get to on weekends is to catch up with my email. I did manage to finally get around to seeing
Casablanca last night on DVD. Never did see that famous movie before with Humphrey Bogart and Ingrid Berman. Great flick. See it if you haven't.But I received a very nice email from Steven a couple of days ago and he raises some excellent points and has a couple of questions. He wrote:
"Hey Bob Found your website from Bill over at nodoodahs.com. You got a real nice blog. As a new investor (only been doing this 4-6 months) I started my own blog to talk about books and blogs that I feel are helpful to new investors (you can read about it at valueblogreview). I think your site is really helpful and I plan on linking to it when I next update my blog. A quesition or two that I have goes to the NYSE gainers list and P&F charts. I get in your posts the fundamental and qualatative analysis yo do on a company...and you make real clear your sell philosphy...but could yo point me to a specifc post wher eyo talk about how you came about using the NYSE gainers list to filter stocks you are loking for....and more importantly what it is you like about P&F charts (I like them because they seem to be less techinical than other charts). If you have already covered this just let me know where I can read about in on your blog..if you have not than I would appreciate it if you could give a more detailed review of P&F charting and the use of the NYSE gainers list. Thanks again for the great blog. Steven"
Steven, thanks so much for writing and good luck on your blog and on your investing activity.I was listening this morning to
Wisconsin Public Radio this morning and was listening to a man in his 60's talk about surfing and the philosophy and wisdom in riding waves. "Everything is Waves" was his comment.
I don't mean to wax philosophic, but isn't that what we are doing with investing? Catching 'waves' of stock movement. Stocks going higher if you are going long or going lower if you are short the stock.There are many ways to catch waves. I have never surfed but I have tried "boogey boards" in the past.I guess when I look at the lists of top percentage gainers, I am looking at the tips of waves. I do my homework and try to decide which of those waves I wish to take. And when it is time to go surfing.
When a wave gives out, loses momentum, or however you wish to describe the stock, I get out of the water momentarily. I wait for a signal from another 'wave' of mine, a sale at a gain, to let me know it is time to paddle out and catch another wave.When you are surfing, you probably realize that you cannot simply catch waves anywhere in the water. You look for the crests, you probably know exactly where you need to be to surf. I certainly don't! In other words, when I am looking for a stock to increase in price, I shall be buying the stock on a particular day. Why not buy a stock which on that particular day is demonstrating good momentum? That is why I look at the top % gainers list.
The other analogy I like to use (my son is always complaining that I use far too many comparisons...sorry Ben if you are reading this), is my latest "Alphabet Soup" analogy. When I am looking for a stock, I don't go into the bowl of soup to find something. I let the boiling soup pot bubble up the investment that is worthwhile pursuing. I also refer this as my "Zen" approach. (With apologies to all Buddhist readers).
In other words, I do not go seeking a stock, I let the market bring the stock to me. I hope you follow.This all started a few years back when in the heyday of the high-tech market, one could buy stocks off the top % gainers list, and likely sell them just a few hours later at a gain. I occasionally entered into this "day-trading" activity with mixed results. It wasn't perfect, but I started to realize that the top % gainers list was a good place to start. That on this list were the stocks that were essentially being recalibrated in price by analysts often related to something being reported, often an earnings report that exceeded expectations. A contract that was landed, or guidance that was being raised.
What I have done is to try to take all of this a step further. Being on the top % gainers list is not enough for me. That is just the first step in screening a stock. I am looking for a certain profile of a company. And it is the usual stuff: the strong latest quarter, a nice Morningstar.com '5-Yr restated' financials page, reasonable valuation, and a reasonable chart. I review this over and over on the blog.I hope this answers that first question of yours.
Your second question about "point & figure" charts is more difficult. I can tell you that about five or six years ago I was introduced to these charts from a broker from
Piper Jaffray who was advising my stock club at that time. He did a great job and I started getting comfortable with these charts. A little like Candlestick charts, point and figure charts give a feeling of momentum, both in the upwards and downwards direction. I find them useful and I continue to use them. I am far from an expert on these charts. Usually when I look at a chart, I try to feel the psychology behind the price move. Is the stock moving higher? Is it breaking down? Is it struggling? You can see my almost human affect I give to the charts. Some charts look almost euphoric to me.
If you are interested in learning more about these and other charts, there is an excellent
tutorial on Point & Figure Charts on StockCharts.com. Or if you are interested in learning more, you can purchase the Tom Dorsey Point & Figure book on this subject.Good luck with your blog and would love to have you come and visit and comment more often.If you have any other comments or questions, please feel free to leave them on the blog or email me at bobsadviceforstocks@lycos.com. Please be sure to come and visit my
Stock Picks Bob's Advice Podcast Site.
Bob
Posted by bobsadviceforstocks at 1:15 PM CDT
|
Post Comment |
Permalink
Updated: Monday, 24 April 2006 11:25 PM CDT
Sunday, 23 April 2006
A Reader Writes 'Still a positive opinin on Cohesant? (COHT)'
Hello Friends! Thanks so much for stopping by and visiting my blog,
Stock Picks Bob's Advice. As always please remember that I am an amateur investor, so please remember to consult with your professional investment advisors prior to making any investment decisions based on information on this website.
I received a nice email from a professional in the industry about Cohesant Technologies (COHT). He apparently has a large position in the company; I do not own any shares of this stock. And requested I take another look. He wrote:
"Bob, I read your opinion of Cohesant Technologies from a few years back and wondered if you still have a positive opinion. I like the way you think, and have a huge position in the stock (about 20,000 shares of my own, 40,000 for my clients). I like the management strengths and continuity, the high GM, the high ROE%, the lack of debt, the consistent performance over the last decade. Just wanted to see if you still held a positive opinion of the company. I manage a great deal of money in the water sector, and see this equity as the great nascent player in the water infrastructure business. The only problem is that is is not followed by analysts, not held my mutual funds, and I sometimes wonder why it is that it looks so great to me but day in and day out, the only shares traded in the stock are ones I traded (bought, actually.... I have never sold a share).
A tip for you--You might look at the high quality credentials brought over by the new CEO at SWWC.... look at the website for his previous company... SWWC has not lost money for shareholders in any year in the pat 10, according to Morningstar. That company is going to shine bringhtly in the coming years.
Thanks for any counsel you can offer. Best regards"
Thank you so much for writing . I would be happy to take another look at Cohesant (COHT). As you pointed out, I
posted Cohesant Technologies (COHT) on Stock Picks Bob's Advice on June 24, 2004, almost two year ago when it was trading at $10.06. COHT closed at $11.00 on 4/21/06, giving me a gain of $.94 or a gain of 9.3% since posting.
As you probably know, I have a rather simple approach to looking at stocks. I would be happy to run through some of these same 'screens' and see what happens today.

Let's take an updated look at this company.
1. What does the company do?According to the
Yahoo "Profile" on Cohesant, the company
"...through its subsidiaries, engages in the design, development, manufacture, and sale of dispense equipment systems, replacement parts, and supplies. The company also offers specialty coating and grout products. It designs and manufactures dispense equipment systems, which are used to dispense multicomponent formulations, such as fiberglass reinforced plastics, polyurea and polyurethane coatings, and polyurethane foam."
 2. What about the latest quarter?
On March 24, 2006, Cohesant
reported 1st quarter 2006 results. For the quarter ended February 28, 2006, 'consolidated net sales' increased 51.7% to $6.47 million from $4.26 million the prior year. Consolidated net income came in at $379,672, a 59.8% increase over the $237,635 reported in the same period the prior year. On a per share basis this worked out to net income of $.12/diluted share, up 33% from $.09/diluted share the prior year. So far so good :). This certainly was a strong quarter.
3. What about longer-term results?Reviewing the
"5-Yr Restated" financials on COHT from Morningstar.com, we can see that while this is a very small company, the company has been experiencing fairly steady revenue growth from $16 million in 2001 to $22 million in 2005 and $24 million in the trailing twelve months (TTM).
As is often my observation in these smaller companies, the earnings growth is not quite as steady, with $.44/share reported in 2001, increasing to $.67/share in 2004. This did drop to $.57/share in 2005, but has rebounded to $.60/share in the TTM. An added plus is the fact that the company initiated a dividend of $.25/share in 2003 and increased it to $.26 in 2004 and again to $.27/share in 2005. While a dividend is not essential for an investment, it adds an extra element for many investors. Also nicely, the company which had 2 million shares in 2001, increased to 3 million in 2002, and has kept that 3 million shares in 2005 and in the TTM.
Free cash flow is positive at $2 million in 2003, $3 million in 2005, and $2 million in the TTM.
The balance sheet appears solid with $1.2 million in cash and $9.1 million in other current assets, giving us a current ratio of 2.86 when compared to the current liabilities of $3.6 million. In addition, the company has negligible long-term liabilities, recorded as $.2 million on Morningstar.
4. What about some valuation statistics?Taking a look at
Yahoo "Key Statistics" on Cohesant (COHT), we can see how
small this company is! Recorded as a market cap as $34.75 million, this is what I refer to as a micro-cap stock (under $100 million in market capitalization). The trailing p/e is a reasonable 18.68. There is not forward p/e (probably no analysts that follow), and thus no PEG is possible.
According to the
Fidelity.com eresearch website, Cohesant is in the "Diversified Machinery" industrial group. Within this group, Cohesant is reasonably priced with a Price/Sales ratio of only 1.5. Leading this group is Shufflemaster (SHFL) with a ratio of 10.5, followed by Roper Industries (ROP) at 3, Illinois Tool Works (ITW) at 2.3, then Cohesant at 1.5, Ingersoll-Rand (IR) at 1.4, and Eaton Corp. (ETN) at 1.1. Thus, at least by this parameter, the stock is relatively inexpensive.
Finishing up with Yahoo, we find that there are only 3.16 million shares outstanding with 1.11 million that float. Currently there are 1,860 shares out short as of 3/10/06, giving us a short ratio of only 0.8. This is only 0.1% of the float. So this isn't much of a factor.
 5. What does the chart look like?
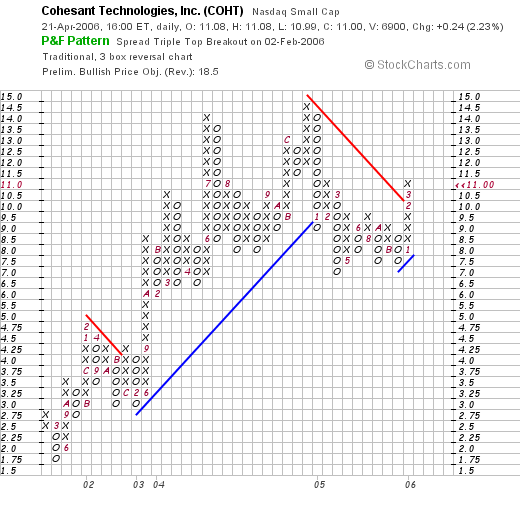
If we take a look at the
"Point & Figure" chart on COHT from StockCharts.com, we can see that the stock was climbing strongly from March, 2001, when it was as low as $1.75/share, to a peak of $14.50 in December, 2004, however, the stock broke down after that, dropping to the $7.00 level. Since December, 2005, the stock has been moving strongly higher, breaking through resistance at
$10.50 in March, 2006. Thus, short-term, the upward momentum appears to has been possibly re-established. I probably would feel more comfortable to see the chart moving past the prior highs at the $14.50 level, before being convinced that the technicals were solid. Probably with another solid quarter which appears likely, we shall see this stock move higher.
6. So what do I think?
This is certainly an interesting, if tiny company. The stock appears to be trading at least short-term positively. I think future appreciation will depend and result from continued positive earnings reports. The last quarter was great, the Morningstar.com report looks nice except for a bit of short-term earnings weakness the past couple of years. I like the increasing dividend, the stability in the number of shares, the free cash flow, and the solid balance sheet. Companies with small float always make me a bit cautious due to what I perceive as the magnified volatility inherent in these stocks.
Good-luck with your investment! I hope that was helpful for you. The company still looks interesting and you may well be on to something big for you and your clients.
If you have any comments or questions, please feel free to leave them on the blog or email me at bobsadviceforstocks@lycos.com and be sure to come and visit my Stock Picks Bob's Advice Podcast Site.
Bob
Saturday, 22 April 2006
Healthways (HWAY) Weekend Trading Portfolio Analysis
Click HERE for my PODCAST ON HEALTHWAYS
Hello Friends! Thanks so much for stopping by and visiting my blog,
Stock Picks Bob's Advice. As always, please remember that I am an amateur investor, so please remember to consult with your professional investment advisors prior to making any investment decisions based on information on this website.

One of my promises to all of you readers is to continue to share with you my actual trading portfolio and my analysis of the stocks that I actually hold. I do a lot of different things on this blog. Mostly, I am applying an investment strategy that I discuss throught this website, of selecting stocks with certain characteristics, and making decisions on when and how many shares to sell in each of my positionns, and how to shift back and forth between cash and equities.
Starting about six months ago, I started a weekly review of my actual holdings, going alphabetically through the list which currently consists of 21 positions. About a month ago, I realized that this review would be too frequent and thus decided to start reviewing my holdings every
other weekend. Two weeks ago I
reviewed Hibbett (HIBB) on Stock Picks Bob's Advice. This week I am up to "Healthways" (HWAY) which was renamed from the former American Healthways (AMHC).
I currently own 128 shares of Healthways which closed at $50.41 on 4/21/06. These shares were purchased 6/18/04, a little under two years ago, with a cost basis of $23.53. Thus, I have an unrealized gain of $26.88 or 114.2% on these shares.
I have sold portions of my holdings three times since my purchase: 75 shares sold 11/3/04 at a price of $32.65 (a 39% gain), 55 shares sold 4/25/05 at $39.69 (a 69% gain), and 42 shares sold 7/28/05 at $44.86 (a 91% gain). Thus, my fourth sale, which may be soon , should be at around a 120% gain level on the upside or 2.20 x $23.53 = $51.77. On the downside, I plan on selling all of my shares at the 50% of the highest sale point, which currently would work out to be at a 45% gain level (1/2 of 90%), or 1.45 x $23.53 = $34.12.
Well let's take a look at the stock today and see if it still deserves a place in my trading portfolio!
1. What does the company do?According to the
Yahoo "Profile" on Healthways, the company
"...provides health and care support programs and services in the United States. The company offers disease management and care enhancement services to health plans, the centers for Medicare and Medicaid Services, and hospitals, as well as wellness programs to health plans and employers in 50 states in the United States, the District of Columbia, Puerto Rico, and Guam."
2. How did they do in the latest quarter?On March 20, 2006, Healthways
reported 2nd quarter 2006 results. Revenue for the quarter ended February 28, 2006, increased 33% to $100,021,000 from $75,337,000 for the same quarter the prior year. Net income came in at $7.3 million or $.20/diluted share,
down from $8.4 million or $.24/share in the same quarter the prior year. However, even though earnings were down year-over-year, the company
raised guidance for both earnings and revenue for 2006. As they reported:
"Based on the Company's results for the second quarter and first six months of fiscal 2006, and its outlook for the remainder of the fiscal year, Healthways today raised its established guidance for fiscal 2006. The Company increased its guidance for revenues for fiscal 2006 to a range of $415 million to $435 million from the previous range of $412 million to $432 million, as a result of a $3 million increase in revenues expected to be produced by the MHS pilots. Because of the higher than anticipated participation rates in the MHS pilots, the Company expects fiscal 2006 revenues from these pilots to be in a range of $25 million to $28 million. The Company's guidance for revenues from its core commercial business remains unchanged at $390 million to $407 million. The Company's guidance does not include any revenues from international sources for fiscal 2006.
The Company's guidance for net income per diluted share for fiscal 2006 has been increased to a range of $1.16 to $1.19 from a range of $1.10 to $1.14, which includes the expected impact of the Company's LTI compensation program of $0.25 per diluted share. Excluding these costs, the Company's guidance for net income per diluted share for fiscal 2006 has been increased to a range of $1.41 to $1.44 from $1.34 to $1.38."
This raised guidance was enough to push the stock price higher!
3. What about longer-term results?Reviewing the
Morningstar.com "5-Yr Restated" financials on HWAY, we can see the steady picture of revenue growth from $75.1 million in 2001 to $312.5 million in 2005 and $331.9 million in the trailing twelve months (TTM).
Earnings have improved steadily except for the slight miss the latest quarter as noted above. Earnings have increased from $.11/share in 2001 to $.93/share in 2005 and dropped to $.89/share in the TTM. The company
has increased its float slightly from 26 million shares in 2001 to 33 million in 2005 and 34 million in the TTM.
Free cash flow has been positive and basically growing with $11 million reported in 2003, $59 million in 2005 and $53 million in the TTM.
The balance sheet looks solid with $68.7 million in cash, enough to pay off both the $48.2 million in current liabilities and the $15.5 million in long-term liabilities combined. Insofar as the 'current ratio' is concerned, the company has $133.3 million in total current assetes (including the $64.6 million in other current assets), which when compared against the $48.2 million in current liabilities, yields a ratio of 2.77. Generally ratios over 1.5 are considered 'healthy'.
4. What about some valuation numbers on this company?Examining the
Yahoo "Key Statistics" on Healthways, we find first of all that this is a mid-cap stock with a market capitalization of $1.74 billion. The trailing p/e is quite rich at 59.31, and the forward p/e is a bit better at 34.06. The PEG is moderate at 1.50.
Reviewing the
Fidelity.com eresearch website, we find that this company is in the "Specialized Health Services" industrial group. Even within this group, the company is richly valued with a Price/Sales ratio of 5.1, at the top of this group. Following HWAY is Lincare Holdings (LNCR) with a ratio of 3.3, United Surgical Partners (USPI) at 3.3, DaVita (DVA) at 2, Express Scripts (ESRX) at 0.8 and Caremark Rx. (CMX) at 0.6. Thus, by this ratio, this stock is also richly valued.
Going back to Yahoo, we find that there are 34.52 million shares outstanding with 32.88 million that float. Of these, 3.74 million shares are out short as of 3/10/06, representing 11.30% of the float or 20.2 trading days of volume. This is up from 3.54 million the prior month. Using my 3 day rule, this suggests that there are a LOT Of shares out short, and with any good news could develop into a short squeeze. On the other hand, these short-sellers may be looking at the same valuation richness I just reviewed and believe that the stock should be priced lower.
No cash dividends are reported, and the last stock split was a 2:1 split on December 22, 2003.
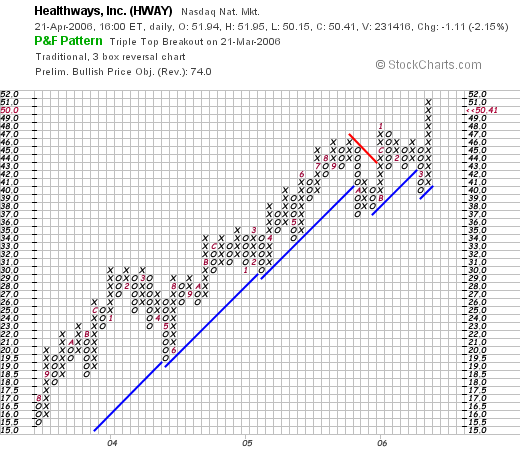
5. What about a chart?Looking at a
"Point & Figure" chart on HWAY from StockCharts.com, we can see that the company stock rose strongly in price from July, 2003, until October, 2005, when the stock broke through support, and then faltered once again in March, 2006. However, after the latest earnings report, the stock responded strongly and moved to new highs. The stock has pulled back slightly from its recent highs.
6. So what do I think?
This stock has been very kind to me, and recently was trading in what I could only describe as "tired". After the latest earnings report, the stock is alive once again as growth prospects have once again been rekindled. However, pricing is a bit rich with both the p/e and Price/Sales ratios at the high end of similar stocks. The large number of short sellers may well be helping propel the stock higher at this point as they scramble to cover. It will be interesting to see what the next month's short number show and if indeed some of these sellers have covered.
I do believe that intuitively this field of disease and healthcare management can only continue to be of great need as our society struggles with the growing healthcare needs of our aging population.
Thanks so much for stopping by! If you have any comments or questions, please feel free to leave them on the blog or email me at bobsadviceforstocks@lycos.com. Also, please come by and visit my Stock Picks Bob's Advice Podcast Site.
Bob
Posted by bobsadviceforstocks at 8:31 PM CDT
|
Post Comment |
Permalink
Updated: Sunday, 23 April 2006 12:57 AM CDT
Newer | Latest | Older


