Stock Picks Bob's Advice
Thursday, 25 May 2006
"Revisiting a Stock Pick" Toro (TTC)
CLICK HERE FOR MY PODCAST ON TORO (TTC)Hello Friends! Thanks so much for stopping by and visiting my blog,
Stock Picks Bob's Advice. As always, please remember that I am an amateur investor, so please consult with your professional investment advisors prior to making any investment decisions based on information on this website.

As I noted in my previous entry, I sold 1/6th of my position of Healthways (HWAY) at a gain, entitling me to add a new position since I am under my 25 position, self-impoosed maximum number of holdings in my trading portfolio. With that in mind, I took a look at the
list of top % gainers on the NYSE and found The Toro Company (TTC) which closed at $47.89, up $1.70 or 3.68%. Before the close of trading I purchased 120 shares of Toro (TTC) at $48.27.

I first
posted Toro (TTC) on Stock Picks Bob's Advice on March 15, 2004, when it was trading at $58.96. TTC had a 2:1 split on 4/13/05, giving my stock pick an effective price of $29.48. Thus, with today's close, my Toro pick had an appreciation of $18.41 or 62.4%. Let's take another look at this stock and I will share with you why I picked the stock today to add to my portfolio.
1. What exactly does this company do?According to the
Yahoo "Profile" on Toro, the company
"...engages in the design, manufacture, and marketing of turf maintenance equipment, turf and micro irrigation systems, landscaping equipment, and residential yard products worldwide."
2. How did they do the latest quarter?
It was the
announcement of 2nd quarter 2006 results this morning that pushed the stock higher! Today (5/25/06) Toro reported sales of $659 million, up from $628.4 million for the quarter ended May 5, 2006. Net earnings came in at $70.1 million, up from $62 million, and earnings per diluted share of $1.56, up from $1.33/diluted share the prior year. Earnings/share beat
expectations by $.06/share, but revenue actually came in a bit shy of expectations of $669 million.
3. How about longer-term financial results?Reviewing the
Morningstar.com "5-Yr Restated" financials on Toro, we find a pretty picture of steady revenue growth from $1.35 billion in 2001 to $1.78 billion in 2005 and $1.80 billion in the trailing twelve months (TTM).
Earnings have also grown steadily except for a dip from $.97/share in 2001 to $.68/share in 2002. Since 2002, they have increased to $2.45/share in 2005 and $2.54/share in the TTM.
The company paid $.12/share in dividends between 2001 and 2004 and raised the dividend to $.24/share in 2005 and has paid $.27/share in the TTM. Interestingly, the company has been
reducing the number of outstanding shares from 51 million in 2001 to 45 million in 2005 and 43 million in the TTM. Of the many stocks I have reviewed on this blog, very few have been consistently reducing shares outstanding which imho is a very bullish indicator.
Free cash flow also looks very nice with $73 million in 2003, increasing to $134 million in 2004 and $137 million in 2005.

The balance sheet shows Toro with $19.7 million in cash and $697.1 million in other current assets. Added together, this $716.8 million in total current assets, when balanced against the $403.8 million in current liabilities, yields a current ratio of 1.78. As I often point out, a current ratio of 1.5 higher is considered 'healthy.' In addition, the company has another $185.3 million in long-term liabilities. The current assets can easily cover both the short-term and long-term liabilities combined.
4. What about some valuation numbers on this stock?Examining the
"Key Statistics" on Yahoo on Toro (TTC), we find that this company is a mid-cap stock with a market capitalization of $2.04 billion. The trailing p/e is a very moderate 18.74, with a forward (fye 31-Oct-07) p/e of 14.51. The (5 yr expected) PEG is only 1.29. I consider PEG ratios between 1.0 and 1.5 to be 'reasonable'.
According to the
Fidelity.com eresearch website, Toro is in the "Small Tools & Accessories" industrial group. Within this group, Toro appears reasonably priced with a Price/Sales ratio of only 1.1. Topping this group is Simpson Manufacturing (SSD) with a Price/Sales ratio of 2.1, this is followed by Stanley Works (SWK) at 1.2, then Toro (TTC) at 1.1. At the bottom of the group is Black & Decker (BDK) at 1, and Snap-On (SNA) at 1.
As suggested by a loyal reader, let's start taking a look at the
profitability of a company. Using the Return on Equity (ROE) ratio, and comparing it to other stocks in the same group, we find Black & Decker (BDK) with a ROE of 32.6%, Toro (TTC) is next at 29.2%, Simpson (SSD) follows at 19.6%, Stanley Works (SWK) at 17.9% and Snap-On (SNA) is at the bottom of this group with a Return on Equity of 9.7%. Thus by this measure, Toro appears to be relatively more profitable compared to similar stocks in the same industrial group.
Going back to Yahoo for some more numbers, we find that there are 42.63 million shares outstanding with 41.45 million that float. Of these shares, 5% of the float or 2.07 million shares were out short as of 4/10/06. This worked out to 8.8 trading days (the short ratio) and is significant imho. With the stock moving higher today on good news, if there still were a lot of shares out short, they are feeling the 'squeeze'.
As I noted previously, the company pays a small dividend with an indicated rate of $.36/share or 0.80%. The last stock split, as already noted, was a 2:1 split on 4/13/05.
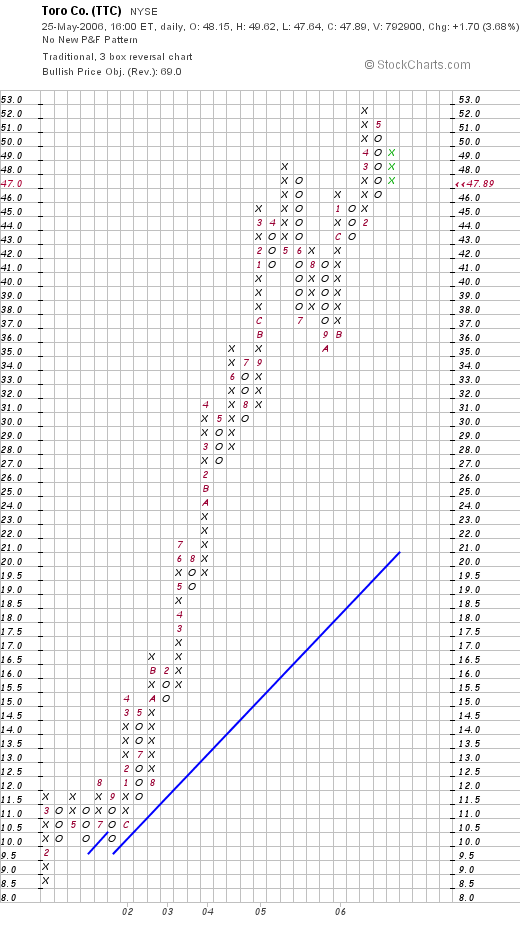
5. What does the chart look like?Inspecting the
Toro (TTC) "Point & Figure" chart from StockCharts.com, we can see a simply gorgeous chart with the stock trading sideways in most of 2001 between $8.50 and $11.50, and then in January, 2002, breaking out to higher levels near $15. The stock has subsequently continued moving higher and appears to have pulled back only slightly from the high near $53, to the current level of $47.89. This chart is one of the strongest on the blog imho.
6. Summary: So what do I think about this company?
Well you know that I like this stock because I just bought some shares :). Now seriously, the stock made a nice move higher today on an earnings report that beat expectations (except for the revenue which was a shade light), and the company also raised revenue guidance slightly. The five year Morningstar page shows steady revenue and earnings growth, growth in the dividend recently, and an actually falling number of shares outstanding. The free cash has been growing and the balance sheet looks solid.
Valuation-wise, the p/e and PEG are reasonable, the Price/Sales ratio is near the bottom of its industrial group, and its profitability, as measured by Return on Equity (ROE) is near the top of its group. In addition, there are lots of shares out short which are waiting to be "squeezed" and the chart is gorgeous. I liked this stock enough to buy shares :).
Thanks so much for stopping by! If you have any comments or questions, please feel free to leave them on the blog or email me at bobsadviceforstocks@lycos.com.
Please be sure to visit my Stock Picks Bob's Advice Podcast Site.
Bob
Posted by bobsadviceforstocks at 1:40 PM CDT
|
Post Comment |
Permalink
Updated: Thursday, 25 May 2006 11:17 PM CDT
"Trading Transparency" Toro (TTC)
Hello Friends! Thanks so much for stopping by and visiting my blog,
Stock Picks Bob's Advice. As always, please remember that I am an amateur investor, so please remember to consult with your professional investment advisors prior to making any investment decisions based on information on this website.
The last several trades in my trading account have been on "bad news", declines that have led me to unload otherwise "good" stocks that I like. With these sales, I am required to "sit on my hands" so to speak, and not re-invest the proceeds in another position.
Earlier today, for a change, I had a sale on "good news". This means that one of my stocks hit a sale point on appreciation and not on declining, and a portion of this position (approximately 1/6th of my remaining shares) were sold.
In fact, I sold 21 shares of my 128 share position of Healthways (formerly American Healthways) (HWAY), at $51.73 in my trading account. These shares were originally purchased 6/18/04 at a cost basis of $23.53 (according to my Fidelity account) and thus represent a gain of $28.20 or 119.8% (I was aiming for a 120% appreciation target). This was my fourth partial sale of Healthways stock, having sold shares 11/03/04, 4/25/05, and 7/28/05, at the 30, 60, and 90% appreciation targets.
Having now sold a portion of a position on "good news" and being well under my 25 position maximum size for my portfolio (now including this purchas am up to 19 positions), this entitled me to add a new position. (I purchased 120 shares of Toro (TTC), an old favorite of mine, and I shall write about this on another post.)
When will I be selling shares next? Unless there is an announcement of some negative news on a fundamental basis about the company (in which case I reserve the right to sell my entire position regardless of the price), my portfolio management system directs me to sell another 1/6th of my holding if the stock should appreciate to a 180% appreciation target from my purchase. This works out to $23.53 x 2.80 = $65.88. However, if the stock should start declining instead of appreciating, my strategy is to sell at 50% of the highest appreciation level sale, which in this case would be at a 60% appreciation level. Thus, this would work out to 1.60 x $23.53 = $37.65. If the stock
should decline to that level, my strategy would direct me to sell my entire position at that price.
Thanks so much for stopping by and visiting! If you have any comments or questions please feel free to leave them on the blog or email me at bobsadviceforstocks@lycos.com. Please remember to stop by and visit my
Stock Picks Bob's Advice Podcast Website.
Bob
Posted by bobsadviceforstocks at 12:49 PM CDT
|
Post Comment |
Permalink
Updated: Saturday, 24 June 2006 11:21 PM CDT
Tuesday, 23 May 2006
A Reader Writes: "I do have a couple of questions for you...."
CLICK HERE FOR MY PODCAST ON PROFITABILITY RATIOS AND OTHER QUESTIONS FROM A READER
Hello Friends! Thanks so much for stopping by and visiting my blog,
Stock Picks Bob's Advice. As always, please remember that I am an amateur investor, so please remember to consult with your professional investment advisors prior to making any investment decisions based on information on this website.
If you have any comments or questions, please feel free to drop me a line at bobsadviceforstocks@lycos.com and I shall try my best to answer or comment on your inquiries either here and/or on my podcast. Also, please feel free to leave your comments or questions right on the blog itself!
A few days ago I had a nice letter from William S. who wrote:
"Hi again, Bob-
It's been a little rocky lately, hasn't it? It was interesting to hear you mention that you've been forced to sell a few stocks recently on your recent podcast, and knowing I wasn't the only one. I've had the same problem myself with a few of my more recent purchases. I also try to follow the 8% loss rule, particularly since one of the things I hear from multiple sources of information is that the key to success in the stock market is how you handle your losers. I do have a couple of questions for you, and I'll list them:
1) Where do you go to look for top percentage gainers for NYSE or American Stock exchange stocks? I know the www.nasdaq.com site for nasdaq, but was wondering about the other exchanges.
2) I look at Return on equity (ROE) when examining stocks. Do you? Could you also explain the difference between ROE and ROIC, and how they are each useful?
3) Do you by any chance know where you can find information about historical p/e ratios of stocks or even sectors? I've recently thought this could be useful information in valuating a stock relative to it's sector and history. For example, I know that bank stocks and I think raw material stocks typically have low p/e's, and seeing a very low p/e for a stock can be deceptive if you are not aware of it's typical valuation compared to other sectors.
4) Lastly, can you explain cost basis? For example, if one buys a total of 100 shares of stock at three intervals, say at $22, $20, and $24, when you sell half of those 100 shares at a later date, how do you know which ones you have sold (i.e. the $22 shares or the $24 shares)? Does it just average out and you get a profit on $22?
Thanks so much again for your time and helpfulness. You've got a great thing going here.
-Bill S. in Bloomington, IN"
First of all Bill, thanks so much for writing, for listening to and reading what I write!
I too have been selling a few of my holdings as they hit targeted sale points. I also sold my Hibbett (HIBB) that has been quite good for me as well on the news of poor same store sales. I think that the bias to sell should increase in a downward market, and the willingness to overlook flaws should be emphasized in a market that is otherwise quite strong.
Let me try to respond to your questions in order. The first one is the easiest: 1) "where do I go to look for top percentage gainers?" Most recently I have been going to the
CNNMoney.com website where you can find the
top % gainers on the NASDAQ, the
top % gainers on the NYSE, and the
top % gainers on the AMEX. I am also aware that USA Today keeps an updated percentage gainers as well that I sometimes refer to if the CNNMoney.com website is down or slow.
2. Your second question is a bit more challenging. You point out that you use Return on Equity (ROE) and asked whether I do. I do not use ROE in picking stocks. You also asked about the difference beteween ROE and ROIC.
I would like to refer you to a book by Pat Dorsey,
The Five Rules for Successful Stock Investing, which on pp. 86-96, these topics are reviewed. Let me try , in my own amateur way to review what Dorsey clearly explains. (I am paraphrasing from the text which I would recommend you review directly.)
The first number you need to calculate (if you want to derive this information yourself) is Return on Assets (ROA) which is calculated first by determining net margin which is net income divided by sales. Next one needs to know the asset turnover which is sales divided by assets. Multiplying these two together:
Net Margin x Asset turnover = Return on Assets. Or simply put, Net Income/Assets.
Finally, to determine return on equity, simply multiply Return on Assets by the "financial leverage ratio" which defined as Assets/Shareholders' equity.
Or Return on Equity = Return on Assets x Financial Leverage. But since return on assets=Net Margin x Asset Turnover, Return on Equity (ROE) = Net margin x Asset turnover x Financial leverage.
Insofar as Return on Invested Capital (ROIC) is concerned, which according to Dorsey, "...measures the return on all capital invested in the firm regardless of the source of the capital."
The formula:
ROIC = Net operating profit after taxes (NOPAT)/Invested Capital.
Invested Capital is defined as Total Assets - Non-interest bearing current liabilities (usually accounts payable and other current assets) - Excess cash (cash not needed for day-to-day business needs).
Quite frankly, since I don't use these two statistics in my simple analysis of stocks, although I am sure that having this information is helpful for those that wish to get a more accurate picture of a company's finances, I am not qualified to tell you how each is useful.
Again quoting Dorsey, "Return on invested capital is a sophisticated way of analyzing return on capital that adjusts for some peculiarities of ROA and ROE. Although you needn't worry about calculating it for yourself--it's pretty complicated--it's worth knowing how to interpret it because it's overall a better measure of profitability that ROA and ROE."
Dorsey adds, "Essentially, ROIC improves on ROA and ROE because it puts debt and equity financing on an equal footing: It removes the debt-related distortion that can make highly leveraged companies look very profitable when using ROE. It also uses a different definition of profits that ROE and ROA, both of which use net income. ROIC uses operating profits
after taxes, but
before interest expenses. Again, the goal is to remove any effects caused by a company's financing decisions--does it use debt or equity?--so that we can focus as closely as possible on the profitability of the core business."
Dorsey summarizes it best on p. 94, when he states: "What does all this mean to you if you hear someone talking about ROIC? Simply that you should interprest ROIC just as you would ROA and ROE--a higher return on invested capital is preferable to a lower one." I don't think I could have put that any better :).
I hope that explains your question. I am not an accountant and find digging through financial statements challenging at best.
It is my belief that simpler information such as earnings growth, free cash flow, and a simple view of the balance sheet is adequate for a successful investment program. However, the ability to measure profitability and return cannot be minimized. But these, imho, are static measurements. It is the dynamic picture of revenue and profit growth that I believe is so important in driving stock prices higher.
You asked about historical p/e's of stocks.
I found an answer on
SF Gate newspaper where the same question was discussed:
"Q: Where can I find a chart showing a specific company's historical P/E ratios?
A: Some investors use a stock's P/E as a timing tool. They buy when a stock is trading near the low end of its historical range, and sell when it approaches the high end.
You can use Big Charts (www.bigcharts.com) to see a company's historical P/E ratios going back 10 years. Select either Interactive or Java Charting on Big Chart's home page. Then select P/E Ratio from the Lower Indicators drop- down menu. You can read the P/E ratios right off the screen if you use the Java charts."
Indeed I checked Big Charts and found that if you use the JAVA chart and use the pull down menu on the lower left you can insert p/e ratios on the charts. Let me know if you have a problem with this.
Finally you had a question about "cost basis". Quite frankly, I simply open up my Fidelity Account online and under "cost basis" read the number they give me. But that probably isn't going to satisfy your curiosity. I found a better
answer on Smart Money from July 2, 1999. Basically, as I understand it, there are three methods. When I read off the Fidelity account, they are using the standard method of "first in first out" in determining the cost basis for a stock. The three methods:
"FIFO
If you don't tell your broker what method you want to use, you'll wind up using FIFO. With this method you'll simply sell the first shares that you ever bought. But if your fund has done well, this might not be the best choice. That's because your earliest shares probably have the greatest taxable appreciation. On the other hand, this choice might make sense if only some of your shares qualify for the long-term capital gains break. In that case, you'd want to pinpoint your oldest shares.
Specific ID
This method allows you to cherry pick the shares you want to sell. This is good because it allows you to sell your highest-cost shares first, thus reducing your tax bill. Or you can sell your highest-cost, short-term shares to offset a short-term loss.
When using this method, you need records detailing your acquisition date and per-share cost. (If you're not one for keeping records, relax. Your broker should be able to provide you with transaction records, although you might have to pay for replacement copies.) You also need written confirmation from your broker detailing the shares you requested to sell. If you can't get it -- and for some brokers it's a nicety gone by the wayside -- you have to have some sort of proof that you gave instructions. For more on this subject, see CPA Bill Bischoff's latest tax column.
Single-Category Average Basis
With this method you simply add up the total cost of all of the shares that you own and then divide it by your total number of shares. This will give you an average presale basis. But be warned. This method might not save you much on your tax bill, so be sure to run the numbers before you commit to this method. And once you start using it, there's no turning back.
(A final note. Truth is, there might be another method available to you known as the double-category average basis. We didn't mention it here because it's not very popular, and in most circumstances you'd be better off using the Specific ID method."
Quite frankly, I am not sure if tax laws have changed since 1999 affecting these strategies so I certainly would recommend, as I always do, that you consult with your professional advisor/accountant/ tax person regarding these kinds of questions.
Bill, you have asked me a series of quite challenging questions. I hope these answers suffice.
By the way, the Morningstar site is quite helpful with current Return on Assets (ROA) and Return on Equity (ROE)statistics which for example for Quality Systems (QSII), can be found
here.
Also, Return on Equity (ROE) and Return on Assets (ROA) are both listed on Yahoo "Key Statistics" and maybe I should start mentioning these numbers as I review stocks. By looking at these statistics, we shall all gradually become more comfortable in assessing the true value of each stock reviewed.
Bob
Posted by bobsadviceforstocks at 10:12 PM CDT
|
Post Comment |
Permalink
Updated: Tuesday, 23 May 2006 11:35 PM CDT
Sunday, 21 May 2006
Jos. A. Bank (JOSB) Weekend Trading Portfolio Analysis
CLICK HERE FOR MY PODCAST ON JOSB.

Hello Friends! Thanks so much for stopping by and visiting my blog, Stock Picks Bob's Advice. As always, please remember that I am an amateur investor and that you should consult with your professional investment advisors prior to making any investment decisions based on information on this website.
One of the things I like to do on weekends on the blog is to review my holdings that I really do own in my trading portfolio. Fully invested, I would have 25 positions. However, with the recent sell-off in the market, and my own liquidation of several of my positions, I am now down to 18 positions. Trying to review these holdings about once/year, I am reviewing positions, going alphabetically, every other week.
Two weeks ago I reviewed JLG Industries (JLG) on Stock Picks Bob's Advice. This holding has subsequently been sold from my trading portfolio. Next alphabetically to review is Jos.A. Bank (JOSB).
 I currently own 187 shares of Jos. A. Bank Clothiers (JOSB) which were purchased a little over a year ago on 4/4/05, with a cost basis of $25.59/share. JOSB closed at $36.66/share on May 19, 2006. I thus have an unrealized gain of $11.07 or 43.3% since purchasing these shares.
As is my strategy, I have sold shares of JOSB out of my portfolio twice, having sold 60 shares 6/7/05, and another 30 shares on 1/30/06 at the 30% and 60% appreciation levels. Thus, on the upside, my next sale would be at a 90% gain on the upside or 1.9 x $25.59 = $48.62/share. On the downside, if the stock continues to retrace its gains, I shall be selling at the 30% appreciation level (1/2 of the top sale at 60% appreciation), or 1.3 x $25.59 = $33.27.
Let's take another look at this company and see if it still has the characteristics that led me to pick this stock for my own porfolio.
 1. What exactly does this company do?
According to the
Yahoo "Profile" on JOSB, the company
"...engages in the design, retailing, and marketing of men’s tailored and casual clothing and accessories. Its product line includes tuxedos, suits, shirts, vests, ties, sport coats, pants, sportswear, overcoats, sweaters, belts and braces, socks and underwear, branded shoes, and other items."
2. How did they do in the latest quarter?
On April 12, 2006, Jos. A. Bank
reported 4th quarter 2005 results. Total sales for the fiscal fourth quarter of 2005 increased 28.1% to $163.8 million, up from $127.9 million in the same period the prior year. Net income increased to $18.5 million, up from $12.6 million the prior year. On a diluted per share basis, earnings increased from $.71/share in 2004 to $1.02/share in fiscal 2005 fourth quarter. Comparable store sales rose 15.9% in the fourth quarter and internet sales climbed 18.9% in the quarter from the prior year same period.
The company
beat expectations for the period coming in at $1.02/share when according to Thomson Financial, analysts were expecting $.98/share. Revenue of $163.8 million also beat expectations of $162.5 million.
Checking for the latest news on sales, JOSB
reported April, 2006, same-store sales results on May 4, 2006. For stores open at least a year, sales rose 7.3% in April. This beat analysts expectations of a 7.2% increase. Catalog and internet sales grew 7.7% and the combined total sales for the month were $38.4 million, up 17.8% from the prior year.
 3. How has the company been doing long-term?
Reviewing the
"5-Yr Restated" financials on JOSB from Morningstar.com, we can see the steady growth in revenue from $211 million in 2002 to $372.5 million in 2005 and $464.6 million in 2006.
Earnings have also steadily increased from $.44/share in 2002 to $1.38/share in 2005 and $1.95/share in 2006. No dividends are paid. The company has slighly increased the float with 15 million shares outstanding in 2004, increasing to 17 million in 2006 and 18 million in the trailing twelve months (TTM).
Free cash flow which was a negative $(31) million in 2004, turned positive at $22 million in 2005, and was $5 million in 2006.
The balance sheet appears satisfactory with $7.3 million in cash and $195.9 million in other current assets reported. This total current assets of $203.2 million, when balanced against the $107.1 million in current liabilities, gives us a current ratio of 1.90. As has been explained
on About.com, a current ratio of 1.5 or higher is generally considered 'healthy'. Morningstar reports JOSB with $43.9 million in long-term liabilities.
 4. How about some valuation numbers on this stock?
Reviewing the
Yahoo "Key Statistics" on Jos. A. Bank, we find that this is a mid-cap stock with a market capitalization of $659.77 million. The trailing p/e is a very reasonable (imho) 18.75, with a forward p/e (fye 28-Jan-08) of 13.28. This results in a PEG (5 yr expected) of only 0.67, another indication of good value for this stock.
Examining the
Fidelity.com "eresearch" website, we find that JOSB has been assigned to the "Apparel Stores" industrial group. Within this group, Jos. A. Bank appears fairly valued with a Price/Sales ratio of 1.4. Leading this group is Chico's Fas (CHS) with a Price/Sales ratio of 4, followed by American Eagle (AEOS) at 2.2, Abercrombie & Fitch (ANF) at 2, Jos. A. Bank (JOSB) at 1.4, Limited (LTD) at 1.2 and Pacific Sunwear (PSUN) at 1.2. Thus, valuation by this measure also looks favorable for JOSB.
Finishing up with Yahoo, we see that there are 18 million shares outstanding with 17.30 million of them that float. As of 4/10/06, there were 5.07 million shares out short, representing 29.10% of the float or 12.5 trading days of volume. This looks quite significant to me, and may bode well for the stock if any significant good news or price move which could 'squeeze' the shorts.
As noted above, no cash dividends are paid, and the last stock split was a 5:4 split on 2/16/06.
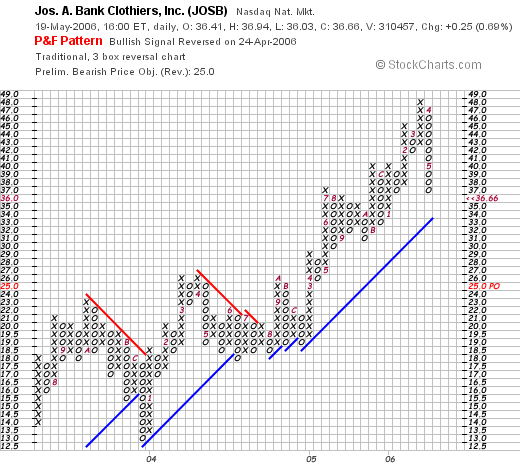
5. What does the chart look like?Reviewing the
"Point & Figure" chart on JOSB from StockCharts.com, we can see the steady improvement in stock price from the $14 level in July, 2003, to a peak of $48/share in March, 2006. The stock has recently corrected, along with the market, to the current level of $36.66/share. The stock does appear to be above support lines, which appear to be at the $34 level.
6. Summary: What do I think about this stock?
Let's review some of the things I noted above. First of all the latest quarterly report was strong with both revenue and earnings coming in above expectations. The Morningstar page was strong with steady revenue and earnings growth. The company has increased the float slightly which is a small concern. Free cash flow, while erratic, has been positive recently. The balance sheet is good with a current ratio of almost 2. Finally valuation looks nice with a p/e under 2.0 and a PEG under 1.0. The Price/Sales ratio is near the lowest of the group. In addition, there are a lot of sales already out short, which could contribute to supporting the stock price. The recent correction in the price is certainly of concern, and in fact, if the stock should fall another few points it shall be hitting my exit price. Meanwhile, things look encouraging.
Thanks so much for stopping by and visiting! If you have any comments or questions about this stock or anything else on the blog, please feel free to leave your comments, or you can email me at bobsadviceforstocks@lycos.com. Please be sure to drop by and visit my Stock Picks Bob's Advice Podcast Website where you can hear me discuss many of the stocks and issues addressed on the blog!
Bob
Posted by bobsadviceforstocks at 9:11 PM CDT
|
Post Comment |
Permalink
Updated: Sunday, 21 May 2006 11:09 PM CDT
"Looking Back One Year" A review of stock picks from the week of February 28, 2005

Hello Friends! Thanks so much for stopping by and visiting my blog,
Stock Picks Bob's Advice. As always, please remember that I am an amateur investor, so please remember to consult with your professional investment advisors prior to making any investment decisions based on information on this website.
In order to determine how my stock picks have turned out, I have been trying to review past stock picks each weekend. I am currently about 60 weeks out with this review process. Each weekend I review picks from that trailing period and advance a week the following weekend.
This review assumes a "buy and hold" strategy. In fact, I practice and recommend a disciplined portfolio management strategy involving selling losing stocks quickly and completely when they hit 8% losses and selling gaining stocks slowly and partially as they appreciate. This strategy will affect performance; for the sake of simplicity, I shall continue to evaluate past picks assuming a buy and hold approach, but please be aware that investment performance would be quite different with a different portfolio strategy.

On February 28, 2005, I
listed Alamo Group (ALG) on Stock Picks Bob's Advice when it was trading at $24.80/share. ALG closed at $21.33 on 5/19/06 for a loss for the pick of $(3.47) or (14.0)%.

On May 3, 2006, Alamo Group
announced 1st quarter 2006 results. Net sales grew 14% to $104.4 million compared to $91.3 million in the same quarter last year. However, excluding revenue from the acquisition of Spearhead Machinery, net sales would actually have been $87.8 million, a decrease of 4% from last year's results. Net income for the quarter came in at $1.9 million or $.20/diluted share down from $2.6 million or $.26/diluted share last year. There wasn't too much imho, to be excited about this report.

On March 2, 2005, I
posted Pacific Sunwear (PSUN) on Stock Picks Bob's Advice when it was trading at $28.52. PSUN closed at $22.68 on May 19, 2006, down $(5.84) or (20.5)% since posting.
On May 11, 2006, PSUN
announced 1st quarter 2006 earnings. Net sales for the quarter ended April 29, 2006, were $299.9 million, up 7.1% over sales of $280.0 million for the quarter ended April 30, 2005. Net income for the first quarter 2006 was $11.9 million or $.16/diluted share, down from $17.6 million or $.23/diluted share in the same period a year earlier. Indicative of the problems facing this company, same store sales decreased 1.8% for the comparable 13 week period ended April 29, 2006. Again, there wasn't much to 'write home about' on this stock!

Finally, on March 4, 2005 I
posted Perficient (PRFT) on Stock Picks Bob's Advice when it was trading at $9.33. PRFT closed at $13.00 on May 19, 2006, for a gain of $3.67 or 39.3% since posting.

On May 3, 2006, Perficient
reported 1st quarter 2006 results. For the quarter ended March 31, 2006, total revenue climbed 50% to $29.6 million compared to $18.3 million during the first quarter of 2005. GAAP earnings climbed 17% to $.07/share up from $.06/share during the same quarter last year. Of the three stocks, this stock had the only positive quarterly report imho and represented the only stock making a nice gain!
So how did I do picking stocks for that week back in early 2005? Well, there were two losing stocks and one gaining stock. Fortunately, the one gaining stock made up for the two losers and the three stocks had an average gain of 1.6%. Not too exciting, but positive in any case :).
Thanks so much for stopping by and visiting! If you have any comments or questions, please feel free to leave them on the blog or email me at bobsadviceforstocks@lycos.com. If you get a chance, please visit my
Stock Picks Bob's Advice Podcast Site where you can hear me discuss some of the stocks and questions I face on the blog!
Bob
Happy Birthday to Me! (Stock Picks Bob's Advice)
Hello Friends! Just a quick note to let you know that I am now celebrating my third birthday on Stock Picks Bob's Advice!

Please enjoy a slice of my birthday cake!
On May 12, 2003, I posted St Jude Medical on Stock Picks Bob's Advice with the following entry:
"St Jude Medical
This is one I picked up today. STJ is the stock symbol. I do not as I write and publish this own any shares. Am thinking about suggesting this to my stock club. Company had a great day today with a nice move on the upside. Last Quarter was good and the past five years have been steady growth. Closed at $55.30 up $2.92. So the daily momentum helped it make the list."
And how did that pick do? Well, St. Jude
has been under pressure recently. But with the 2:1 stock split on November 23, 2004, my pick price was actually $27.65. With STJ closing at $35.38 on 5/19/06, this still represents a gain of $7.73 or 28% since posting. Not fabulous, but not that bad either :).
And by the way, since the original post in May, 2003, I have now had 1,216 entries on this blog! My visit count is now up to 63,805, with 186 visits per day on the average. Just this past week I had 1,303 visits to my blog.
Other facts: I have a '
Xanga Shadow Blog, where I post almost all of my blogs from Tripod. In addition, I now have a
podcast website, where for the past six months, my first podcast was on November 27, 2005, and where I now rank in the top ten podcasts out of over 8,500 podcasts on Podomatic! It has been a blast!
Thanks so much for visiting my blog and making all of this possible. If you have any comments or questions, please feel free to leave them on the blog or email me at bobsadviceforstocks@lycos.com.
Bob
Saturday, 20 May 2006
Eagle Materials (EXP) May 20, 2006
Hello Friends! Thanks so much for stopping by and visiting my blog,
Stock Picks Bob's Advice. As always, please remember that I am an amateur investor, so please remember to consult with your professional investment advisors prior to making any investment decisions based on information on this website.

I came across Eagle Materials (EXP) yesterday, and wanted to write this one up this weekend before the market opens once again Monday morning. I do not own any shares of EXP or have any options. Eagle made the list of top % gainers Friday and closed at $52.21 on 5/19/06, up $2.49 or 5.01% on the day. Let's take a closer look at this company and see why I thought it attractive enough to include on this blog.
 1. What does this company do?
According to the Yahoo "Profile" on Eagle Materials, the company
"...engages in the manufacture and sale of basic building materials used primarily in commercial and residential construction, and public construction projects in the United States. The company engages in the mining of gypsum and limestone; manufacture and sale of gypsum wallboard; and in the manufacture, production, distribution, and sale of portland cement."
2. How did the company do in the latest reported quarter?On May 2, 2006, Eagle Materials
reported 4th quarter 2006 results. For the quarter ended March 31, 2006, revenue came in at $221.6 million, up 45% over the $153.3 million in revenue for the same quarter last year. Net earnings were $43.8 million, up 59% from $27.5 million in net earnings for the same period in the prior year. On a diluted per share basis, earnings increased 76% to $.86/share, up from $.49/share in the same quarter last year.
 3. How about longer-term results?
Reviewing the
"5-Yr Restated" financials on EXP from Morningstar.com, we can see the steady growth in revenue from $367.2 million in 2001 to $616.5 million in 2005 and $791.4 million in the trailing twelve months (TTM).
Earnings dropped from $1.07/share in 2001 to $.72/share in 2002. However, since 2002, earnings have steadily increased to $1.91/share in 2005 and $2.67/share in the TTM.
The company also pays a dividend, with $.07/share reported in 2001, increasing to $.40/share in 2005. (It appears that the company paid a special dividend in 2004 when $2.15/share is reported on Morningstar.com).
The number of shares outstanding has been quite stable with 55 million in 2003, decreasing to 50 million in the TTM.
Free cash flow is solidly positive with $106 million in 2003, dropping to $100 million in 2004 and increasing to $135 million in 2005.

The balance sheet appears satisfactory with $60.2 million in cash and $147.3 million in other current assets resulting in total current assets of $207.5 million, which, when compared with the $114.8 million in current liabilities yields a current ratio of 1.81. Anything 1.5 or higher is generally considered a healthy ratio. The company has $315 million in long-term liabilities.
4. How about some valuation numbers?Reviewing the
Yahoo "Key Statistics" on Eagle Materials, we can see that this company is a mid-cap stock with a market capitalization of $2.63 billion. The trailing p/e is nice at 17.29, and the forward p/e is even better (fye 31-Mar-08) of 10.02. The PEG (5 yr expected) is quite reasonable at 0.30. Thus the company is anticipated to grow its earnings at three times the rate suggested by the p/e ratio.
Looking at the
Fidelity.com eresearch website, we find that Eagle Materials is in the "cement" industrial group, and within this group EXP is at the top in terms of richness of valuation with a Price/Sales ratio of 3.5. EXP is followed by Florida Rock (FRK) with a Price/Sales ratio of 2.8, Cemex SA (CX) at 1.6, and Texas Industries (TXI) at 1.1.
Finishing up Yahoo, we see that there are 50.32 million shares outstanding with 47.97 milion that float. Currently, as of 4/10/06, there are 9.38 million shares out short, representing 18.80% of the float or 8.5 trading days of volume. This appears significant to me and may represent some of the buying pressure we observed Friday.
As already noted, the company pays a small dividend of $.70/share yielding 1.40%. The last stock split was a 3:1 split in February, 2006.
5. How does the chart look?Looking at the
"Point & Figure" chart on EXP from StockCharts.com we can see that the latest market correction is taking its toll.
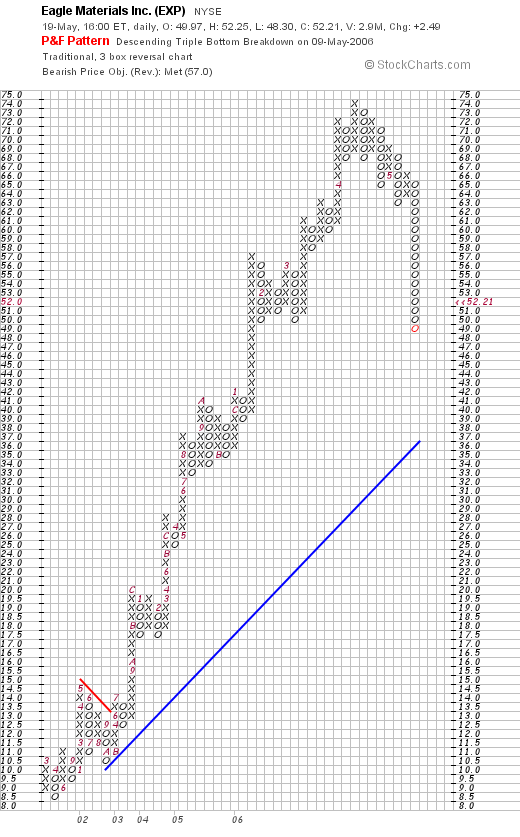
The stock has traded strongly since at least March, 2001, when the stock was at $10.50, climbing to a peak of $74 in April, 2006, before pulling back to the $49 level this month. The stock appears to be well above its support level and does not appear to have broken down technically.
6. Summary: What do I think?
Let's review some of the information from this post: first, the earnings were superb with solid revenue growth and earnings growth reported recently. The last five years, at least since 2002, have been solid as well with regular earnings and revenue growth reported. The company pays a small dividend and has been increasing the dividend. The number of shares outstanding has been stable and in the past 12 months has decreased.
Free cash flow is positive and growing. And the balance sheet appears solid.
Valuation-wise the p/e and PEG are cheap, but the Price/Sales ratio is a bit steep. Finally, the chart, which has pulled back some this past month, still appears to be above support levels and given the proper market environment might once again resume its rise. In other words, if I did have permission to be buying a stock, this is the sort of company that would be on my "short list".
Thanks again for visiting! Please feel free to drop me a line at bobsadviceforstocks@lycos.com if you have any comments or questions. Always feel free to leave your comments right on the blog as well. Finally, please be sure to come and visit my Stock Picks Bob's Advice Podcast Site where I discuss many of the same stocks I write about on the blog.
Bob
Friday, 19 May 2006
"Trading Transparency" Hibbett (HIBB)
Hello Friends! Thanks so much for stopping by and visiting my blog,
Stock Picks Bob's Advice. As always, please remember that I am an amateur investor, so please remember to consult with your professional investment advisors prior to making any investment decisions based on information on this website.
A few moments ago I sold my remaining 84 shares of Hibbett (HIBB) at $24.56. Yesterday, after the close of trading, HIBB
reported 1st quarter 2007 results. While earnings were up 12.9% over last year, and net sales were up 10.5%, the number that gave me pause was the same store sales report, which, for the quarter was
down 0.07%. Since the market is overall quite weak, I went ahead and pulled the plug on this holding with fundamental weakness in sales.
These shares were initially acquired 3/6/03 with a cost basis of $6.50/share. Thus, even though the stock is down sharply today, I sold with a gain of $18.06/share or 277.8% since my purchase of this stock.
It is a bit sad to part with such a great company like Hibbett in the portfolio, but the same store sales reports gave me a great deal of concern.
Thanks so much for stopping by! If you have any comments or questions, please feel free to drop me a line at bobsadviceforstocks@lycos.com or just leave them on the blog. Be sure to visit my
Stock Picks Bob's Advice Podcast Site where I talk about many of the same companies I write up on the blog.
Bob
Wednesday, 17 May 2006
Maintaining Trading Discipline in a Declining Market
One of my greatest challenges as an investor is knowing how to deal with market declines and investment losses. One would like to have something automatic like this
Rube Goldberg machine.
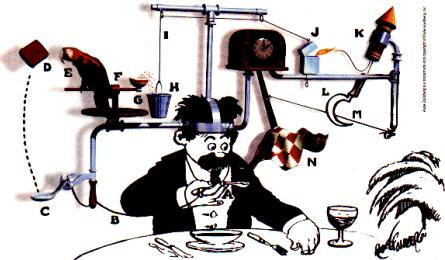
In other words, to have a trading system that will diminish your losses in a bear market and maximize your gains in a bull market.
Too often we find our emotions working against our own best interests. When investments decline we rationalize the losses and defer the realization implicit in a sale of holdings at a price below their cost. This exposes our investments to greater losses and delays the eventual 'day of reckoning'.
In the same fashion, as stocks move higher, our greed overcomes our rational thoughts and we delay realizing some of the gains by selling a portion of the holding, and instead allow our dreams of larger and greater profits override our need to 'lock-in' some gains with a sale.
Within every successful trading system there should be a method of avoiding the problem of compounding one's losses while at the same time encouraging the compounding of gains. In other words, when investments within a portfolio develop losses, they should be sold at a predetermined price point and the proceeds from such sales should not be re-invested; instead, the proceeds should be kept in cash to be re-invested when an appropriate buy signal occurs.
In the same fashion, when stocks are sold on 'good news' events, such as price appreciation, this should also be considered a bullish indicator and the proceeds from such good news sales should be re-invested in a new stock position.
I have expressed this strategy as being hardest on declining stocks that are sold completely and quickly on developing losses, and easiest on gaining stocks which are on the other hand sold slowly and partially as they appreciate in price. This bias will also select for the strongest stocks within your portfolio.
A strategy with pre-determined sale points both on the upside and downside reduces trading stress as one simply needs to review the stock price to determine one's action. It is the requirement for arbitrary decisions that may lead to over-trading as well as under-trading of one's holdings.
No system can respond quickly enough to avoid all losses and lock in all gains. However, having a system that can move one's holdings back and forth from equities to cash and back again, should be helpful in the long-run in building one's assets by maximizing gains and minimizing losses.
Wishing my readers the very best of luck in dealing with the difficult investing environment we are all facing!
Bob
Tuesday, 16 May 2006
FactSet Research Systems (FDS) Revisiting a Stock Pick
Click HERE FOR MY PODCAST ON FACTSET RESEARCH (FDS)Hello Friends! Thanks so much for stopping by and visiting my blog,
Stock Picks Bob's Advice. As always, please remember that I am an amateur investor, so please remember to consult with your professional investment advisors prior to making any investment decisions based on information on this website.

I was looking through the list of
top % gainers on the NYSE today and saw that an 'old favorite' of mine from this blog, FactSet Research Systems, Inc. (FDS) was on the list. In fact, FDS closed at $46.23, up $3.64 or 8.55% on the day. I do not have any shares or options on this stock.
I first
posted FDS on Stock Picks Bob's Advice on June 17, 2003, when it was one of the first selections on this blog, trading at $40.39/share. Adjusted for a 3:2 stock split on February 7, 2005, this pick was actually selected at a price of $26.93/share. Thus, with the stock closing at $46.23, this represents an appreciation of $19.30 or 71.7% since I first 'picked' the stock here on the blog.
Almost exactly a year ago, on May 18, 2005, I
again posted FactSet (FDS) on Stock Picks Bob's Advice, when it was trading at $31.53. With today's close at $46.23, the stock has appreciated $14.70 or 46.6% since posting in the past year.
And today, with the stock once again on the move, I have posted FDS on Stock Picks for the third time! Let's take a closer look at this company and let me show you why I believe it deserves another review!
1. What exactly does this company do?According to the
Yahoo "Profile" on FactSet Research, the company
"...supplies economic and financial data and analytics to the investment community worldwide. The company’s applications provide users access to company analysis, multicompany comparisons, industry analysis, company screening, portfolio analysis, predictive risk measurements, alpha and backtesting, portfolio optimization, and real-time news and quotes."
2. What about the latest quarterly results?On March 21, 2006, FactSet
reported 2nd quarter 2006 results. Revenue for the quarter came in at $93.7 million, up 23% from the prior year's $76.5 million and also
beating consensus of $92.3 million expected. Net income grew to $19.2 million or $.38/share, up from $17.2 million or $.34/share the prior year. This also beat expectations of $.37/share as reported. In addition, the company raised guidance on the upcoming quarter for revenue, with $95-$97 million now expected, up from analysts' expectations of $94.9 million.
Thus from my perspective this quarterly report did everything right: reporting increased revenue, increased earnings, exceeding expectations and raising guidance. Something I call the "trifecta plus"!
3. How about longer-term results?Reviewing the
"5-Yr Restated" financials on FDS from Morningstar.com, we find first of all that revenue growth has been uninterrupted with $167.6 million in 2001 growing to $312.6 million in 2005 and $345.4 million in the trailing twelve months (TTM).
Earnings during this period have also steadily grown from $.64/share in 2001 to $1.43/share in 2005 and $1.52/share in the TTM.
An added bonus is the fact that the company pays a dividend which has also been steadily increased from $.09/share in 2001 to $.20/share in 2005. Interestingly, the company has been retiring shares with 51 million in 2002, dropping to 48 million in 2005 (although rebounding slightly to 49 million in the TTM).
Free cash flow has been positive with $66 million reported in 2003, $45 million in 2004, $72 million in 2005 and $99 million in the TTM.
The balance sheet also looks solid with $90.2 million in cash which by itself can pay off both the $66.4 million in current liabilities and the $18.0 million in long-term liabilities comgined. Calculating the 'current ratio' gives us a total of cash and other current assets at $157.4 million, which when compared to the $66.4 million of current liabilities results in a current ratio of 2.37.
4. What about some valuation numbers on this stock?Reviewing
Yahoo "Key Statistics" on FactSet Research, we find that this is a mid-cap stock with a market capitalization of $2.25 billion. The trailing p/e is a bit rich at 30.29, with a forward (fye 31-Aug-07) p/e of 25.97. The PEG is also a bit rich with a ratio of 1.62.
The
Fidelity.com eresearch website demonstrates that in terms of the Price/Sales ratio, FDS is also richly priced with a ratio of 6.3 leading the "Information/Delivery Services" industrial group. Following FactSet is Wright Express (WXS) at 4.9, Jupitermedia (JUPM) at 4.4, Alliance Data Systems (ADS) at 2.6 and DST Systems at 1.8. By this measure as well, FDS is priced richly.
Returning to Yahoo, we find that there are 48.68 million shares outstanding with 37.61 million that float. As of 4/10/06, there were 2.32 million shares out short representing 5.6% of the float or 8.2 trading days of volume. I believe any short interest over 3 days is significant and may contribute to a "squeeze" of the short sellers.
As noted earlier, the company pays $.20/share in dividends yielding 0.5%. Also as noted above, the company last split its stock in a 3:2 fashion.
5. What about a chart?Looking at the
"Point & Figure" chart on FDS from StockCharts.com:
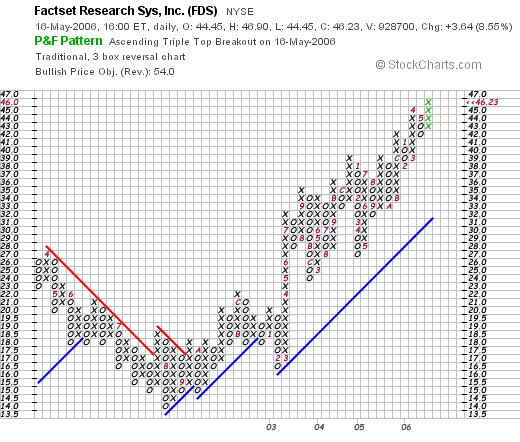
We can see that this stock actually was trading lower from $28/share in April, 2002, to a low of $14/share in August, 2002. Since bottoming at that time, the stock has actually been trading stronger, first breaking resistance at $17, and now moving sharply higher to close at $46.23, which appears to be a new high for the stock.
6. Summary: What do I think?
Let's review some of the things that I have discussed above on this stock. First of all, the stock moved nicely higher today on an upgrade from Piper Jaffray. The latest quarter showed everything I like to see in a quarterly report: revenue growth, earnings growth, beating expectations and raising guidance.
The Morningstar.com report is also quite nice with steady revneue and earnings growth the past few years. The company even pays a small dividend and has been increasing it each year. In addition, the company has reduced the number of shares outstanding which is also an important detail of this analysis.
The company is generating an increasing level of free cash flow and has a strong balance sheet.
Valuation wise, the p/e is above 30, the PEG is just over 1.5, and the price/sales is just a little over 6, making it the priciest stock in its industrial group. On a postiive note the relatively large amount of short interest may be supportive and may even be driving the stock higher in the face of solid earnings. And finally, the stock chart looks strong and does not appear overextended.
I like FDS but it is not a 'bargain'. Any blemish could find this stock correcting. However, there are few other stocks with as consistent a growth bias as FactSet and this has been an excellent pick for me as demonstrated by the price appreciation from 2003 and 2005. Unfortunately I don't own any of these shares!
Thanks so much for stopping by and visiting. If you have any comments or questions, please leave them on the blog or email me at bobsadviceforstocks@lycos.com. If you get a chance, please do come and visit my Stock Picks Bob's Advice Podcast Site.
Bob
Posted by bobsadviceforstocks at 10:55 PM CDT
|
Post Comment |
Permalink
Updated: Tuesday, 16 May 2006 11:49 PM CDT
Newer | Latest | Older


