Stock Picks Bob's Advice
Sunday, 25 June 2006
Kyphon (KYPH) "Weekend Trading Portfolio Analysis"
 CLICK HERE FOR MY PODCAST ON KYPHON
Hello Friends! Thanks so much for stopping by and visiting my blog,
Stock Picks Bob's Advice. As always, please remember that I am an amateur investor, so please remember to consult with your professional investment advisors prior to making any investment decisions based on information on this website.
This blog serves a lot of different purposes. For one thing, I am trying to enhance my ability in picking stocks for potential price appreciation. In addition, I am working on my own trading strategy that determines which stocks to buy, when to buy them and when to sell them. I guess that is something we are all trying to do!

As part of my effort on "transparency" I regularly list my trading portfolio within the posts of the blog, and on weekends, try to review each of my individual holdings to see how they are doing, and what their current fundamentals look like. This post is about Kyphon (KYPH), the next stock in my actual trading portfolio going alphabetically after Jos. A. Bank (JOSB), which I now no longer own, but which I
reviewed on Stock Picks Bob's Advice on May 21, 2006. So let's take a look at Kyphon, see how I have done with this investment and what the current evaluation looks like. (Is that another dangling participle?)
Before I get to the actual review of Kyphon, let me point out that this stock is an 'old favorite' of mine, having first
posted Kyphon on Stock Picks Bob's Advice on October 30, 2003 , and
revisited this Stock Pick on May 20, 2005. This is also the second time that I have owned this stock having purchased 300 shares of Kyphon on April 5, 2004, and sold all 300 shares with a loss of $(734.69) after only 8 days, selling the shares on April 13, 2004.
My current holdings of 150 shares of Kyphon were purchased May 20, 2005, with a cost basis of $29.21/share. I have already sold 50 shares of my original 200 that were purchased 7/8/05 at a price of $37.98, with a gain of $8.77 or 30%, my first targeted appreciation point. At that date I was selling 1/4 positions of my stock. Subsequently, I have adjusted this to 1/6th positions at targeted gains to avoid diminishing the size of my original investment.
KYPH closed at $34.69 on June 23, 2006, for an unrealized gain of $5.48 or 18.8% since my purchase. Since I have already sold one portion of my original holding at a gain, my next targeted sale on the downside would be at break-even or $29.21. On the upside, my next partial sale (1/6th of my remaining shares) is planned at a 60% appreciation point, which would work out to 1.60 x $29.21 = $46.74.
Anyhow, that's what I have been doing with Kyphon....let's take a closer look at the stock itself.
 1. What does the company do?
According to the
Yahoo "Profile" on Kyphon, the company
"...engages in the design, manufacture, and marketing of medical devices to treat and restore spinal anatomy using minimally invasive technology. Its products include KyphX Bone Access Systems, which is used to create a working channel into fractured bone; KyphX Xpander, Elevate, Exact, and Express inflatable bone tamps, which are disposable sterile devices that combine the functionality of a metal bone tamp with the engineering principles of medical balloon technologies."
2. How did they do in the latest quarter?On April 27, 2006, Kyphon
reported 1st quarter 2006 results. Net sales for the quarter ended March 31, 2006, came in at $91.4 million, a 38% increase over the same quarter in the prior year result of $66.2 million. Earnings per diluted share grew 27% to $.19/share up from $.15/share the prior year. The company related in the report how due to new accounting requirements related to stock-based compensation, these results would have been even better without this additional reporting included.
3. How has Kyphon been doing longer-term?
Reviewing the
Morningstar.com "5-Yr Restated" financials, we find that revenue has steadily and rapidly grown from $36.1 million in 2001 to $306.1 million in 2005 and $331.3 million in the trailing twelve months (TTM).
Earnings, which dipped from $.65/share in 2003 to $.50/share in 2004, increased to $.66/share in 2005 and $.70/share in the TTM. It should be noted that the company has been modestly increasing its shares outstanding from 38 million in 2003 to 44 million in the TTM. However, this less than a 16% increase in shares outstanding has been accompanied by an almost 300% increase in revenue.
Free cash flow has grown from $9 million in 2003 to $65 million in the TTM.
Insofar as the balance sheet is concerned, Kyphon looks terrific with $217.2 million in cash reported enough to cover both the combined $64.7 million in current liabilities and the modest $8.9 million in long-term liabilities combined almost three times over! If we calculate the current ratio by adding the $217.2 million in cash with the $85.8 million in other current assets, we have $303 million in total current assets which when divided by the $64.7 million in current liabilities yields a current ratio of 4.68. Generally speaking, a current ratio of 1.5 or higher is considered 'healthy' so a ratio of 4.68 is very strong indeed!
4. How about some valuation numbers on this stock?
Reviewing
Yahoo "Key Statistics" on Kyphon, we find that the stock is a mid-cap stock with a market capitalization of $1.53 billion. The trailing p/e is rich at 49.77, and the forward p/e is a bit better (fye 31-Dec-07) at 27.75. In spite of this rich p/e, the (5 yr expected) PEG is only 1.11, still suggesting that the stock is reasonably priced (imho).
Using the
Fidelity.com eresearch website, we find that Kyphon is in the "Medical Instruments/Supplies" industrial group. Looking at the Price/Sales ratio, we can see that KYPH is second richest in valuation by this parameter with a Price/Sales ratio of 4.8. Topping this group is another of my "picks" Cytyc (CYTC) at a ratio of 5.9. Following KYPH is Stryker (SYK) at 3.7, Becton Dickinson (BDX) at 2.8, Baxter International (BAX) at 2.4 along with Boston Scientific (BSX) at 2.4.
Looking at profitability, specifically the "Return on Equity" (ROE), we find that Kyphon is lowest in this group with a ROE of 13.2%. Topping this group is Baxter (BAX) at 21.8%, Cytyc (CYTC) at 20.7%, Becton Dickinson (BDX) at 20.3%, Stryker (SYK) at 20.2% and Boston Scientific at 14.1%.
Thus by these particular ratios we find the disturbing combination that this particular company is the second 'richest' in valuation by the Price/Sales ratio in this group while being the last in terms of profitability. Clearly, this stock is being valued in terms of future results and not entirely by current performance.

Finishing up with Yahoo, we find that there are 44.22 million shares outstanding and 43.29 million that float. Of these shares, 6.08 million are out short representing 13.80% of the float or 10.8 trading days of volume (the short ratio) as of May 10, 2006. Using my own 3 day short ratio rule, this appears significant, and may lead to a short "squeeze" if the company should continue to report strong financial results. The second quarter which ends in a few day should be reported in a few weeks.
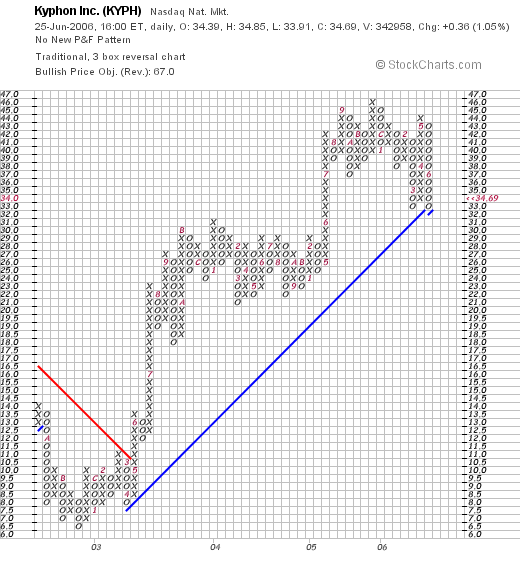
5. What does the chart look like?If we review the
"Point & Figure" chart on Kyphon from StockCharts.com, we can see that the company dipped from $14.00 in late 2002, to a low of $6.50 in November, 2002. Since then the stock has been moving higher to a high of $46 in November, 2005. The stock has been consolidating in this range and is now testing its "support line" at the $33.00 range. It clearly has been under pressure the past month while the market has corrected, however, it does not appear to have totally broken-down at this point.
6. Summary: What do I think about this stock?
First of all I like this stock enough to own it :). But seriously, looking through the information I have examined, we find that this company is a 'young' medical device manufacturer that is demonstrating its ability to grow sales strongly, is increasingly profitable, is generating increasing free cash flow and has a great balance sheet. Valuation-wise, we find that this company may be 'priced for perfection'. The p/e is rich at 49.77, but the PEG is nice at 1.1 suggesting the expected rapid earnings growth. The Price/Sales ratio is also second in its group indicating the rich valuation. And the ROE is at the bottom of its group, pointing out that profitablility, which is likely improving quickly, is still not robust relative to other stocks in its industrial group. On the plus side, there are lots of people betting against the stock with over 10 days of short interest outstanding. However, with a solid earnings report next month, this could turn against the shorts. In addition, the chart still looks strong although on the short-term, it has been under pressure alongside most of the stocks in the market.
Anyhow, that's my review of Kyphon, one of the stocks I still own in my trading portfolio! Thanks so much for stopping by and visiting! If you have any comments or questions, please feel free to leave them on the blog or email me at bobsadviceforstocks@lycos.com. Please also remember to visit my Stock Picks Bob's Advice Podcast Site where you can listen to me talk about many of the same stocks I write about on this blog!
Enjoy the rest of your weekend!
Bob
Posted by bobsadviceforstocks at 9:59 AM CDT
|
Post Comment |
Permalink
Updated: Sunday, 25 June 2006 12:40 PM CDT
Saturday, 24 June 2006
"Looking Back One Year" A review of stock picks from the week of March 21, 2005

Hello Friends! Thanks so much for stopping by and visiting my blog
Stock Picks Bob's Advice. As always, please remember that I am an amateur invesor, so please remember to consult with your professional investment advisors prior to making any investment decisions based on information on this website.
I apologize for missing a couple of weekend reviews. Long story. But anyway, I am back on track!
In order to assess the validity of what I write about here on this website, I have been trying to review past picks going a week at a time. I review all of the picks that week and calculate their performance based on a simple "buy and hold" strategy.
In practice, I actually manage my portfolio in a disciplined fashion, selling my poorly performing stocks quickly and completely, and selling my stronger appreciating investments slowly and partially at targeted appreciation points. This difference in strategy will of course affect performance.

On March 23, 2005, I
posted Forest Laboratories (FRX) on Stock Picks Bob's Advice when the stock was trading at $37.90. Forest closed at $37.56 on June 23, 2006, for a loss of $(.34) or (.9)% since posting.

On April 25, 2006, Forest Laboratories
announced 4th quarter 2006 results. For the quarter ended March 31, 2006, revenue for the quarter increased 16% to $756 million from $653 million the prior year same period. Diluted earnings per share grew 87% to $.28/share from $.15/share in the prior year same period.

On March 25, 2005, I
posted Aladdin Knowledge Systems (ALDN) on Stock Picks Bob's Advice when Aladdin was trading at $23.26. ALDN closed at $19.46 on June 23, 2006, for a loss of $(3.80) or (16.3)%.
On April 24, 2006, ALDN
reported 1st quarter results. Revenue for the quarter rose to $22.9 million from $20.3 million the same period last year exceeding analysts' expectations of $22.6 million. Net income climed to $3.8 million or $.25/share, up from $1.2 million or $.10/share in the prior year same period. Analysts had been expecting earnings of $.27/share. Thus, revenue exceeded expectations, but earnings which grew nicely
didn't quite meet expectations.
So how did we do with these two stock picks from that week a little over a year ago? In a word, mediocre :(. These stocks had an average loss of (8.6)%.
Thanks so much for stopping by and visiting! If you have any comments or questions, please feel free to drop me a line at bobsadviceforstocks@lycos.com or leave your comments right on the blog and be sure to visit my
Stock Picks Bob's Advice Podcast SiteBob
Thursday, 22 June 2006
A Reader Writes "HELX....Since then the stock has gone down. Any ideas?"
Hello Friends! Thanks so much for stopping by and visiting my blog,
Stock Picks Bob's Advice. As always, please remember that I am an amateur investor, so please remember to consult with your professional investment advisors prior to making any investment decisions based on information on this website.

Earlier today I had a nice letter from Marie B. who wrote:
"I bought Cal Dive, 200 shares at 36.00. It went up to around 45.
Then I decided to buy some more and when I started to, it had a name change to Helx.
I bought 1,000 shares at 39.80.
Then there was an announcement that Cal Dive, a wholly owned subsidiary of Helx was coming out with an IPO.
I said What??
How can an established company with issued stock, making good money, change the name and then come out with an IPO?
The logic of this has been figured every which way, by me, and I can't figure it out. It seems to me all the gravy is going to go to new stockholders, while I originally bought it for the earnings.
Now Cal Dive = Helx is call an energy solution company.
Since then the stock has gone down.
Any ideas?
Marie B."
First of all Marie, thank you so much for writing. I would hate to say that 'your guess is as good as mine' for an answer, but maybe I can shed some insight on your excellent question.
Before I do, I want to emphasize one thing about my investment approach. While I am concerned about things management does, the most important driving factor in my investment decision process is the price of the stock itself. If indeed you had reached a 30% gain (which you were close to if not there), I personally would begin selling shares and not averaging up. Then if the stock had dropped to break-even, I would have sold the whole thing kit-and-kaboodle! But that is my approach, and yours might be even better. I do like the idea of making a small investment and then if the stock appreciates a certain amount, making my "full" investment. However, that's not what I do around here :).
I found most of the information regarding your question (by the way if you read my last post you will see that I have now sold out of my remaining shares of Helix) on the Company Website. On February 27, 2006, Cal Dive (CDIS)
announced the name change from Cal Dive (CDIS) to Helix Energy Solutions Group (HELX). As they reported in the news release:
"The choice of an appropriate new name has perplexed us for many months; however, we believe that the acquisition of Helix RDS last year brought us a perfect answer. A helix is of course a spiral, but, more interestingly, a double helix is the natural shape that defines the structure of DNA, a basic building block of all of us. The two strands of the double helix are anti - parallel, which means that they run in opposite directions.
"The clear analogy for us is that we regard it as entirely natural for our strategy to have the two strands of energy service and production. These strands have also proven to be counter cyclical, as service activity lags changes in the commodity prices which drive production returns.
"Therefore, our new name will be HELIX ENERGY SOLUTIONS and we pledge to continue to focus on both high quality service provision and value adding oil and gas production, as a partner and operator.
"While we take the name of one subsidiary, we will on pass 'Cal Dive' to our Shelf services business unit. We may then sell a minority stake in it via an initial public offering later this year. This press release does not constitute on offer of any securities for sale. The proceeds from such a sale would be used to help finance a planned investment program in service assets that are more core to our strategy, e.g., production facilities or even a second Q4000-type vessel.
"We look forward to the support of all our stakeholders as this 'twist' of fate unfolds. In return we will strive daily to be as successful as 'Cal Dive' has always been."
The very next day the company
announced an outstanding 4th quarter 2005 result with revenue climbing to $264 million from $163 million the prior year. Diluted earnings more than doubled from $.32/share in the fourth quarter of 2004 to $.69/share in the same quarter in 2005. What more could an investor want?
On May 2, 2006, the company now named Helix (HELX)
announced 1st quarter 2006 results. These were also outstanding with revenue growing from $159.6 million to $291.6 million in 2006. Earnings came in at $.67/share, up sharply for the first quarter 2006, from $.32/share in the same quarter in 2005. In addition the company raised the lower end of earnings guidance for the full year 2006 to $2.70 to $3.30/diluted share. What else could an investor want?
As you noted, the company essentially spun off some of its ownership of the now Cal Dive subsidiary through an IPO of stock. This was not an IPO for the entire company but rather for an interest in one of its now sibsidiaries: Cal Dive. As noted in the
report,
"Helix Energy Solutions Announces Filing for Initial Public Offering of a Minority Stake in Its Subsidiary, Cal Dive International, Inc.
HOUSTON, May 31 /PRNewswire-FirstCall/ -- Helix Energy Solutions Group, Inc. (Nasdaq: HELX) announced today that Cal Dive International, Inc. (a wholly-owned subsidiary) filed with the Securities and Exchange Commission a Form S-1 for its planned initial public offering (IPO) of a minority interest in Cal Dive's common stock.
The offering will be made only by means of a prospectus. Once available, preliminary prospectuses may be obtained from Cal Dive International, Inc., 400 North Sam Houston Parkway E, Houston, Texas 77060 or by calling (281) 618-0400."
The news story explained:
" About Cal Dive International, Inc.
Cal Dive International, Inc., a wholly-owned subsidiary of Helix Energy Solutions, is a marine contractor that provides diving, pipelay and pipe burial services to the offshore oil and natural gas industry.
About Helix Energy Solutions
Helix Energy Solutions is an energy services company that provides innovative solutions to the oil and gas industry worldwide for marginal field development, alternative development plans, field life extension and abandonment, with service lines including diving services, shelf and deepwater construction, robotics, well operations, well engineering and subsurface consulting services, platform ownership and oil and gas production."
So indeed this is all very confusing. And I don't think the "street" much liked it either. Anyhow, I don't think much about all of this accounting stuff. If the stock price indicates I should sell shares, I do so whether on good or bad news. However, sometimes, if you see something which seems
peculiar or
confusing, you might just want to back out of an investment. This particular maneuver doesn't sound too bad to me. It appears that the company wants to spin-off the CalDive subsidiary to the public and use the funds to enhance the Helix Energy portion of the company. I suppose they view the development of oil and natural gas assets, if I am understanding this properly, of more potential than the CalDive underwater work. Just my guess.
Let's take a quick look at the chart and see
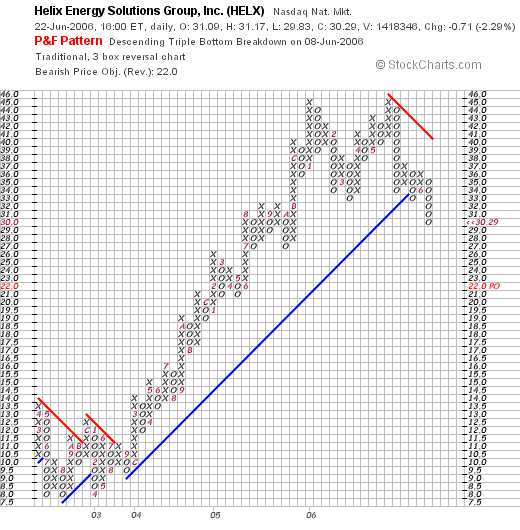
when the company started showing technical weakness in the price. Looking at the
Helix Energy Solutions "Point & Figure" chart from StockCharts.com, we can see that the stock price actually started showing weakness way back in January, 2006, and then in May, 2006, even before the IPO announcement, the company stock price was struggling.
But is this really due to the stock or is it just the lousy market banging up this stock?
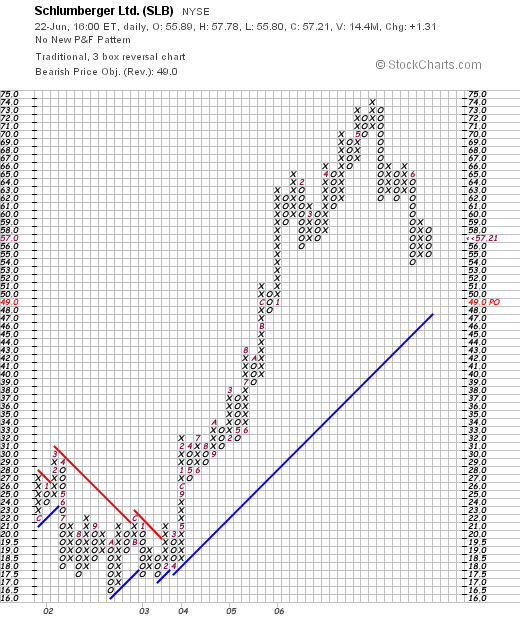
Let's take a look at another oil service stock: Schlumberger (SLB) and I think you will see some similarity in the "Point & Figure" chart from StockCharts.com on SLB:
Or to finish up with this point, let's take a look at another oil service firm, Baker Hughes (BHI), which has a "Pont & Figure" chart on BHI:
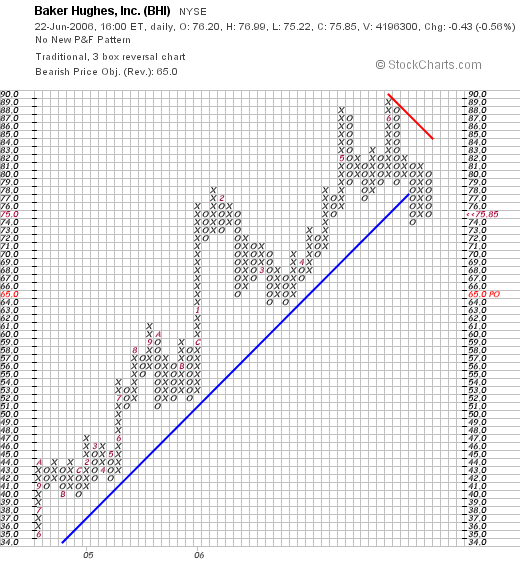
I think you see my point.
All of the stocks in this industrial group, and indeed in the entire market started breaking down in May. So while we can be annoyed and confused and perplexed about all of the dealings of the Management of this company, there are larger forces afoot called the stock market that were bearing down on this stock like so many others.
Getting back to my original point about responding to the price of stocks and not what the meaning of all of the news really is. I just am not good enough to tell if the accounting strategy and spin-offs are good for the investors or not.
I do know when I am losing or making money however :).
Thanks so much for stopping by, visiting and writing a letter!!! Your input and participation is greatly appreciated.
Please be sure to send your comments and questions to bobsadviceforstocks@lycos.com. Let me know your name (first name and location is adequate) and how you use my blog, etc. Also, be sure to stop by and visit my Stock Picks Bob's Advice Podcast Site.
Bob
Wednesday, 21 June 2006
"Trading Transparency" HELX
CLICK HERE FOR MY PODCAST ON THE HELIX SALE AND I SING A SONG 'THE FOX' ;)Hello Friends! Thanks so much for stopping by and visiting my blog,
Stock Picks Bob's Advice. As always, please remember that I am an amateur investor, so please remember to consult with your professional investment advisors prior to making any investment decisions based on information on this website.
One of the peculiarities of my portfolio management system is my approach to selling stocks. I sell stocks, as most traders do, on basically two situations: either on "good news" as my stock market appreciates in price in which case I am selling partial positions--usually 1/6th of my holdings; or on "bad news' which means that the stock has declined from a certain point and given me a sell signal.
I have three points at which I plan on selling a stock on "bad news": either at an 8% loss after an initial purchase, at "break-even" if I have sold a partial position of the stock one time (usually at a 30% target), or at a 50% retracement of the highest sale point on "good news". The last sale may be the most complex to explain. But it really isn't that complicated. If I have sold a portion of a stock at 60%, then I sell
all of my remaining shares if the stock retraces to a 30% appreciation point. This goes on for all of my partial sales. In the case of Helix Energy Solutions (HELX) (the former CalDive), I had sold the stock four times (!), with the last sale being at a 120% appreciation level. Thus, my targeted sale of all of my remaining shares was at a 60% appreciation point. The stock passed that point in the last day or two and is actually moving higher today.
A few moments ago, I sold my 142 shares of HELX at $29.84. These shares were acquired 11/3/04, at a cost basis of $19.10/share. Thus, I had a gain of $10.74 or 56.2% on this sale. However, after the initial purchase I made four sales at gains, selling 50 shares on 2/25/05, 37 shares on 8/1/05, 28 shares on 11/22/05, and 28 shares on 1/12/06. Thus with four sales, at 30, 60, 90 and 120% gains, my targeted sale point on the downside was at 60% appreciation. Coming back from a few days away from the market, I realized that HELX had passed that sale point, and this morning, remaining under the 60% appreciation point, I went ahead and sold my remaining shares.
Fortunately, stocks are trading a little healthier today, and I may soon be able to add a new position instead of continuing to unload my portfolio at targeted sales. But in the meantime, I shall continue to strive to maintain trading discipline and follow the rules that I have established for my portfolio.
Thanks so much for stopping by and visiting! If you have any comments or questions, please feel free to email me at bobsadviceforstocks@lycos.com and please be sure to visit my
Stock Picks Bob's Advice Podcast Site.
Bob
Posted by bobsadviceforstocks at 9:30 AM CDT
|
Post Comment |
Permalink
Updated: Wednesday, 21 June 2006 11:58 PM CDT
Tuesday, 20 June 2006
Gildan Activewear (GIL) "Revisiting a Stock Pick"
CLICK HERE FOR MY PODCAST ON GILDANHello Friends! Thanks so much for stopping by and visiting my blog,
Stock Picks Bob's Advice. As always, please remember that I am an amateur investor, so please remember to consult with your professional investment advisors prior to making any investment decisions based on information on this website.

It is great to be back blogging after a few days off. Nothing much has happened to my trading portfolio. The market seems to be bouncing around in here looking for some support. Hopefully, the stock continues to move higher from this level.

Looking through the
list of top % gainers on the NYSE today, I came across an old favorite of mine, Gildan Activewear (GIL), which as I write is trading at $41.65, up $3.05 or 7.90% on the day. I do not own any shares or have any options in this stock.
I first
posted Gildan on Stock Picks Bob's Advice on December 2, 2004, when the stock was trading at $32.65. GIL had a 2:1 stock split on June 1, 2005, making my effective stock pick price actually $16.33. With the stock currently trading at $41.65, this represents a gain of $25.32 since my original post or 155.1%! (It's too bad that I
didn't buy any shares of this one!)
Let's take a closer look at this stock and I will show you why it still deserves a spot on this blog.
1. What does the company do?As
described in the Yahoo "Profile", the company
"...engages in the manufacture and marketing of basic activewear for sale principally into the wholesale imprinted activewear market in Canada, the United States, Europe, and Asia/Pacific. The company manufactures and sells 100% cotton t-shirts and 50% cotton/50% polyester t-shirts, placket collar sport shirts, and fleece products in various weights, sizes, colors, and styles. It also sells its products as ‘blanks’, which are decorated with designs and logos for sale to end users."
2. Is there any news to explain today's move?In a
news story today (6/20/06), the company reported an acquisition of Kentucky Derby Hosiery, a U.S. hosiery manufacturer based in Hopkinsville, Kentucky. As the report noted:
"Based on Kentucky Derby's current level of profitability, the acquisition will initially be neither accretive nor dilutive to Gildan's earnings. However, once the integration of Kentucky Derby is complete, Gildan currently expects the acquisition to enhance annual E.P.S. by approximately U.S. $0.30. Gildan plans to undertake the integration process during fiscal 2007 and 2008."
On top of this acquisition, the company
raised guidance for its third fiscal quarter, and indicated it should achieve or exceed analyst consensus of $.67. Previously, the company had guided at $.63/share. They also raised guidance for the full 2006 fiscal year to $2.00/share, up from $1.96 previously estimated. Both the acquisition, which was thought to be
accretive for the company's finances and the overall raised guidance was enough to push the stock higher today.
 3. How about the latest earnings results?
Last month, on May 4, 2006, Gildan
reported 2nd quarter 2006 results. For the quarter ended April 2, 2006, Gildan reported net earnings of $31.0 million and diluted eps of $.51/share, with net earnings up 40.3% and eps climbing 37.8% from the $22.1 million and $.37/diluted share reported in the second quarter of fiscal 2005. Sales for the quarter increased 11.2% to $183.8 million, from $165.3 million in the same quarter last year.
Importantly, this $.51/share reported, exceeded previous company guidance of $.45/share. At the same time, the company raised guidance for the full fiscal year to $1.96/share, up from $1.90/share of previous guidance. (As I wrote above, this month, the company went ahead and raised guidance again to $2.00/share for the fiscal year.)
Thus, with this report, the company did what I call a "trifecta-plus", that is, they reported increased earnings and revenue, beat expectations, and raised guidance!
 4. What about longer-term results?
For this information, let's review the
Morningstar.com "5-Yr Restated" financials. Starting out with revenue, the bar-graphs show a perfect picture of steady revenue growth from $330.4 million in 2001 to $653.9 million in 2005.
Earnings have increased steadily from $.01/share in 2001 to $1.01 in 2004 and $1.43/share in 2005. The company has slowly increased the float from 53 million shares in 2001 to 60 million in 2005. This is a 14% increase in shares accompanied by an almost 100% increase in revenue from 2001 and an almost 100% increase in earnings from 2002. In other words, while I would prefer to see shares not increasing, if the company can increase its revenue and earnings many times faster than the increase in shares, I can handle it!
And the free cash flow? Unfortunately, I don't see these numbers on Morningstar.com. However, if we look at the balance sheet, we can see that the company has $69.8 million in cash and $258.0 million in other current assets, giving them a total of $327.8 million in total current assets. When compared to the $112.9 million in current liabilities, this results in a current ratio of 2.90. In addition, the company has $64.1 million in long-term liabilities.
5. What about some valuation numbers?
Reviewing
Yahoo "Key Statistics" on Gildan, we can see that this is a mid-cap stock with a market capitalization of $2.52 billion. The trailing p/e is a moderate 23.08 with a forward p/e of 16.61. Utilizing the 5-yr expected earnings, gives us a PEG of only 0.81.
Using the
Fidelity.com eresearch website, we can see that within the industrial group of "Textile-Apparel Clothing", Gildan is richly priced with a Price/Sales ratio of 3.4. This is the top of the group and is followed by Bebe Stores (BEBE) with a Price/Sales ratio of BEBE. Next is Guess? (GES) at 1.9, Columbia Sportswear (COLM) at 1.4, Quiksilver (ZQK) at 0.8, and Hot Topic at 0.7.
In terms of profitability, Gildan is at the tops of its group with a Return on Equity (ROE) of 25.7%. This is followed by Guess? (GES) at 24.3%, Bebe (BEBE) at 19.9%, Columbia (COLM) at 17.5%, Quiksilver (ZQK) at 10.8%, and Hot Topic (HOTT) at 7.9%. Thus, while valuation is rich by Price/Sales ratios, profitability is also tops in its group.
Finishing up the data from Yahoo, we find that there are 60.07 million shares outstanding, with 311,030 shares out short as of May 10, 2006. This represents 1.7 trading days of volume and doesn't seem significant to me. As noted earlier, the company last split June 1, 2005, when they declared a 2:1 split.
6. What does the chart look like?Looking at a
Gildan "Point & Figure" chart from Stockcharts.com:
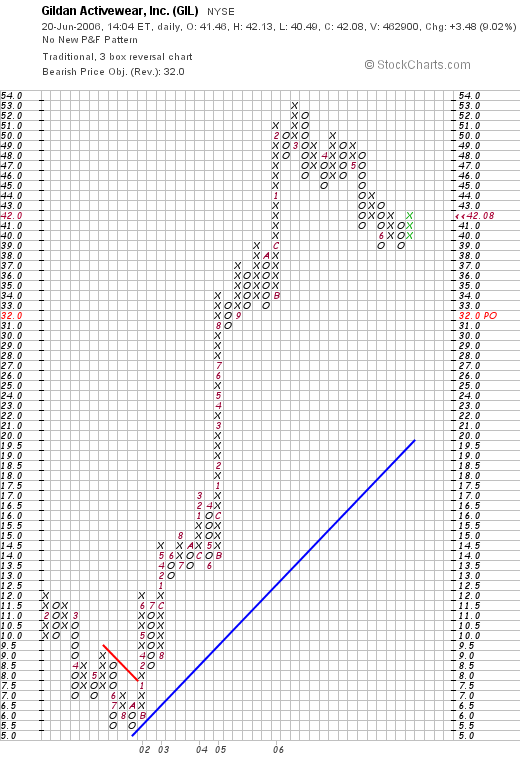
We can see the initial decline in stock price from $12.00 in February, 2001, to a low of $5.50 in September, 2001. Since then, the stock has climbed sharply to a level of $53 in March, 2006. The stock has retreated to the current levels around $39, and appears to be moving higher once again. The graph appears to be consolidating at this level, but the strong upward move does not appear to be reversed.
7. Summary: What do I think?
Let's review some of the data that I have been reviewing from this company. First of all, the company announced that earnings should be higher than expected today and that they are acquiring a hosiery manufacturing company to add to their line of merchandise. This acquisition was also estimated to be additive (or accretive) to the financial picture. The last quarter was quite strong (and the company also raised guidance at that time), and the past five years also have been good for GIL. Unfortunately, Morningstar.com doesn't report the free cash flow, but with the solid balance sheet, this doesn't appear to be a problem.
The company valuation-wise looks nice from the perspective of a P/E under the growth rate (with a PEG under 1.0). However, the Price/Sales is a bit rich within its industrial group, although the profitability puts the company at the top of similar companies--again suggesting reasonable valuation.
Finally the chart looks nice.
So in summary, I like this company. I don't know much about the Tee-shirt and sweatshirt business. However, this company appears well run and is doing quite well.
Thanks so much for visiting! If you have any comments or questions, you can leave your comments on the blog or email me at bobsadviceforstocks@lycos.com.
Please also be sure to visit my Stock Picks Bob's Advice Podcast Site.
Bob
Posted by bobsadviceforstocks at 1:37 PM CDT
|
Post Comment |
Permalink
Updated: Tuesday, 20 June 2006 2:55 PM CDT
Tuesday, 13 June 2006
"Revisiting a Stock Pick" Diodes (DIOD)
CLICK HERE FOR MY PODCAST ON DIODESHello Friends! Thanks so much for stopping by and visiting my blog,
Stock Picks Bob's Advice. As always, please remember that I am an amateur investor, so please remember to consult with your professional investment advisors prior to making any investment decisions based on information on this website.
The last month has been very hard on my portfolio and I am sure very hard on yours! I stick to my trading strategy and shall continue to sell stocks that hit my targets for selling and defer buying any new stocks until I have a signal to buy, which means either I am at my minimum number of positions (6) and have sold one of my remaining positions, or I have sold a portion of an existing position at a targeted gain. My positions are still rather extensive, numbering numbering 16 positions, so this isn't likely soon. And I don't have any stocks near sell-points on the upside. So I sit tight and wait for the selling to conclude; monitoring my stocks and selling anything that hits a selling price on the way down.
In the midst of this negative environment, we can still be looking for new names in the market. There are always some stocks moving higher when the rest are moving in the other direction. It is my challenge to monitor these stocks and find possible investments that could be considered if I did have the appropriate buy signal.

Looking through the
list of top % gainers on the NASDAQ today, I came across an old favorite of mine, Diodes (DIOD) which closed at $38.39, up $4.94 or 14.77% on the day. I actually
do own 240 shares of this stock in a managed IRA account that I do not control or direct. I first
posted Diodes (DIOD) on Stock Picks Bob's Advice on June 14, 2005, almost exactly one year ago, when the stock was trading at $33.30/share. The stock split 3:2 on December 1, 2005, giving my stock pick an effective price of $22.20. Given today's close at $38.39, this gives my pick from one year ago an appreciation of $16.19 or 72.9% since posting!
Let's take a closer look at this stock and I will share with you my observations on the characteristics that make this stock still attractive to me!
1. What does this company do?According to the
Yahoo "Profile" on Diodes, the company
"...engages in the design, manufacture, and marketing of discrete and analog semiconductor products worldwide focusing on various end user applications in the consumer electronics, computing, industrial, communications, and automotive sectors."
2. Is there any news to explain today's big move?Checking Yahoo
"Healines" on Diodes, I noted a couple of stories regarding company guidance. In a
story from the AP, the company is reported to have guided its second quarter revenue
higher with revenue growth of 10 - 12%
sequentially up from prior guidance of 3 - 6% revenue growth. As noted in the article, this works out to expected revenue of $81-$82.4 million up from the first quarter revenue of $73.6 million. This is also higher than analysts were expecting which was revenue of $77 million. In addition, the company expects second-quarter profit margin to increast "slightly" from 32.9% in the first quarter. Thus, not only is revenue to grow faster than expected, the margin on the revenue is also increasing which should also lead to even higher earnings. This was a win-win announcement that led to the stock moving higher in fact of a lousy trading environment!
3. How did the company do in the latest reported quarter?Diodes
reported 1st quarter 2006 results last month on May 4, 2006. As reported:
"- Revenues increased 51% year-over-year and 20% sequentially to
$73.6 million
- Operating income increased 19% to $10.8 million; pro forma up 36% to
$12.4 million
- Net income increased 29% to $9.3 million, or $0.34 per share"
These were nice results especially with the sequential growth reported. The latest news about increased guidance for the upcoming quarter combined with the last quarter's report is terrific!
4. How about longer-term results?Reviewing the
Morningstar.com "5-Yr Restated" financials we see a steady pattern of revenue growth from $93.2 million in 2001 to $214.8 million in 2005 and $239.8 million in the trailing twelve months (TTM).
Earnings which were just break-even in 2001, grew to $.29/share in 2002, and $1.29/share in 2005 with $1.32/share reported in the TTM.
During this time, the company has rather aggressively increased its float from 14 million shares to 23 million shares in 2005 and 26 million in the TTM. This almost doubling of shares outstanding was still outpaced by the rapid growth in earnings and revenue with revenue more than doubling, and earnings more than quadrupling since 2002.
And the free cash flow? Morningstar reports DIOD with $3 million in 2003, $3 million in 2004, $31 million in 2005 and $27 million in the TTM. Clearly this trend at least recently looks nice.
How about the balance sheet? This looks great to me. The company has $99.5 million in cash. I like it when a company can pay off all of its libilities: short and long-term combined with cash alone. And DIOD does this with only $68.6 million in current liabilities and $10.0 million in long-term liabilities reported. What about the "current ratio"? If we add together the $99.5 million in cash with the $108.3 million in other current assets, this gives us a total of $207.8 million in total current assets, which, if compared to the $68.6 million in current liabilites, yields a current ratio of 3.03. Generally current ratios, as I understand them, are considered "healthy" if 1.5 or higher.
5. What about some valuation numbers on this stock?Looking at
Yahoo "Key Statistics" on Diodes, we find that this company has a market capitalization of $980.06 million which makes it a mid-cap stock. The trailing p/e is moderate at 29.22. However, the anticipated growth is so strong that the forward p/e (fye 31-Dec-07 estimated) is only 18.91. This rapid anticipated growth gives us a PEG (5 yr expected) of only 0.98. Generally PEG ratios, imho, between 1.0 and 1.5 are fairly valued. Those under 1.0 are "cheap" and should be considered a good buy from a growth at a reasonable price (GARP) perspective.
Using the
Fidelity.com eresearch website for some relative valuation numbers, we find that DIOD is in the "Semiconductor-Integrated Circuit" industrial group. Within this group, DIOD is moderately priced with a Price/Sales ratio of 3.9. Topping the group is Marvell Technology (MRVL) with a ratio of 8.2, Broadcom (BRCM) at 5.9 and Semtech (SMTC) at 4.8. Priced cheaper than DIOD is RF Micro Devices (RFMD) with a Price/Sales ratio of only 1.6 and Skyworks Solutions (SWKS) at 1.1.
If we compare profitability by examining the Return on Equity (ROE) within this group we find that Diodes (DIOD) leads the pack with a ROE of 17.7%. Following DIOD is BRCM at 15.6%, MRVL at 11.7%, SMTC at 9.9%, RFMD at 2.9% and SWKS at 2%. Certainly by this measure, Diodes looks quite nice as well.
Returning to Yahoo, we can see that there are only 25.53 million shares outstanding with 19.21 million that float. As of May 10, 2006, there were 1.63 million shares out short, representing 6.5% of the float or 5 trading days of volume (the short ratio). I use a 3 day cut-off for significance in this ratio. This is just my own personal cut-off. If we do use this 3 day rule, the 5 days is a bit heavy on short-sellers who are betting against this company with the superb numbers. I suspect these short-sellers had a rude wake-up call today as the company and the stock climbed in the face of a really weak trading environment?
The company does not pay a dividend, and as I noted above, the stock last split 3:2 on 12/1/05.
6. What does the chart look like?If we take a look at the
Diodes "Point & Figure" chart from StockCharts.com:
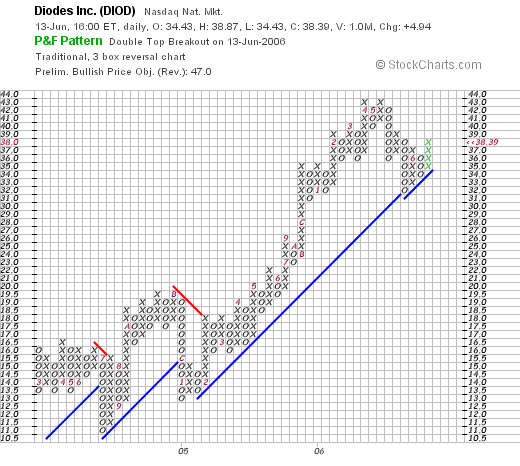
We can see that the stock after dipping from $16 in June, 2004, to a low of $11.00 in June, 2004, started climbing in a very strong fashion to a high of $43 in May, 2006. The stock subsequently came down to a low of $31 in late May, 2006, and has been powering higher since. The chart looks quite strong to me.
7. Summary: What do I think?
Needless to say, I like this stock a lot. Let me explain why and review some of the findings in the above review. First of all the company guided higher for the upcoming quarter. This was enough to drive the stock higher in a weak market. The latest quarter was strong with both solid revenue and earnings growth both year over year and sequentially. Looking at Morningstar.com, we find that the company has indeed been steadily growing its revenue AND earnings. They have been floating a few more shares than I like but even with this, earnings per share have grown steadily!
Free cash flow is positive and growing. The balance sheet is solid with enough cash to pay off all liabilities!
Valuation-wise the p/e is a bit rich but with the rapid growth expected the PEG is under 1.0. Looking at similar companies, we find that the Price/Sales ratio puts the company right in the middle of its industrial group. However, the company is the top in profitability as measured by ROE which is a plus. On top of this there are a lot of short-sellers which may be feeling the squeeze of a rapidly climbing stock. To top it off, the chart looks nice to me. In other words, the stock price is moving higher on the chart :).
Anyhow, that's my pick this evening. A stock that I do own some shares in a managed account. However, I picked this stock a year ago and the stock has subsequently performed magnificently. Hopefully, this can continue.
If you have any comments or questions, please feel free to email me at bobsadviceforstocks@lycos.com or just leave your comments on the blog. Please also be sure and stop by and visit my Stock Picks Bob's Advice Podcast Site.
Bob
Posted by bobsadviceforstocks at 9:32 PM CDT
|
Post Comment |
Permalink
Updated: Wednesday, 14 June 2006 1:01 AM CDT
Sunday, 11 June 2006
A Reader Writes "...I come to you for advice on a stock."
Hello Friends! Thanks so much for stopping by and visiting my blog,
Stock Picks Bob's Advice. As always, please remember that I am an amateur investor, so please remember to consult with your professional investment advisors prior to making any investment decisions based on information on this website.
I had the pleasure of getting a nice letter from "Jeff in Indiana" who wrote earlier today:
"Bob,
Again I come to you for advice on a stock. This is in your field of medicine and is called Amsurg Corp. (AMSG). After doing my research, it seems to meet or beat the main criteria that you utilize in your stock-picking process. It also is going up in a lousy market, which has to be a bullish sign. Please comment at your convenience.
Thanks,
Jeff in Indiana"
Jeff, thanks so much for writing! It was late Sunday, and instead of writing out the response, I posted the
response on Amsurg (AMSG) on my podcast!
I hope that is helpful!
Thanks again for writing. If you or anyone else have any other questions or comments, please feel free to leave them on the blog or email me at bobsadviceforstocks@lycos.com. Be sure to listen to this podcast and others on stocks I discuss on the blog as well as philosophy on investing on my
Stock Picks Bob's Advice Podcast Site.
Bob
"Looking Back One Year" A review of stock picks from the week of March 14, 2005
Hello Friends! Thanks so much for stopping by and visiting my blog,
Stock Picks Bob's Advice. As always, please remember that I am an amateur investor, so please remember to consult with your professional investment advisors prior to making any investment decisions based on information on this website.
I would like to apologize for the paucity of posts these past two weeks. I did a real number on my back and after missing some work, have been avoiding sitting at the computer. Things are doing a bit better, and I shall try to catch up with the blog!
One thing that I try to do on weekends (which I missed last weekend) is to review stock picks from a trailing one year period. I simply look through the posts from that particular week and list all of the stocks "picked" and the price that week and the latest price. This review assumes a buy and hold strategy. In practice, I advocate and use a disciplined sale strategy whereby I sell my losing stocks completely and quickly and my appreciating stocks slowly and partially. This strategy will of course affect the return. However, for the sake of review, it is simplest to just determine the return based on a purchase and hold strategy.

On March 16, 2005, I
posted Career Education (CECO) on Stock Picks Bob's Advice when it was trading at $36.35. Career Education closed at $32.94 on June 9, 2006, for a loss of $(3.41) or (9.4)% since posting.

On May 3, 2006, CECO
reported 1st quarter 2006 results. Revenue for the three months ended March 31, 2006, increased 4% to $528.6 million up from $510.4 million in the same period the prior year. Consolidated net income came in at $52.7 million or $.53/diluted share, down (5.7)% from the $55.9 million or $.53/diluted share during the same period in 2005.

On March 18, 2005, I
posted DRS Technologies (DRS) on Stock Picks Bob's Advice as a "revisit" when it was trading at $42.43. DRS closed at $50.44 on June 9, 2006, for a gain of $8.01 or 18.9% since posting.
On May 12, 2006, DRS
reported 4th quarter 2006 results. For the quarter ended March 31, 2006, revenue came in at $645.7 million, up 79% from the $361.2 million in the same period last year. As noted in the news report, the large jump in revenue and earnings is attributable to a successful acquisition of ESSI on January 31, 2006. Net earnings for the quarter climbed 76% to $28.8 million or $.79/diluted share, (on 30% additional shares outstanding) compared with the prior year's results of $16.3 million or $.58/diluted share. The company also went ahead and raised guidance for 2007 earnings.
So how did I do picking these two stocks? One pick lost ground, and the other did well. The average performance for these two picks was a gain of 4.75% since they were picked that week a bit more than a year ago.
Thanks so much for stopping by and visiting! If you have any comments or questions, please feel free to leave them on the blog or email me at bobsadviceforstocks@lycos.com. Also, please be sure to stop by and visit my
Stock Picks Bob's Advice Podcast Site.
Bob
Thursday, 8 June 2006
"Trading Transparency" Jos A Bank (JOSB)
Hello Friends! Thanks so much for stopping by and visiting my blog,
Stock Picks Bob's Advice. As always, please remember to consult with your professional investment advisors prior to making any investment decisions based on information on this website.
A little earlier this morning I unloaded my 187 shares of Jos A Bank (JOSB) at $27.00. I had purchased these shares on 4/4/05 at a cost basis of $25.59. So actually, I had a small gain on these shares of $1.41/share or 5.5% since purchase. JOSB is having a
HORRIBLE day in the market, trading at $25.64 or down $(11.49) or (30.95)% since the close yesterday. The stock virtually collapsed on a poor earnings report that came out this morning prior to the opening of trading with earnings at $.32/share down from $.38/share last year.
I don't need to know why the stock is down. It dropped to a sale point after passing through the 30% gain point. I have had two previous sales of this stock at 30 and 60% appreciation points, and the current price was below my sale point.
Since this is another sale on bad news. I shall once again be sitting on my hands with the proceeds as I continue to batten down the hatches in the face of this bear market. I do not know how much farther down it goes, but I shall let my stocks dictate my response and hopefully, we shall start seeing some good news that allows me to add a few positions.
If you have any comments or questions, please feel free to leave them on the blog or email me at bobsadviceforstocks@lycos.com. Please be sure to stop by and visit my
Stock Picks Bob's Advice Podcast Site where you can
listen to me discussing many of these same stocks and issues I am facing along with all of you!
Bob
Wednesday, 7 June 2006
"Trading Transparency" Packeteer (PKTR)
Hello Friends! Thanks so much for stopping by and visiting my blog,
Stock Picks Bob's Advice. As always, please remember that I am an amateur investor, so please remember to consult with your professional investment advisors prior to making any investment decisions based on information on this website.
Checking through my trading portfolio, I realized that my Packeteer stock (PKTR), which I had recently purchased, hit an 8% loss and I sold my shares in this position. I had purchased 400 shares of PKTR at a cost basis of $11.94/share. A few moments ago I sold these shares when the stock was trading at $10.86 for a loss of $(1.08)/share or (9.0)% since my purchase. Having sold this position at a loss, I shall not be looking to purchase another position, but shall instead be 'sitting on my hands' with the proceeds, waiting for a sale on 'good news' to add a new position to my trading portfolio.
Although slow and unwieldy, my trading system continues to direct me to move from equities into cash (or at least a reduced level of margin.) I will continue to avoid re-investing proceeds until I get to a minimum number of stocks in my trading portfolio, which would be at 1/4 of my maximum or 6 positions. I have a ways to go before that!
Thanks so much for visiting my blog. If you have any comments or questions, please feel free to leave them right on the blog or email me at bobsadviceforstocks@lycos.com. Please also be sure and visit my
Stock Picks Bob's Advice Podcast Site where you can download an mP3 where I talk about many of the same stocks and issues facing us as we look to invest in the market.
Bob
Newer | Latest | Older


