Stock Picks Bob's Advice
Thursday, 16 November 2006
Best Buy (BBY) "Revisiting a Stock Pick"
Hello Friends! Thanks so much for stopping by and visiting my blog, Stock Picks Bob's Advice! As always, please remember that I am an amateur investor, so please remember to consult with your professional investment advisors prior to making any decisions based on information on this blog.

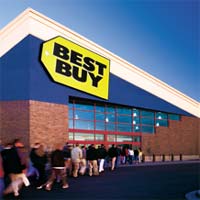
I was looking through the list of top % gainers on the NYSE and noticed that Best Buy (BBY), a stock that I have previously reviewed on the blog, was moving strongly higher. In fact, BBY closed at $55.01, up $1.90 or 3.58% on the day.
I first posted Best Buy on Stock Picks Bob's Advice on March 31, 2004, more than two years ago, when it was trading at $51.65. BBY split 3:2 on August 4, 2005, making my effective stock pick price actually only $55.01 x 2/3 = $36.67. Thus with today's close at $55.01, this represents an appreciation of $18.34 or 50% since posting.
Let's take another look at this stock and I shall show you why I believe it still deserves a spot on this blog!
1. What exactly does this company do?
According to the Yahoo "Profile" on Best Buy, the company
"...operates as a specialty retailer of consumer electronics, home-office products, entertainment software, appliances, and related services. It operates retail stores and commercial Web sites under the brand names Best Buy, Future Shop, Magnolia Audio Video, and Geek Squad."
2. Was there any news to explain today's move higher?
Best Buy, and some of the other retail chains, are generating some buzz with the game consoles coming out tomorrow. PS3, Sony's game platform, is expected to sell out its initial shipment in a matter of hours. At our local store, I saw kids camping out front last night, others were camping at Target, which apparently will also be receiving its shipment of consoles. In any case, this is the only news I could see which might be adding some interest to this stock.
 3. How about the latest quarter?
On September 12, 2006, Best Buy announced 2nd quarter fiscal 2007 results. Revenue for the quarter ended August 26, 2006, increased 13% to $7.6 billion from $6.7 billion in the prior year. Earnings per diluted share increased 27% to $.47/share from $.37/share. Net earnings climbed to $230 million from $188 million a year earlier. The company beat expectations of earnings of $.44/share on revenue of $7.54 billion. Same store sales during the quarter improved 3.7%. The company maintained guidance of $2.65 to $2.80/share for the full year of fiscal 2007.
4. How about longer-term results?
Examining the Morningstar.com "5-Yr Restated" financials on BBY, we can see a nice picture of steady growth in revenue from $17.7 billion in 2002 to $30.8 billion in 2006 and $32.6 billion in the trailing twelve months (TTM). Earnings, which dropped from $1.18/share in 2002 to $.20/share in 2003, have subsequently steadily improved to $2.27/share in 2006 and $2.50/share in the trailing twelve months (TTM).
Per Morningstar, the company initiated dividends in 2004 at $.27/share. They have grown their dividends to $.31/share in 2006 and $.32/share in the TTM. The presence of dividends is always a 'plus' to me; and a company that can steadily increase its dividend makes it that much more attractive to investors.
The company has maintained its number of shares outstanding, with 475 million shares in 2002, 489 million in 2006, dropping to 480 million in the TTM.
Free cash flow has been nicely positive with $842 million in 2004, $1.04 billion in 2006 and $1.2 billion in the TTM.
The balance sheet is solid with $2.668 billion in cash and $5.22 billion in other current assets yielding a total current assets of $7.89 billion. When compared to the current liabilities of $6.37 billion, this yields a current ratio of a healthy 1.24. There are enough current assets to cover both the $6.37 billion in current liabilities and the $.6 billion in long-term liabilities combined. The balance sheet appears just fine to me!
5. What about some valuation numbers?
Looking at Yahoo "Key Statistics" on BBY, we can see that this is a large cap stock with a market capitalization calculated at $26.42 billion. The trailing p/e is a reasonable 21.96, with a forward p/e (fye 25-Feb-08) of 17.03. With the steady growth expected for the next five years, the PEG works out to a nice 1.12.
Using the Fidelity.com eresearch website, we find that BBY is in the "Electronics Stores" industrial group. All of the firms sell at 'reasonable' Price/Sales ratios, however, GameStop carries the highest valuation relative to Price/Sales with a ratio of 1. Best Buy (BBY) follows at 0.8, Guitar Center (GTRC) is at 0.7, RadioShack (RSH) is at 0.5, and Circuit City is the cheapest in the group with a Price/Sales ratio of 0.3.
Insofar as profitability is concerned, examining the Return on Equity (ROE) of each of these stocks finds Best Buy most profitable by this measure with a ROE of 10.2%, followed by Guitar Center at 9.8%, Circuit City at 4.1%, GameStop at 3.3%, and Radioshack at 2.1%.
Finishing up some of the Best Buy numbers on Yahoo, we can see that there are 480.25 million shares outstanding with 401.44 million that float. Of these, as of 10/10/06, there were 18.18 million shares out short representing 4.5% of the float or 3.7 trading days of volume. While the 18+ million shares out short seems a lot, there are actually 5.1 million shares traded on an average day, so this short interest, or short ratio of 3.7, isn't as significant as it appears on first glance.
As I noted above, the company pays a 'forward' annual dividend at a rate of $.40/share yielding 0.8%. The last stock split was a 3:2 split on 8/4/05.
6. What does the chart look like?
If we examine the "Point & Figure" chart on Best Buy from StockCharts.com, we can see what appears to be a fairly strong improvement in stock price from February, 2003, when the stock was trading at $17/share to a high of $59/share in April, 2006. The stock has pulled back recently to the $44 level, although it is now appearing to have consolidated, and is moving higher at least right now from my perspective.

7. Summary: What do I think about this stock?
Let's review some of the things I have just written. First of all, the company is in the retail sweet spot of consumer electronics in the age of ever-improving game platforms from Sony, Nintendo, and Microsoft. They also sell all of the game software for these platforms as well. Latest quarter was strong with ok same store sales growth in the 3+% range. They beat expectations on earnings and revenue but maintained guidance.
The Morningstar.com report looked nice with steady revenue growth and fairly steady earnings improvement. The company, it should be noted, does pay a small dividend and has been increasing it each year. In addition, the number of shares, which is large, has been held fairly constant and more recently, BBY appears to be buying back shares. Valuation-wise, BBY looks pretty good with a p/e in the low 20's, a forward p/e in the teens, and a PEG just over 1.1. Price/sales is ok, and the ROE is tops in its group.
BBY has been a good retail pick for me having appreciated nicely since I posted it about 2 1/2 years ago. I don't think teens and grown-up kids like me will ever stop being fascinated by electronic devices, software, flat-screen TV's, and digital cameras and imaging devices. Now with Best Buy looking to expand into China, this may well be another frontier for this company to expand its retail presence. I still like Best Buy, and as my kids will tell you, I am an inveterate shopper there!
Thanks so much for stopping by and visiting here! If you have any comments or questions, please feel free to leave them on the blog or email me at bobsadviceforstocks@lycos.com. Also, be sure and visit my Stock Picks Podcast Site where you can listen to me discuss many of the same stocks and topics I write about here.
Bob
Wednesday, 15 November 2006
A Reader Writes "How much money do you put in each stock?"
Hello Friends! Thanks so much for stopping by and visiting my blog, Stock Picks Bob's Advice! As always, please remember that I am an amateur investor, so please remember to consult with your professional investment advisors prior to making any investment decisions based on information on this website.
 One of my favorite things about blogging about stocks is the chance to hear from people who have been reading what I write and have questions of their own. If you have any comments or questions and wouldn't mind me blogging them, please drop me a line at bobsadviceforstocks@lycos.com. I read all of my email and try to answer as many letters and comments as possible.
Yesterday I received a nice letter from Sunil V. who wrote:
"Hi Bob,
I really liked reading your blogs on tripod. Curious about how it began I started reading from May 2003! I am just beginning and having some saved money wanted to get started in investing. I really liked the strategy you use in buying and selling the stocks. I also plan to have a discipline and a good strategy as i build my portfolio.
I had a very basic question. How much money do you put in each stock? I mean if i have a plan of 25 stock over a period of time, what should be the starting amount for each stock. If you have any benchmark you use please let me know. My idea as of today is $1000 per stock and increase this as i gain more knowledge in investing.
I have a link to your blog, so it would be ok if you give a reply on the blog or give me a seperate mail.
Thanks in advance for your reply and keep writing.
Sunil."
Sunil, thank you for writing to me! I am grateful for your loyalty reading the blog since May, 2003! I hope that what I have written has been helpful to you in understanding the market, at least from my particular perspective. Please be sure to read about investing from as many different writers and bloggers as possible. I have links to many terrific blogs on the main page along the left column.
To get back to your question, how much money I put into each investment--currently I have been adding about $5,000 for each position. My last purchase, Precision Castparts was actually about an $8,000 purchase. I have not been totally consistent with my purchases, but would like to see about a $5,000 position in each holding.
You mentioned about 25 positions...something that is my goal as well. Currently I have only 11 positions, far from the maximum. As you know, I let the trading activity of my existing holdings in my portfolio determine whether I shall be adding a new position or not. I have advocated starting at 1/2 of the maximum number, but you don't have to do that all at once.
For instance, let's presume you are starting from "scratch". Perhaps you can afford to add $300 to your account each month. I would wait until you hit $2,500 to add my first position. I would then wait until I had another $2,500 saved up to add a second position. I would continue adding positions until I hit my "neutral" position. That is, if you are aiming for 25 holdings, I would continue this process until I got to 12. This could indeed take several years or more to accomplish. But there is no rush in all of this. Successful investing is about a patient, methodical approach to building and managing your portfolio.
I would manage those first holdings as I manage all of my stocks. If the stock dropped 8% I would sell the holding. But instead of sitting on my hands, since I hadn't got to "neutral", I would replace that stock as long as I had $2,500 in cash including my sale. I would also start selling 1/6th of my holdings as they hit appreciation targets as I have detailed elsewhere. But I would not automatically add a new position, unless I had the $2,500 available for my minimum buy.
As soon as you got to 12 positions, I would continue the monthly addition of $300 or whatever amount you could afford. Then I would implement the portfolio management strategy of buying new positions only when selling on good news and then sitting on my hands, so to speak, whenever I sold on bad news....which would be a sale either on fundamental negative news, or on a decrease in the stock price so that it hit a sale point.
Of course, I have my "minimum" portfolio size, which I would suggest to be 1/2 of the number of the "neutral" position. Thus, if 12 was "neutral", then 6 would be the minimum number of stocks in my portfolio. Whenever a stock was sold when I was at the minimum, I would replace that stock and not let the number drop below 6. I would suggest adding a new stock whenever any of the six holdings hit a sale at an appreciation target.
After reaching 25 (or whatever maximum you had planned), I would not add any new positions, and instead would direct new contributions and partial sales into a cash portion of the portfolio. Then if the portfolio dropped to 24, and then I got a "buy" signal, I would try to start increasing the size of the positions, by investing a larger amount.
Does this answer your question? I hope so. There aren't any right answers to your questions. The size of your positions will depend on the amount of money you have available. I would suggest going slower building your portfolio rather than use smaller positions and building your portfolio quicker!
Good-luck and thanks again for being a loyal reader! I look forward to your comments in the future!
Bob
Daktronics (DAKT) "Revisiting a Stock Pick"
Hello Friends! Thanks so much for stopping by and visiting my blog, Stock Picks Bob's Advice! As always, please remember that I am an amateur investor, so please remember to consult with your professional investment advisors prior to making any investment decisions based on information on this website.
 I was looking through the list of top % gainers, and on the list for the NASDAQ came across an old favorite of mine, Daktronics (DAKT) which was having a superb day in the market. As I write, Daktronics is trading at $33.31/share, up $6.64 or 24.90% on the day! I do not own any shares or options on this company.
I first wrote up Daktronics on Stock Picks Bob's Advice on November 19, 2003, almost exactly three years ago, when the stock was trading at $17.74. DAKT had a 2:1 stock split on June 23, 2006, making my effective pick price actually 1/2 of that or $8.87. With the stock now trading at $33.31, this represents a gain of $24.44 or 275.5% since the stock was selected on the blog!
Let's take a closer look at this stock and see if it still deserves a place here!
1. What exactly does this company do?
Reviewing the Yahoo "Profile" on Daktronics, we find that this company
"...through its subsidiaries, engages in the design, development, marketing, and support of visual display solutions for the sports, commercial, and transportation applications. Its products include sport products, such as indoor and outdoor scoreboards, timing systems, digit displays, sound systems, statistics software, and related products; video products consisting of displays comprising a number of pixels capable of creating various levels of video, graphics, and animation and controllers that manage the operation of the display; commercial products under galaxy product line, which include various indoor and outdoor applications for graphics and text-based displays; and transportation products containing a line of electronic displays and controllers marketed under the vanguard product line."
2. Was there any news to explain today's move higher?
Checking the news, it was clear that today's move was related to the announcement of 2nd quarter fiscal 20007 results. The company reported a gain in revenue of 63% for the quarter from $123.5 million in net sales compared to a sales figure of $75.8 million in the year-ago period. Net income came in at $8.9 million, up sharply from last year's $5.2 million, or on a per diluted share basis, this was an increase of over 60% to $.22/share from $.13/share last year. This exceeded analysts' expectations of $.15/share in earnings on revenue of $98.4 million. The company also raised expectations for the next quarter to $.12 to $.18/share on net sales of $103 to $115 million. Analysts had been expecting earnings of $.13/share on revenue of $92.6 million. As you may know, I call this earnings report a "trifecta-plus" meaning that the company did everything it could do with an earnings report: announced increased revenue, increased earnings, beat expectations, and raised guidance! What else could an investor who was looking for good results expect?
3. How about the latest quarter?
See above.
4. What about longer-term results?
Examining the Morningstar.com "5-Yr Restated" financials, we can see an almost perfect picture of a company. In other words, first of all, note the steadily increasing revenue as illustrated by the steady increase in the size of the purple bars on the graph. Earnings have been a tad erratic, steadily increasing from $.13/share in 2002 to $.45/share in 2004 only to slip back to $.39/share in 2005. Earnings resumed their rise with $.52/share in 2006 and $.53/share in the trailing twelve months (TTM).
Free cash flow has been positive and basically growing with $11 million reported in 2004, dropping to $9 million in 2005, only to increase to $13 million in 2006 and $16 million in the TTM.
The balance sheet is solid with $26.3 million in cash and $127.4 million in other current assets. This is plenty to cover both the $86.2 million in current liabilities and pay off the $7.2 million in long-term debt as well. The current ratio works out to a solid 1.78.
5. How about some valuation numbers on this stock?
Reviewing the Yahoo "Key Statistics" on DAKT, we find that this is a mid-cap stock with a market capitalization of $1.31 billion. The trailing p/e is certainly rich at 63.93 with a forward p/e (fye 29-Apr-08) of 38.95. However, the company is anticipated to grow so vigorously (5 yr expected0 that the PEG ratio turns out to be a reasonable 1.14.
Utilizing the Fidelity.com eresearch website, we find that Daktronics is in the "Industrial Electrical Equipment" group. Within this group, DAKT is the most expensive by the Price/Sales ratio measure with a ratio of 3.3. This is followed by Rockwell Automation (ROCK) at 2.1, Ametek (AME) at 1.9, Energizer (ENR) at 1.4, Regal-Beloit (RBC) at 1, and Eaton (ETN) at the bottom of the list with a ratio of 0.1. Certainly no bargain by this measure!
In terms of profitability, relative to the Return on Equity (ROE), DAKT also does not fare that well with Energizer at 74.5%, Rockwell at 36.9%, Eaton at 21.5%, Ametek at 19.6%, followed by Daktronics at 17.6% and Regal-Beloit at 15.5%.
Finishing up with Yahoo, there are 39.05 million shares of Daktronics outstanding with 30.96 million that float. Of those that float, 3.7 million shares were out short as of 10/10/06. This represents 10.5% of the float or a short ratio of 6.2. This last figure may well explain the sharp rise today on the back of terrific news. Not only are purchasers seeking to go "long" on this stock buying it up, but the short-sellers are likely scrambling to cover their shorted shares, scrambling to buy shares to close out their position.
Finally, the company does pay a small dividend with a forward annual rate of $.06/share yielding 0.2%. The last stock split, as I noted above, was a 2:1 stock split on June 23, 2006.
6. How about the chart?
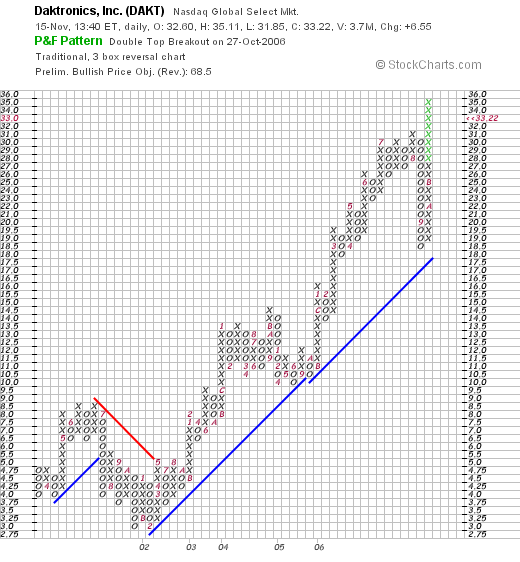
Checking the Daktronics "Point & Figure" chart from StockCharts.com, we can see that the company, which was trading aroune $4.75/share in march, 2001, climbed to $8.50 in June, 2001, only to fall back to a low of $3.00 where it "double-bottomed", and then in February, 2002, started a sharp and steady ascent to the current $33 level. The stock chart looks quite strong for at least the last four years!
7. Summary: what do I think about this stock?
Let's take a brief look at a few of the things I discussed above. First of all the stock is having a terrific day moving up very strongly on good news. I suspect that the relatively large short-interest is helping fuel the ascent as shorts get squeezed and other investors pile in. The quarterly report announced was phenomenal as the company showed terrific growth, blew away estimates and raised guidance! Finally the Morningstar.com figures are also strong. On a negative, the company appears richly priced and cannot afford any mis-steps. This is not an unknown company; unlike the valuation when I first wrote it up in 2003. But the numbers are impressive, the graph is great, and if I were in the market to be buying shares, I probably would consider adding a stock like this! (If only I had loaded up on shares in 2003!)
Thanks again for stopping by! If you have any comments or questions, please feel free to leave them on the blog or email me at bobsadviceforstocks@lycos.com. If you get a chance, be sure and visit my Stock Picks Podcast site, where I discuss many of the same stocks I write about on the blog.
Bob
Tuesday, 14 November 2006
Dick's Sporting Goods (DKS) "Revisiting a Stock Pick"
CLICK HERE FOR MY PODCAST ON DICK'S SPORTING GOODS
Hello Friends! Thanks so much for stopping by and visiting my blog, Stock Picks Bob's Advice! As always, please remember that I am an amateur investor, so please remember to consult with your professional investment advisors prior to making any investment decisions based on information on this website.
 I was reviewing the list of top % gainers on the NYSE this morning and came across an old favorite of mine, Dick's Sporting Goods (DKS), which is currently trading at $53.21, up $4.29 or 8.77% on the day. DKS was actually one of the first stocks I picked on this blog, having selected Dicks for Stock Picks Bob's Advice on May 22, 2003, almost 3 1/2 years ago! At that time, DKS was trading at $29.75. However, Dick's had a 2:1 split on April 6, 2004, making my effective pick price actually $14.88. With today's price of $53.21 (too bad I don't own any shares or options on this stock!), this represents a gain of $38.33 or 258%!
Let's take a brief look at this company and see why I think it still deserves a place on this blog.
1. Was there any news to explain today's big move higher?
Yesterday, after the close of trading, Dick's announced 3rd quarter 2006 financials. Revenue climbed strongly to $708.3 million from $582.7 million. This exceeded analysts' expectations for $679 million in revenue. Net income came in at $7.8 million, up from $4.18 million, or $.14/share, up from $.08/share last year. Analysts had expected per-share income of $.05/share. In addition the company raised per-share income for 2006 to $1.95 to $1.98, up from prior guidance of $1.84 to $1.88. Analysts had been looking for $1.88/share for the year. Thus, the company performed what I call a "trifecta-plus" with increasing revenue, earnings, exceeding expectations for both, and raising guidance for upcoming financial reports. A really great report imho!
2. Latest quarter?
See above :).
3. Longer-term results?
Reviewing the Morningstar.com "5-Yr Restated" Financials on Dick's: we can see some very nice information. First of all, revenue has steadily grown from $1.08 billion in 2002 to $2.63 billion in 2006 and $2.81 billion in the trailing twelve months. Earnings have increased steadily from $1.04 in 2004 to $1.76 in the TTM. And the total number of shares have actually declined recently after increasing from 45 million shares in 2004, they grew to 50 million in 2006, and apparently (?) dropped to 37 million in the TTM.
Free cash flow which dropped from $32 million in 2004 to $3 million in 2005 has been increasing recently to $58 million in 2006 and $72 million in the TTM.
The balance sheet looks solid with $32.9 million in cash and $712 million in other current assets, which when compared to the $519.4 million in current liabilities yields a current ratio of almost 1.5.
4. What about valuation?
Looking at Yahoo "Key Statistics" on Dick's: company is a mid-cap stock with a market capitalization of $2.71 billion. Trailing p/e is 30.43, forward p/e is 23.39 (fye 28-Jan-08) and PEG is reasonable at 1.07. Dick's is in the "Sporting Goods Stores" according to the Fidelity.com eresearch website. Within this group, Dick's is reasonably priced with a Price/Sales ratio of 1.0. Leading this group is another old favorite of mine, Hibbett (HIBB) at 2.0, then Dick's at 1, Cabela's (CAB) at .8, Golf Galaxy (GGXY) also at 0.8 (which Dick's just announced it was acquiring), and Big 5 (BGFV) at 0.6.
Dick's also does ok with the Return on Equity (ROE) figures which is led by Big 5 at 34.6%, Hibbett at 27%, then Dick's at 22.6%, Cabela's at 11.4% and Golf Galaxy at 10.7%.
Returning to Yahoo, we find that there are 50.87 million shares outstanding with 37.58 million that float. As of 10/10/06, there were 5.46 million shares out short representing 10.8% of the float or 9.6 trading days of volume. This is quite significant, and we may well be representing a short squeeze today as the short ratio at 9.6 is well over my own 3 day rule for significance. With the great news on earnings coming out last night I suspect there are a lot of short sellers who now are scrambling to close out their trades, shares that they had already sold without owning them betting on worse news than what we got last night!
As noted already, the stock split 2:1 on 4/6/04, and the company does not pay a dividend.
5. What about the chart?
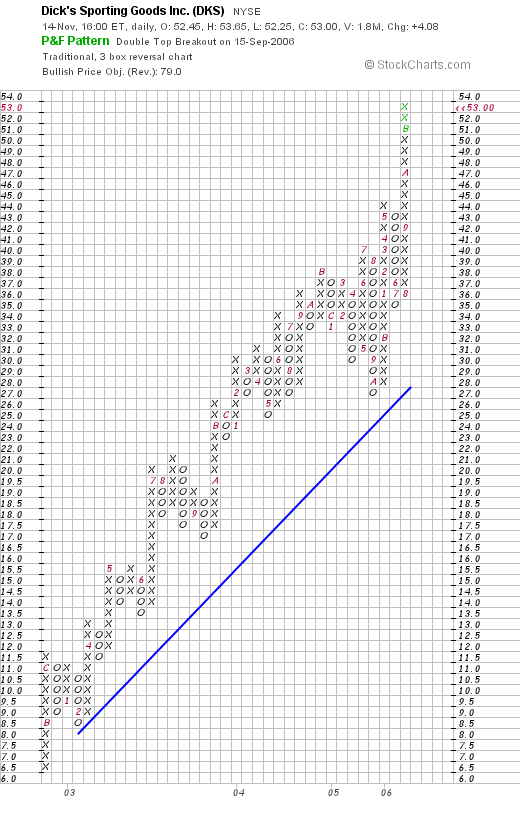
Looking at a "Point & Figure" chart on Dick's from StockCharts.com, we can see an incredibly powerful chart with the stock appearing a little over-extended but showing no evidence of any significant weakness. This is an amazing chart with the stock climbing steadily from $6.50 in late 2002 to the current level of $53.
6. Summary: What do I think?
In a word, GREAT. This is a stock that I wish I had purchased in 2003! It still looks great. Let's review a few of the things that make me interested in this stock. First of all, it is making a strong move higher today in the face of a rather anemic trading environment. It is doing this in spite of announcing an acquisition of Golf Galaxy, which is apparently being favorably received by the "street". They reported terrific earnings, beating expectations and raising guidance. They have a beautiful Morningstar report, with steadily increasing earnings and revenue, growing free cash flow, and a solid balance sheet. Valuation-wise the company isn't too richly valued and appears to have room for an expansion of multiples. Finally the chart looks nice and to top it off there are a lot of short-sellers out there who are being squeezed. Looks like a positive picture to me!
Thanks so much for visiting! If you have any comments or questions, please feel free to email me at bobsadviceforstocks@lycos.com or just leave your comments on the blog. Also, please be sure and visit my Stock Picks Podcast Site where I have discussed many of the same stocks that I write about here!
Bob
Posted by bobsadviceforstocks at 10:07 AM CST
|
Post Comment |
Permalink
Updated: Sunday, 19 November 2006 10:59 PM CST
Monday, 13 November 2006
Rohm & Haas (ROH)
Hello Friends! Thanks so much for stopping by and visiting my blog, Stock Picks Bob's Advice! As always, please remember that I am an amateur investor, so please remember to consult with your professional investment advisors prior to making any investment decisions based on information on this website.
I haven't made too many stock picks on this blog the last week or two. It isn't that there weren't any stocks to write about, just that I was busy with other things. I have several hats that I wear, and with the 2006 elections consuming my interest, I was spending time reading, writing, and discussing politics. But that is an entirely different subject. For those of you who stopped by and found nothing new to read about, I apologize. But I am glad that some of you have continued to drop by and find out about what I have been writing. If you are new to the blog, welcome! I hope that you will be able to wade through the many entries that I have created and that you will be able to gain another perspective, perhaps learn a new way to look at stocks. If so, then I shall be glad to know that I have been successful in sharing my own perspective with all of you!
 As regular readers probably realize, I like to look for stocks by examining the stocks that are showing strong price momentum on the day that I write them up. Today, while looking through the list of top % gainers on the NYSE, I came across Rohm & Haas (ROH) which as I write is trading at $51.85, up $1.89 or 3.78% on the day. I do not own any shares of ROH nor do I own any options on this stock. Let me go through the factors that led me to pick this stock for the blog.
1. What exactly does this stock do?
To get a handle on this question, I routinely refer to Yahoo Finance, and looking at the Yahoo "Profile" on Rohm & Haas, we can see that this company
"...provides specialty materials for the personal care, grocery, home, and construction markets in the United States. It operates in six segments: Coatings, Performance Chemicals, Monomers, Electronic Materials, Adhesives and Sealants, and Salt."
2. How did they do in the latest quarter?
If you are a regular reader here, you will know that I am looking for increasing revenue and earnings. If possible, I appreciate reading that the company is raising guidance. If a company can get all of that, and maybe even exceed expectations, I call this a "trifecta" or "trifecta-plus" if everything falls into line!
On October 19, 2006, ROH reported 3rd quarter 2006 results. For the quarter ended September 30, 2006, sales came in at $2.07 billion, up 7% from $1.93 billion in the same quarter a year earlier. Diluted earnings per share grew 18% to $.86/share, up from $.73/share last year. Since expectations are so important in determining the market's reaction to news, it was nice to see that Rohm & Haas topped estimates of $.83/share and met sales expectations. Guidance, however, was not raised above analysts' expectations of $3.41/share, as the company confirmed guidance for 2006 of $3.40 to $3.45/share.
3 . How about longer-term results?
Looking at the Morningstar.com "5-Yr Restated" financials on ROH, we find that Rohm & Haas has been steadily increasing its revenue from $5.67 billion in 2001 to $7.99 billion in 2005 and $8.16 billion in the trailing twelve months (TTM).
Earnings have also been steadily increasing from a loss of $(.32)/share in 2001 to $2.85/share in 2005 and $3.02/share in the TTM. A nice plus in this stock is that the company does pay a dividend and has been increasing its dividend each year. The company paid $.80/share in 2001, had increased it to $1.12/share in 2005 and has paid $1.20/share in the TTM. Also, as I like to observe, the number of shares outstanding has been stable, and actually dropped slightly in the past 12 months. The company is noted to have 222 million shares outstanding in 2003, stayed at 222 million in 2005, and dropped to 221 million in the trailing twelve months.
Free cash flow has been positive and appear to be increasing recently. The company had $609 million in free cash flow in 2003, $614 million in 2005 and $702 million in the TTM.
The balance sheet is adequate, although I have reviewed companies with better 'current ratios'. The company is noted to have $492 million in cash and $2,814 million in other current assets. This easily covers the $1.9 million in current liabilities, yielding a current ratio of 1.73. However, the company does have an additional $3,802 million in long-term liabilities. With the growing and significant free cash flow, this debt does not appear to be a problem for this company.
4. How about some valuation numbers?
Checking the Yahoo "Key Statistics" on Rohm & Haas, we find that this company is a large cap stock with a market capitalization of $11.3 billion. The trailing p/e is a very reasonable (imho) 16.62, with a forward p/e (fye 31-Dec-07) of 14.48 The PEG is reported at 1.46, with 1.0 to 1.5 considered a fair valuation.
Looking at the Fidelity.com eresearch website, we can see that ROH is in the "Chemicals-Major Diversified" industrial group. Within this group, the companies with the highest Price/Sales ratios start with Air Products (APD) at 1.8, Rohm & Haas (ROH) follows at 1.3, Sherwin-Williams (SHW) follows at 1.1, Dow Chemical (DOW) is next at 0.8, and Ashland (ASH) is at the bottom of the list, the cheapest in valuation, with a Price/Sales ratio of 0.5.
Looking at profitability, using Return on Equity (ROE) as a guide, we find that ROH is near the bottom of the list with Sherwin-Williams leading at 31.1%, Dow Chemical at 23.8%, Rohm & Haas at 17.8%, Air Products at 16% and Ashland at 8.6%. Thus, in this measure, ROH does a bit better in terms of performance.
Returning to Yahoo, we find that there are 218.43 million shares outstanding but only 77.54 million shares that float. There are 1.79 million shares out short as of 10/10/06, but since the average daily volume of shares traded is nearly a million shares each day, this large amount ends up representing only 1.2% of the float or only 2 trading days of volume. This is not very significant to me due to my idiosyncratic 3 day rule for significance in short interest.
As I have noted elsewhere, the company does pay a significant dividend currently with $1.32 anticipated in the next 12 months yielding 2.60%. The last stock split was a 3:1 split back in September, 1998.
5. What does the chart look like?
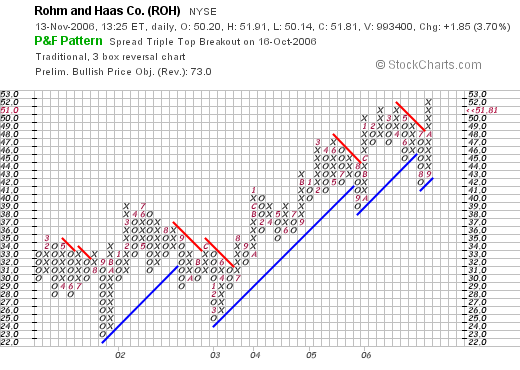
Generally, I utilize "Point & Figure" charts for this analysis. Looking at the "Point & Figure" chart on Rohm & Haas from StockCharts.com, we can see what appears a very steady saw-tooth increase in the stock price from $23/share in September, 2001, to a recent peak of $52 in October, 2006. The stock appears to be fairly strong with higher highs and higher lows for the last several years.
6. Summary: What do I think about this stock?
First of all, let's review briefly some of the findings that I noted above. The company is making a nice move higher today along with much of the market. They had a very nice quarter with increased revenue and increased earnings and beat earnings expectations. Guidance was in line with analysts.
They have had a steady improvement in both revenue and earnings the past five years. In addition, they pay a nice dividend and have been increasing it regularly each year. They have kept their shares outstanding stable and recently have even reduced their shares slightly. Free cash flow is solid and improving and the balance sheet appears solid.
Valuation-wise, the p/e, and PEG are reasonable. Price/sales and ROE are a bit less than I would like. And finally, the chart looks solid. This is what I would describe as a solid large cap growth stock. Fairly conservative, yet it fits the criteria that I use to evaluate companies. If I were in the market to be buying a stock, this is the kind of company I would like in my portfolio.
Thank you so much for visiting and reading my entries! I hope this is helpful for you, I know that for me, evaluating and reading about stocks continues to increase my own understanding of the many ways of evaluating and understanding investments in the stock market. If you have any comments or questions, please feel free to email me at bobsadviceforstocks@lycos.com and be sure to visit my Stock Picks Podcast Site where I discuss many of the same stocks and subjects I write about on the blog.
Bob
"Weekend Trading Portfolio Analysis" Ventana Medical Systems (VMSI)

Hello Friends! Thanks so much for stopping by and visiting my blog, Stock Picks Bob's Advice! Please remember that I am an amateur investor, so please remember to consult with your professional investment advisors prior to making any investment decisions based on information on this website.
I try to accomplish many different things on this website. I hope that I accomplish at least a few of these goals. For one thing I have been trying to identify stocks that may represent potential investments for me. I write up these stocks and discuss the reasons why I find them attractive. On a regular basis I review these stocks, usually on weekends, and try to find out how they turned out. For full disclosure purposes, as often as possible, I have tried to let you know whether I own any shares of the stocks and what my actual trading portfolio looks like. Over the past couple of years I have also been trying to go through my list of actual stocks in my trading portfolio on a regular basis. Going alphabetically, last month I reviewed Meridian Bioscience (VIVO). Going through my list, I am now up to Ventana Medical Systems (VMSI) another stock in my actual list of holdings.
 Ventana Medical Systems (VMSI) is an old favorite of mine here on the blog. I first posted Ventana on Stock Picks Bob's Advice on December 23, 2003, when the stock was trading at $39.80. Ventana had a 2:1 stock split March 15, 2005 making my effective pick price actually $19.90. VMSI closed at $43.63 on November 10, 2006, giving my pick an effective appreciation of $23.73 or 119.2% since posting.
I revisited Ventana on January 13, 2005, when the stock was trading at $64.36. Adjusted for the split that occurred two months later, this was a pick price of $32.18. With the stock at $43.63, this represents a gain of $11.45 or 35.6% since I revisited this stock a second time on the blog!
But the point of this entry is to review my actual holding! I currently own 188 shares of Ventana (VMSI) that were purchased April 16, 2004, after my first entry on VMSI, but before my second post. I have a basis of $23.47/share on this position, with an unrealized gain of 85.90%.
As is my custom, I have sold portions of this stock as it has appreciated, selling at a 30, 60, and 90% appreciation target. Thus, on the upside, my next targeted sale of 1/6th of my holding, or about 31 shares, will be at 2.20 x $23.47 = $51.63. On the other hand, if the stock declines to 50% of my highest sale point (a 90% gain) or at a 45% appreciation level, I shall be selling ALL of my remaining shares. This works out to 1.45 x $23.47 = $34.03.
Let's take another look at this company and see if it still deserves a spot on this blog and a place in my trading portfolio.
First of all what do they do?
According to the Yahoo "Profile" on Ventana, the company
"... engages in the development, manufacture, and marketing of instrument-reagent systems that automate slide staining in anatomical pathology and drug discovery laboratories worldwide. Its clinical systems are used in anatomical pathology labs in analyzing human tissue to assist in the diagnosis and treatment of cancer and infectious diseases."
And the latest quarter?
On October 20, 2006, Ventana reported 3rd quarter 2006 results. For the quarter ending September 30, 2006, sales climbed 16% to $59 million, net income came in at $7.8 million, up over 100% from the $3.6 million in the same quarter last year. On a per share basis this worked out to $.22/share, up from $.10/diluted share last year. These were strong results. The company maintained guidance for 2006 and 2007.
How about longer-term results?
Reviewing the Morningstar.com "5-Yr Restated" financials on VMSI, we can see the beautiful progression of revenue from $87.8 million in 2001 to $199.1 million in 2005 and $218.1 million in the trailing twelve months (TTM).
Earnings have steadily increased as well with $.05/share in 2001, increasing to $.69/share in 2005 and $.72/share in the TTM.
Shares outstanding have increased slightly from 32 million in 2001 to 34 million in 2005 and 37 million in the TTM. Free cash flow has b edn positive and steady at $17 million in 2003, $21 million in 2004, $24 million in 2005 and $16 million in the TTM.
The balance sheet appears solid with $52.7 million in cash and $69.2 million in other current assets which can easily cover both the $45.4 million in current liabilities and the $2.6 million in long-term liabilities combined.
How about valuation?
Reviewing Yahoo "Key Statistics" on VMSI, we find that this is a mid-cap stock with a market capitalization of $1.62 billion. The trailing p/e is a very rich 51.57, the forward p/e is a bit better at 36.36, and the PEG ratio is also rich at 1.81.
According to the Fidelity.com eresearch website, Ventana is in the "Medical Instruments/Supplies" industrial group. Within this group, Ventana tops its group with a Price/Sales ratio of 7, followed by Cytyc (CYTC) at 5.5, Stryker (SYK) at 4, Boston Scientific (BSX) at 3.3, Becton Dickinson (BDX) at 3.2 and Baxter (BAX) at 3.
In terms of Return on Equity (ROE), Baxter leads at 22.6%, Becton Dickinson at 20.4%, Stryker at 20.3%, Cytyc at 20.1% and Ventana at 18.7%. Further back is Boston Scientific at a negative (36.2)%.
Finishing up with Yahoo, there are 37.03 million shares outstanding with 32.55 million that float. Of these shares 2.69 million are out short representing 8.3% of the float or 5.9 trading days of volume (the short ratio). Using my 3 day rule of short interest, this appears significant and in light of recent good news (being included in a S&P index) we may well be observing a bit of a squeeze on the shorts.
No dividends are paid and the last stock split, as I have noted above, was a 2:1 split March 15, 2005.
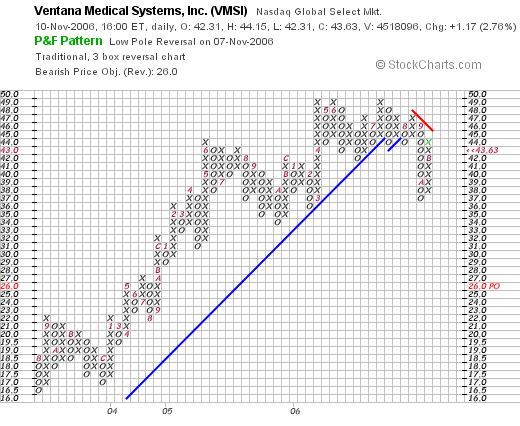
What about a chart?
Looking at the "Point & Figure" chart on Ventana from StockCharts.com, we can see a very steady increase from late 2004 until August, 2006, with the stock rising from $16.50 to $48. The stock chart, however, broke down in September, 2006, dropping to a low of $37. However, the stock price is recovering and if it can get through the $46 level, should once again be above resistance. But the chart certainly gives one a lot of pause. I suppose that may be contributing to the short interest as well.
So what do I think about this stock?
Well certainly, the stock has been kind to me and until recently has shown rather incredible stock price strength. Most recently, the stock price has been benefiting from its recent addition to the Standard & Poors MidCap 400, replacing Texas Regional Bancshares which is being acquired. More recently, the stock price was under pressure after Ventana became involved in an acquisition contest for Australian Vision Systems company. Danaher eventually became the successful acquirer squeezing out another favorite of mine, Cytyc (CYTC). With this acquisition out of the way, the stock has recovered and has been appreciating in price recently.
Overall, I like this company and have done well owning shares. However, the Price/Sales, the Price/Earnings, and the PEG are all rather rich in price. This is certainly no screaming bargain. However, the consistency of earnings and revenue growth is impressive, and unless the stock price declines hitting a sale point, I shall be sitting tight.
Thanks again for visiting! If you have any comments or questions, please feel free to email me at bobsadviceforstocks@lycos.com. Also, please be sure to stop by and visit my. Have a great week trading!
Bob
Sunday, 12 November 2006
"Looking Back One Year" A review of stock picks from the week of July 4, 2005

Hello Friends! Thanks so much for stopping by and visiting my blog, Stock Picks Bob's Advice! As always, please remember that I am an amateur investor, so please remember to consult with your professional investment advisers prior to making any investment decisions based on information on this website.
As is my practice, I like to review past stock selections on weekends. I use one week at a time to examine selections and let you know what would have happened if you had invested equal $ amounts in the stocks discussed that week. First of all, to answer a recent question I received, I am reviewing stocks from July, 2005, here in November, 2006, because there have been weekends that I have skipped a review. In fact last weekend was one of those!
In addition, for the sake of analysis, I assume a buy and hold approach to these reviews. In practice, I believe in a very different strategy of selling losing stocks quickly and completely and selling gaining stocks slowly and partially at targeted appreciation points.
 On July 5, 2005, I posted Bausch & Lomb (BOL) on Stock Picks Bob's Advice when it was trading at $87.50. BOL closed at $49.50 on November 10, 2006. This represents a loss of $(38.00) or (43.4)% since posting! This has definitely been one of my poorer stock picks on this blog, emphasizing two things: one, I am truly an amateur and fully capable of making poor picks (!), and two, the importance of limiting losses to small amounts.
 On November 9, 2005, Bausch & Lomb announced 'preliminary' third-quarter 2006 results. The company also according to the report, filed a "Form 12b-25" which means it will be unable to file the 10-Q for the quarter ended September 30, 2006, due to an anticipated restatement and expanded procedures for the financial report.
They reported that the anticipated reporting third quarter net income of $16.1 million for the quarter, down sharply from the $51.5 million reported in the same quarter in 2005. Sales are expected to increase to $577.2 million, compared with sales of $567.3 million in the third quarter of 2005. Much of Bausch & Lomb's problems relate to problems with Renu contact lens solutions with MoistureLoc and possible related fungal infections. This cloud over this stock includes the risk of lawsuits.
Unfortunately fort this blog, the Bausch & Lomb post was the only post for the week of July 5, 2005. Thus, the average performance was a loss of (43.4)% for my selections!
Please drop me a line if you have any comments or questions at bobsadviceforstocks@lycos.com. If you get a chance, drop my Stock Picks Podcast site where I discuss many of the same stocks and topics that I write about on the blog.
Bob
Wednesday, 8 November 2006
Bitstream (BITS)
Hello Friends! Thanks so much for stopping by and visiting my blog, Stock Picks Bob's Advice! As always, please remember that I am an amateur investor, so please remember to consult with your professional investment advisors prior to making any investment decisions based on information on this website.
 I wanted to try to write a brief entry this evening. I have been away from blogging and shall be away for a bit again! However, if I can, I would like to get this stock posted as it deserves a place here on the blog.
Bitstream (BITS) had a great day today, closing at $9.61, up $1.52 or 18.79% on the day. This was enough for the stock to make the list of top % gainers on the NASDAQ. I do not own any shares nor do I have any options on this stock.
According to the Yahoo "Profile" on BITS, this stock
"...together with its subsidiaries, engages in the development and sale of software products in the areas of fonts and font technology, browsing technology, and publishing technology in the United States and internationally."
What drove the stock higher today, was the announcement of 3rd quarter 2006 results, yesterday, after the close of trading. Revenue for the quarter ended September 30, 2006, increased 35% to $5.15 million, from $3.83 million in the same quarter in 2005. Net income for the three months over 200% to $953,000 or $.09/diluted share, up from $312,000 or $.03/diluted share in the previous year same period.
Reviewing the Morningstar.com "5-Yr Restated" financials on BITS, we can see the steady increase in revenue from $8 million in 2001 to $15.7 million in 2005 and $18 million in the trailing twelve months (TTM). Earnings were negative at $(.43)/share in 2001, turned positive at $.11 in 2005 and grew to $.28/share in the TTM.
The number of shares has been fairly stable with 8 million in 2001 and 9 million in the TTM. Free cash flow has been improving with $(2) million in 2003, $0 million in 2004, $1 million in 2005 and $3 million in the TTM.
The balance sheet looks solid with $7.9 million in current assets, enough to pay off the $3.3 million in current liabilities and the $.2 million in long-term liabilities combined. In addition, the company has $2.6 million in other current assets, which yields a current ratio of a bit over 3.
Looking at Yahoo "Key Statistics" on BITS shows us how tiny this company is with a market cap of only $87.70 million. The trailing p/e is shown at 36.54, no PEG is reported, and the Price/Sales is 4.10. There are 9.13 million shares outstanding with 7.4 million that float. As of 10/10/06, there were only 153,300 shares out short representing 2% of the float or 0.6 trading days of volume. No dividends are paid and no stock splits are reported on Yahoo.
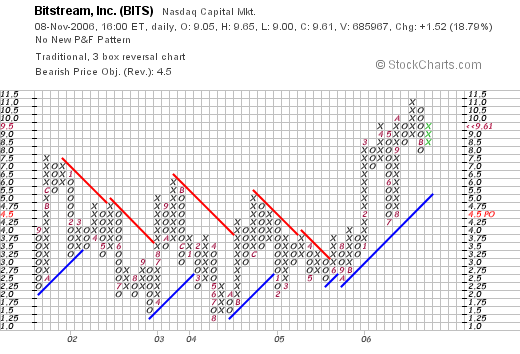
Looking at a StockCharts.com "Point & Figure" chart on BITS, we can see that this stock has really gone nowhere between late 2001 until late 2005, when it appeared to start a new move higher in January, 2006, when it moved from $2.50 to $8.00 in March, 2006. The chart appears encouraging to me without appearing ahead of itself.
To summarize, Bitstream moved sharply higher today on great news. This is a tiny company, a true 'micro-cap' which shows excellent fundamentals and a great earnings report and an attractive technical picture. Thanks for visiting! If you have any comments or questions, please feel free to drop me a line at bobsadviceforstocks@lycos.com and be sure to visit my Stock Picks Podcast Site (which I also need to update!) where you can listen to me discuss many of the same stocks and ideas on the blog.
Bob
Sunday, 29 October 2006
"Looking Back One Year" A review of stock picks from the week of June 27, 2005
Hello Friends! Thanks so much for stopping by and visiting my blog, Stock Picks Bob's Advice! As always, please remember that I am an amateur investor, so please remember to consult with your professional investment advisors prior to making any investment decisions based on information on this website.
One of my weekend tasks on this blog is to look back a year and review past stock picks and see how they turned out. This analysis assumes an equal dollar purchase of all of the stocks discussed that particular week and a 'buy and hold' approach to investing. In practice, I employ an active management approach, selling losing stocks quickly and completely and slowly selling appreciating stocks partially at targeted gains.
 On June 27, 2005, I posted Quanex (NX) on Stock Picks Bob's Advice when it was trading at $50.75. Quanex split 3:2 on April 3, 2006, making my effective stock pick price actually $33.83. NX closed at $34.12 on October 27, 2006, for a net gain of $.29 or .86% since posting.
 On August 24, 2006, Quanex reported third quarter 2006 results. Net sales in the quarter ended July 31, 2006, came in at $553 million, up 12% from the $492.6 million reported in the year-ago same period. Diluted earnings came in at $1.14, up 1% from $1.13/share the prior year. The company met expectations for earnings, which were expected at $1.13/share and beat expectations for revenue which per Thomson First Call were anticipated to come in at $543.9 million.
 On June 29, 2005, I "revisited" Millipore (MIL) which was trading at $50.87 at that time. MIL closed at $63.77 on October 27, 2006, for a gain of $12.90 or 25.4% since posting.
On July 26, 2006, Millipore (MIL) reported 2nd quarter 2006 results for the quarter ended July 1, 2006. Revenues for the quarter increased 12% to $273.8 million from $245 million in the year-earlier same period. Net income worked out to $29.1 million or $.54/share, up from $24.0 million or $.47/share in the second quarter of 2005.
So how did I do on these two stocks picked on the week of June 27, 2005? One stock was flat and the other performed strongly for an average gain of 13.13% since posting!
Thanks so much for visiting! If you have any comments or questions, please feel free to leave them on the blog or email me at bobsadviceforstocks@lycos.com. Also, if you get a chance, please drop by and visit my Stock Picks Podcast Site where I you can get a chance to listen to me discuss many of the same stocks and strategies discussed on this blog.
Have a great week Investing!
Bob
A Reader Writes "Hittite Microwave...I just can't figure out why!"
Hello Friends! Thanks so much for stopping by and visiting my blog, Stock Picks Bob's Advice! As always please remember that I am an amateur investor, so please remember to consult with your professional investment advisors prior to making any investment decisions based on information on this website.
I haven't been very busy writing about individual stocks this week. Some weeks I seem to be able to find time to write easier than others. But I did want to get to this letter that I received Friday from Diego who writes:
"Hi Bob,
I was browsing stocks a couple of days ago and I stumbled accross
Hittite Microwave (HITT). The company has a strong financial base,
earnings have been increasing, it hit 52-week high just a few days ago.
Then yesterday the company released Q3 report with 132.2% EPS increase
and 63.5% increase in sales compared to 2005, beating analysts'
expectations. Yet in the last 2 days, the stock plummeted around 20% and
I just can't figure out why! I'm a newbie investor and I was hoping you
could shed some light on the issue. Thankfully I didn't actually buy the
stock, but it still boggles my mind that it went down like that.
Thanks and good luck :-) Diego"
First of all, thank you so much for writing Diego! Your question is good and I do not know if I have any answers to it. Personally, I do not have any shares of Hittite (HITT). But let me take a look at Hittite (HITT) and the earnings report, and see if I can unearth any news that might help explain this appearingly-paradoxical behavior of the stock after the announcement of what seems like outstanding earnings.
First of all, as you correctly noted, Hittite (HITT) announced 3rd quarter earnings on Thursday, October 26, 2006 at 4 pm. (The time is important because it was after the close of trading on Wednesday, giving investors Friday, as the earliest time to respond to this in regular trading hours.)
Certainly results appear to be nothing less than outstanding on first glance. Revenue came in at $34.6 million for the quarter ended September 30, 2006, representing a 63.5% increase over the $21.2 million for the third quarter of 2005. This also was a 7% increase over the prior quarter's $32.4 million in revenue. It is nice to see sequential as well as 'year-over-year' strong results. Net income worked out to $11.6 million or $.37/diluted share, up 132.2% from the $5.0 million or $.17/diluted share the prior year. This was also a sequential 13.6% increase over the $10.2 million or $.33/share for the immediately preceding quarter. Again, showing strong results both year-over-year and sequentially!
Ironically, the strength of this report is increased, in my perspective, by the way the company beat expectations. As noted by Marketwatch.com, Thomson First Call analysts had been expecting earnings of $.34/share, (the company came in at $.37), and analysts were expecting revenue of $31.8 million (the company came in at $34.6 million). So even with the fact that beating current expectations usually finds a company's stock rising, this stock declined!
Perhaps what led to the market response was the section in the earnings report called "Business Outlook". As was reported in the same earnings report:
"The company currently expects revenue for the fourth quarter ending December 31, 2006 to be in the range of $34.0 million to $35.0 million and net income to be in the range of $10.4 million to $10.8 million, or $0.33 to $0.34 per diluted share, including equity-based compensation expense."
Thus, you will see that in spite of the outstanding quarterly report from Hittite, they were indicating that they expected the next quarter to show revenue of $34.0 to $35.0 million, essentially flat with the current quarter which came in at $34.6 million, and net income of $10.4 million to $10.8 million, which is below the current quarter's $11.6 million! On a per share basis, this worked out to $33 to $.34/diluted share, again below the current quarter of $.37/share. I suspect that after many quarters of increasing revenue and earnings, that the prospect of a slow-down, no matter how mild, must have spooked some investors to sell their shares in the face of what appeared to be incredibly strong results. Remember that stock price performance is about expectations as much as reality!
Other news that might be impacting this stock was a downgrade by Needham & Co. the week earlier from "Buy" to "Hold". In many circles, a "Hold" rating is synonymous with a 'sell' call, as many brokerage houses hesitate to actually indicate a 'sell' recommendation. Needham reported:
"We believe the market has already priced in large upsides for the second half of the year, at the same time end customers tend to slow orders exiting the year," Glavin wrote in a note to clients.
I suspect that the confirmation of a slow-down by the company itself was more or less the proverbial 'second shoe to fall' confirming what the analyst had been predicting.
I found an interesting article from the NASD website about these "hold" ratings. They point out:
Clear "Sell" ratings have grown rare. Some firms no longer even use "Sell" or any word obviously like it. Frequently, a "Hold" rating in effect means "Sell."
Thus, this was another negative warning about the stock.
A report on the Street.com confirms my assessment, as they noted:
"Looking ahead, Hittite Microwave said it expects fourth-quarter income in the range of $10.4 million to $10.8 million, or 33 cents to 34 cents a share, including equity-based compensation expense. Revenue is expected to range from $34 million to $35 million. Wall Street is looking for earnings of 34 cents a share on revenue of $35.8 million. Shares were falling $4.37, or 10.2%, to $38.30."
I cannot over-emphasize the effect of 'expectations' on stock price performance. Sometimes I write about all of these calculators readjusting future results based on a single announcement. These are imaginary calculations going on but I suspect they are very real! Morningstar.com has a nice comment about the role of expectations and how stock price performance can rapidly be affected by news that changes what people expect:
"Earnings estimates made by Wall Street analysts are important to the prices of your stocks. Each quarter, companies try to exceed the estimates that analysts have made. If companies exceed expectations, they're usually rewarded with a pop up in their stock price. If companies fall short of expectations--or sometimes if they only meet expectations--their stock prices can take a beating."
I hope that answers your question! You will note that my 'selection system' in looking at stocks starts out with a stock moving strongly higher. My next stop in looking at a stock is the latest quarterly report and then a longer-term view at the Morningstar figures. Thus, I don't start with the earnings numbers, but after identifying a stock with positive price momentum, I examine the earnings. Not the other way around.
The other point is to diversify one's portfolio with more than one or two stocks. To recognize that even with the best of analysis and homework, one is bound to make mistakes and that I urge, and employ, a disciplined system that requires sales of stocks when my own calculations and investigations are proved to be wrong.
Thanks again for writing! If you or anyone else have comments or questions, please feel free to drop me a line at bobsadviceforstocks@lycos.com or just leave your comments on the blog itself. If you get a chance, drop by and visit my Stock Picks Podcast Website where you can listen to me discuss many of the same stocks and issues I write about here on the blog.
Bob
Newer | Latest | Older


