Stock Picks Bob's Advice
Sunday, 26 November 2006
Good-bye Dave Johnson!
 Blogging can be a lonely business. Bloggers sit before their keyboards and write and formulate ideas and communicate into cyberspace. We get consolation looking at our Sitemeters knowing that someone has stopped by and hope that they have enjoyed their visits. We enjoy linking to each others blog, creating a network that allows visitors to travel across the internet, blog-hopping almost as easily as the bar-hopper on Saturday night. And we find it sad when one of our own hangs it up for personal, family, or business reasons. This is the case with Dayve Johnson on the Markets. Last week Dave Johnson, the actual spelling of his name, called it quits. As Dave wrote:
"Over the past few months I have been mulling over the thought of discontinuing posts to this blog. It has been something that once I started blogging it was a difficult decision to stop because deep inside I had a true joy in posting my ramblings, thoughts, and trades. But it has also become a burden, somewhat of a drudgery in the necessity to say something. Each and every night I would go through the process and each successive night it was becoming less of a joy.
So today I am done. The thing I really enjoyed most about the blog was the interaction between readers- their questions and comments generally made me have to think of the blog from the perspective of the reader. This was not always easy because I know at times I was not always clear and concise in my postings. This mostly stems from my poor ability to relate my thoughts into the blog posts.
One of the conflicts that I had to resolve ultimately was the fact I love to travel. Being away forced me to have to post a pick each day regardless of where I was. I hated that. Certainly that's one of the downfalls of trying to post a daily trackable trading log that would have some credence in the end. It's hard enough just finding a dog sitter for the darn dog when were away."
Well thank you Dave for your efforts! There is a fabric of inter-connectedness on the internet, and when one blogger calls it quits, one can feel the ripple in far distant places. I am sure that you have also touched your readers and that many will miss your posts. I certainly appreciated your link to my blog and feel your angst over hanging it up!
But the nice thing about blogging, is that you can quit, and you can restart again! And I hope that you find the time to do the things with your family, take care of your travels, and consider jumping back in to the blogosphere once again in the future!
Meanwhile, stop by once in a while and let us all know how you are doing!
Bob
Saturday, 25 November 2006
Wolverine Worldwide (WWW) "Weekend Trading Portfolio Analysis"

Hello Friends! Thanks so much for stopping by and visiting my blog, Stock Picks Bob's Advice! As always, please remember that I am an amateur investor, so please remember to consult with your professional investment advisors prior to making any investment decisions based on information on this website.
One of the things I have been trying hard to do on this blog, is to keep you informed of my actual holdings and the transactions that I make with the stocks that I really own. I do this in addition to the running commentary on what I call my "vocabulary" of investing....the discussion of the many stocks that I consider "investable". My updating you as frequently as possible, I try very hard to maintain as close to absolute 'transparency' as I can. This allows you to see what I am doing with my own stocks as well as allows you to hear about other stocks that I find attractive but have not owned...but might own in the future!
A couple of years ago, I started reviewing my "trading portfolio" stocks on a regular basis here on the blog. I stopped updating the link to my trading portfolio some time back as all of the housework started catching up with me and I found it absolutely unrealistic to do all of this manually by myself. But I continue to run through my holdings, trying to review a stock I actually own, about twice/month. Two weeks ago I reviewed my Ventana holding on Stock Picks. This evening, I would like to take another look at Wolverine Worldwide (WWW), a relatively recent acquisition for me.
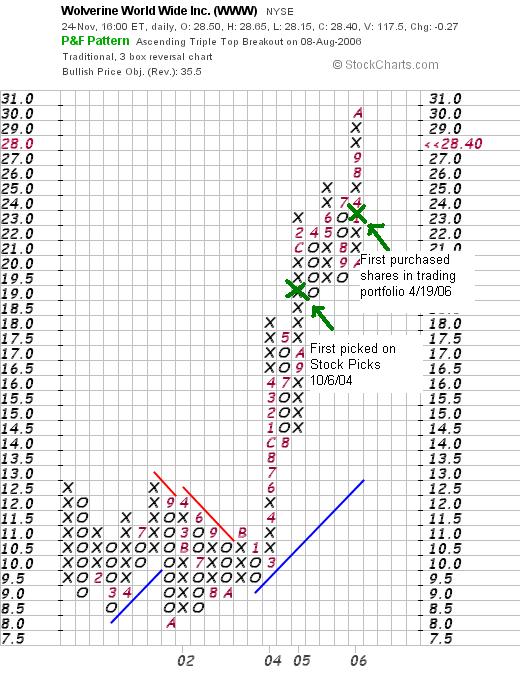
 I first reviewed Wolverine Worldwide (WWW) on Stock Picks Bob's Advice on October 6, 2004, when it was trading at $28.90. WWW had a 3:2 stock split on February 2, 2005, making my effective stock pick price actually $19.27. WWW closed at $28.40 on November 24, 2006, for a gain of $9.13 or 47.4% since it was picked on the blog.
 I purchased 240 shares of WWW in my actual trading portfolio on April 19, 2006, with a cost basis of $23.55/share. With Friday's closing price of $28.40, this represents an unrealized gain of $4.85 or 20.6% since purchase. I have not sold any of my original purchase. According to my plan of selling 1/6th of my shares at a 30% gain, if the stock reaces 1.30 x $23.55 = $30.62, then I would plan on selling 40 shares and this would give me the "permission" to add a new position to my trading portfolio. On the other hand, since I have not sold any shares, if the stock would fall to an (8)% loss, or .92 x $23.55 = $21.67, then I would plan on selling all of my holding at that time.
Let's take another look at this stock and see if it still deserves a place on this blog!
1. What does this company do?
According to the Yahoo "Profile" on WWW, the company
"... engages in the design, manufacture, and marketing of a line of casual shoes, rugged outdoor and work footwear, and constructed slippers and moccasins primarily in the United States. It offers work, outdoor, uniform, and lifestyle boots and shoes; performance and lifestyle footwear; and comfortable casual, dress footwear, and slippers through its Wolverine Footwear Group, Outdoor Group, Heritage Brands Group, and Hush Puppies Company. The company provides its products under various brand names, including Bates, CAT, Harley-Davidson, Hush Puppies, HyTest, Merrell, Sebago, Stanley, and Wolverine."
2. How did Wolverine do in the latest reported quarter?
On October 4, 2006, Wolverine announced 3rd quarter 2006 results. Revenue for the quarter came in at $298.9 million, a 7.1% increase over the $279.1 million reported in the same quarter the prior year. Earnings per share were up 9.5% to $.46/share, up from $.42/share the prior year. The company also raised guidance for 2006 to $1.41 to $1.44/share, from prior guidance of $1.38 to $1.42. WWW left revenue estimates for the year unchanged. This result exceeded expectations of $.44/share, although revenue was in line with the estimated $299 million.
3. How about longer-term results?
Reviewing the Morningstar.com "5-Yr Restated" financials on Wolverine Worldwide (WWW), we can see a pretty picture of steady revenue growth from $720 million in 2001 to $1.06 billion in 2005 and $1.1 billion in the trailing twelve months (TTM).
Earnings per share have also steadily increased from $.71/share in 2001 to $1.27 in 2005 and $1.37/share in the TTM. The company also pays a dividend and has been steadily increasing the dividend from $.11/share in 2001 to $.26/share in 2005 and $.28/share in the TTM.
Also nice, the company has kept its shares stable with 61 million outstanding in 2001, 56 million in 2005, and 60 million in the TTM.
Free cash flow has been nicely positive with $86 million in 2003, $100 million in 2005 and $97 million in the TTM.
The balance sheet, as presented by Morningstar.com, appears gorgeous to me! The company is reported to have $81 million in cash and $377.5 million in other current assets giving a total of $458.5 million in total current assets. When compared to the $132.8 million in current liabilities this yields a current ratio of 3.45...with a ratio of 1.5 or higher being considered strong. The company is reported to have a nominal $60.1 million in long-term liabilities, easily covered by the current assets. The balance sheet looks quite strong to me.
4. What about valuation?
Reviewing the Yahoo "Key Statistics" on Wolverine, we see that this is a mid-cap stock with a market cap of $1.58 billion. The trailing p/e is a moderate 20.11, with a forward p/e (fye 31-Dec-07) of 17.53. The PEG is a reasonable 1.42. (Generally PEG ratios between 1.0 and 1.5 are acceptable to me).
Reviewing Fidelity.com eresearch for some more valuation numbers on this stock, WWW is in the "Textile-Apparel Footwear/ Accessories" industrial group. Compared to the other stocks in the group, WWW is reasonably priced with a Price/Sales ratio of 1.4. Leading this group is another favorite (and holding) of mine, Coach (COH) with a Price/Sales ratio of 7.2. They are followed by VOLCOM (VLCM) at 4.1, Nike (NKE) at 1.6, then Wolverine (WWW) at 1.4, and Timberland (TBL) at 1.3.
Insofar as one measure of profitability, Return on Equity (ROE) is concerned, Coach is actually the most profitable with a 40.1% ROE, followed by VOLCOM at 25.1%, Timberland at 21.8%, Nike at 21.5%, and Wolverine at the bottom of this group with a ROE of 17%.
Returning to Yahoo, we find that there are 55.66 million shares outstanding with 53.84 million that float. Currently, there are 2.38 million shares out short (10/10/06) representing 4.4% of the float or 4.5 trading days of volume. Using my "3 day rule" on short interest, this is somewhat significant and may be supporting the stock price in the event of any 'good' news. As already noted the company pays a dividend with a forward rate of $.30/share and an anticipated forward yield of 1.00%. The last stock split, as I noted above, was a 3:2 split on February 2, 2005.
5. What does the chart look like?
Reviewing the "Point and Figure" chart on Wolverine Worldwide (WWW) from StockCharts.com, we can see that the stock was grading sideways from 2001 into 2002, and broke out at around $10.50 in March, 2003, and then climbed very strongly to its current level around $28.40. The chart looks quite strong. I noted my first stock pick price and my purchase price on the chart below.
6. Summary: What do I still think about this stock?
Let me try to review some of the things I discussed above. First of all the stock is performing just fine trading within 10% of its all time high. The latest quarter was steady with growth in both revenue and earnings and found the company beating expectations on earnings and raising earnings guidance. Both are strong.
Longer-term, the company has been remarkably steady in raising revenue, increasing revenue, and paying an increasing dividend. All this while maintaining a steady number of outstanding shares and spinning off an adequate amount of free cash flow. The balance sheet looks superb with assets outweighing liabilities substantially. Valuation-wise the p/e is moderate with a PEG of about 1.5. The Price/Sales is quite cheap, although the return on equity (ROE) figure is less impressive. Finally, there are even a good number of short-sellers (who probably, and rightfully so, believe the chart looks a bit over-extended), however, with any good news, we may see a bit of a squeeze. In summary, I still like this stock. Now, of course I am biased as I am an owner of this, and I also remember my first pair of Hush Puppies years and years ago which I was crazy about....those light shoes with the fuzzy leather!
Thanks again for stopping by and visiting! If you have any comments or questions, please feel free to drop me a line at bobsadviceforstocks@lycos.com and be sure to visit my Stock Picks Podcast website where I discuss many of the stocks and strategies that I write about here on the blog.
Have a Happy Thanksgiving Weekend everyone!
Bob
"Looking Back One Year" A review of stock picks from the week of July 18, 2005

Hello Friends! Thanks so much for stopping by and visiting my blog, Stock Picks Bob's Advice! As always, please remember that I am an amateur investor, so please remember to consult with your professional investment advisors prior to making any investment decisions based on information on this website.
One of my weekend tasks that I try to perform here on the blog, is to look at past stock selections and see if they are still worthy of consideration. This evaluation assumes a buy and hold strategy without any sales at either declines or appreciation in price. In practice, I advocate and practice a disciplined portfolio investment strategy that unloads stocks quickly and completely on small losses and directs me to sell small portions of my positions if and when they reach certain appreciation targets. This strategy would certainly affect investment performance and be taken into consideration.
I like to give a simple "thumbs-up" or "thumbs-down" on these stocks simply based on latest quarter earnings report. All that I require to give the stock a thumbs-up is that BOTH the earnings and revenue have increased. I simply do not do an involved fundamental and/or technical analysis on these stocks that I briefly review.
 On July 18, 2005, I picked Charles and Colvard (CTHR) on Stock Picks Bob's Advice when it was trading at $27.87. CTHR had a 5:4 stock split on 1/31/06 making my effective stock pick price actually $22.30. CTHR closed at $8.18 on 11/24/06, for a loss on my stock pick of $(14.12) or (63.3)% since posting.
 On October 14, 2006, CTHR announced 3rd quarter 2006 results. Net sales increased 7% to $12.1 million, up from $11.3 million for the same quarter in 2005. Net income was flat at $2.2 million or $.12/share, unchanged from the $2.2 million or $.12/share reported in the same quarter the prior year.
 On July 19, 2005, I posted CDW Corp (CDWC) on Stock Picks Bob's Advice when it was trading at $61.98/share. CDWC closed at $70.09 on November 24, 2006, for a gain of $8.11 or 13.1% since posting.
 On October 18, 2006, CDWC reported 3rd quarter 2006 results. Sales came in at $1.74 billion, up 4.1% over the prior year. Net income grew 6.3% to $77.7 million, and diluted earnings per share came in at $.98/share up 11% over the prior year results.

Finally, on July 19, 2005, I posted FileNet (FILE) on Stock Picks Bob's Advice when it was trading at $29.97/share. As announced on August 10, 2006, IBM acquired FileNet (FILE) for $35.00/share with a resultant appreciation of $5.03 or 16.8% over the stock pick price. FILE is no longer traded as an independent company.
So how did I do with these three stocks? Well, because of the stock implosion of CTHR, rather poorly actually. There was one losing stock and two gainers for an average loss of (11.1)%. You can see from this how important it is to limit losses to avoid undermining your entire portfolio. I did not own any of these three stocks and do not currently.
Thanks so much for stopping by and visiting! If you have any comments or questions, please feel free to email me at bobsadviceforstocks@lycos.com or simply leave your comments right on the blog. Please also stop by and visit my Stock Picks Podcast Website.
Bob
A Reader Writes "...thought you might be interested in this observation."
Hello Friends! Thanks so much for stopping by and visiting my blog, Stock Picks Bob's Advice! As always, please remember that I am an amateur investor, so please remember to consult with your professional investment advisors prior to making any investment decisions based on information on this website.
 One of my favorite things about writing a blog about my experience with investing and some ideas that I have had about how to do this, is to receive feedback from readers who also are thinking about investing and approaches to managing their portfolios.
The other day I received a very nice letter from Imad Y. who wrote:
"Hi Bob,
I have been reading your blog on and off for the last
year. I like your strategy. However, going through
last spring's sell off (losses), I concluded that
something still missing on reacting to market.
After few observations, I think I found the missing
link (I could be wrong but it seems to work)
As market trended down earlier this year, you started
unloading stocks that hit -8% (Many did!)
What we can add to this strategy is that if the down
trend is market related, not company performance, we
should sit on our hands until the market starts
correcting then go back buy all/ most of the stocks
that were unloaded. The reasoning behind this is that
your selection criterion is strong; therefore at a
correcting market, what is better than buying strong
stock at a bargin price!
To verify this, you can pull the charts for the stocks
that you sold in April/ May and see how they did from
July onward.
Once again I could be off track since I am first-grade
amateur trader, but thought you might be interested in
this observation.
Regards,
Imad "
First of all, thanks so much for writing and thinking about what I have been writing! I must tell you that there is a great deal of truth in what you write. It would be very nice to sell stocks only that were dropping due to stock-specific news. In other words, if the stock drops due to a market condition, then maybe ignore the drop...and hopefully as the market turns back up, the stock price will be moving higher once again.
First of all, let me review my four stocks that I sold the last six months on "bad news", meaning either fundamental information or stock price performance regardless of market conditions. And let's see if your premise is correct. I shall draw in a red "x" to show the sale point on all of these stocks.
First, Genesco (GCO) was sold on 7/12/06 at $31.59.
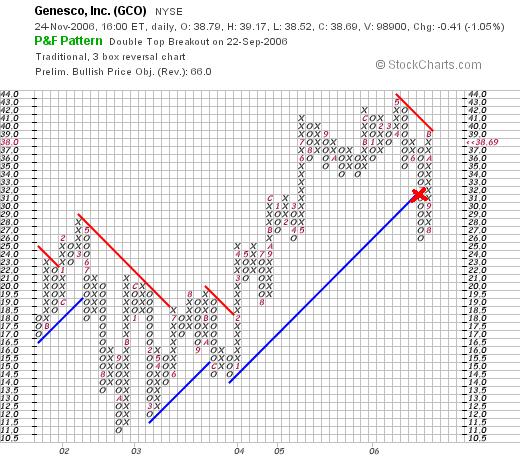
Here you can see that indeed you are correct. Genesco did continue to drop after my sale, but then turned around and rebounded to its current level...where it closed at $38.69 on November 24, 2006.
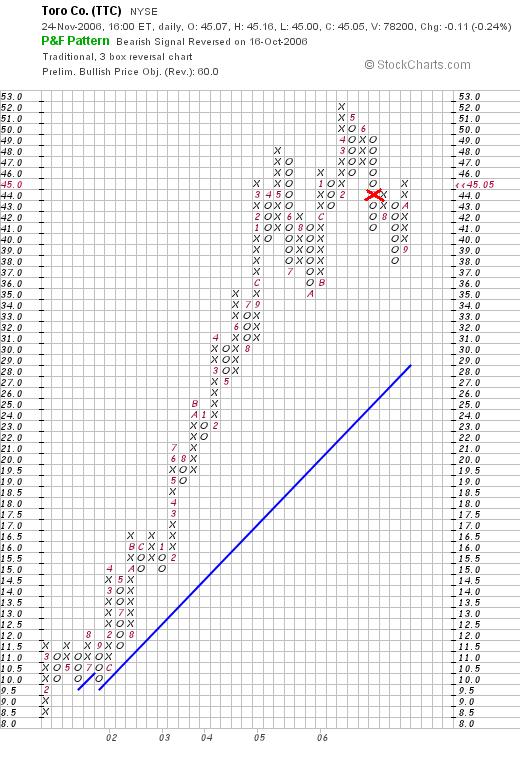
My next sale was Toro (TTC), which I sold at $44.06 on July 13, 2006.
Here is the current chart with the red "X" again being my sale point:
My next sale was Barnes (B) on July 17, 2006, when I sold my shares at $17.97.
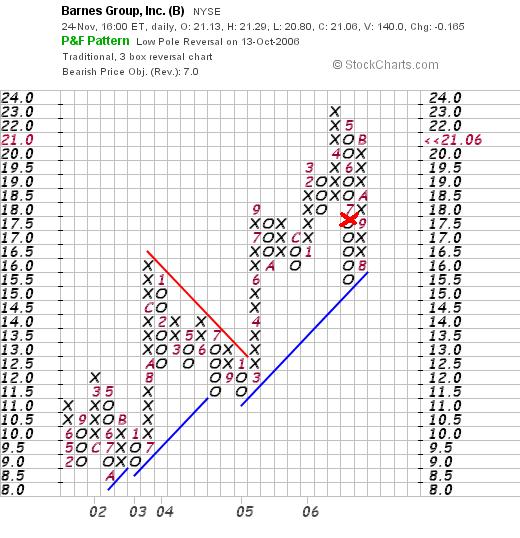
Again Barnes (B) dropped further after my sale, but did indeed move to a higher level, closing at $21.06 on 11/24/06.
All three of those stocks were sold because of my own technical indicators, that is they had hit sale points that I had determined. However, my most recent sale was my own assessment of a fundamental problem with earnings results. Healthways (HWAY) was sold on 7/17/06 at $40.64.
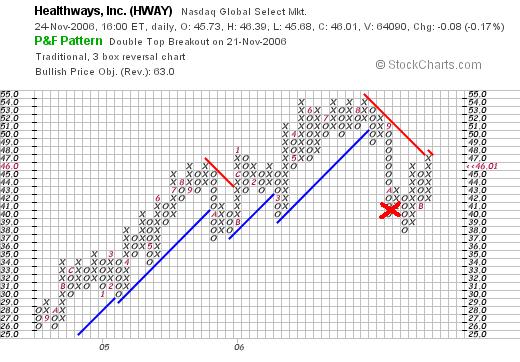
Once again, you are correct. HWAY turned lower after my sale, but then moved higher to its current level of $46.01, where it closed on 11/24/06. This particular graph is not quite as reassuring as the others but it is noteworthy that the stock price recovered.
Before completely agreeing with you, even though each of these examples does show price recovery in each of these stocks, I believe that this is more a testimony to my stock-picking techniques than a condemnation of my portfolio management strategy.
Let me explain. You point out correctly that stocks may decline just due to market forces and that we should thus "sit on our hands". I suppose you would also agree that selling stocks on fundamental 'bad news' is reasonable, and I would concur with that.
My strategy of selling stocks even if the price decline is due to the overall market stems from my belief, that if it is all possible, it would be nice to be relatively underinvested in a bear market. If the market is starting to maul all of the stocks, why would anyone like to be in the market at all? Yet, how can any individual actually predict the overall future market direction successfully. I do not claim to be able to predict where the market will be even a month into the future.
My sensitivity to the Market comes from my experience with the CANSLIM theory as advocated by O'Neil. For him, being out of the market in overall market corrections, and being fully-invested in strong bull-markets is an admirable goal. By giving each new investment a short leash, so to speak, I hopefully will avoid large losses due to a market correction, or for that case, due to anything. However, there will be times that I shall be "shaken out", especially on newer stock picks.
So while I completely agree with you on your points in general, I plan on continuing with my current strategy. I simply cannot know when I should be breaking my "rules" without losing complete control of my disciplined trading strategy.
Also, you will note that as I hold stocks longer and longer, I give them longer and longer leashes so-to-speak, allowing them to pull-back and advance without a sale. That is why, as my portfolio has "matured", I find myself trading less and less and sitting on my hands more often!
I sure hope that explains my behavior. Thank you for pointing out your observations. They aren't wrong, they just represent a different approach to managing a portfolio. If you do try to make this modification, why don't you email me again in a few months and let me how it is working out for you and how you deal with managing your portfolio to prevent losses in case of a major market melt-down.
If you have any other comments or questions, please feel free to email me at bobsadviceforstocks@lycos.com or simply leave them on the blog. Also, be sure and visit my Stock Picks Podcast Website where I discuss many of the same stocks and strategies that I write about on the blog.
Bob
Posted by bobsadviceforstocks at 10:35 AM CST
|
Post Comment |
Permalink
Updated: Saturday, 25 November 2006 4:27 PM CST
Wednesday, 22 November 2006
Airgas (ARG)
Hello Friends! Thanks so much for stopping by and visiting my blog, Stock Picks Bob's Advice! As always, please remember that I am an amateur investor, so please remember to consult with your professional investment advisors prior to making any investment decisions based on information on this website.
 I was looking through the list of top % gainers on the NYSE and came across Airgas (ARG), which as I write is trading at $41.61, up $1.63 or 4.08% on the day. I do not own any shares nor do I have any options on this stock.
I would like to briefly share with you my thinking as I believe this stock deserves a place on my blog!
According to the Yahoo "Profile" on Airgas, the company
"...and its subsidiaries distribute industrial, medical, and specialty gases and hardgoods primarily in the United States. Its products and services include packaged and small bulk gases, gas cylinder, and welding equipment rental, and hardgoods."
On October 25, 2006, Airgas reported 2nd quarter earnings results for the quarter ended September 30, 2006. Net sales for the quarter grew to $790.7 million from $702.2 million in the same quarter the previous year. Net earnings increased to $39.5 million this year vs. $29.6 million last year, or $.49/share this year, and $.38/share last year on a diluted basis. The company exceeded analysts' expectations of $.47/share on net sales of $790 million. In addition, the company raised guidance to $.47 to $.49/share for the third quarter, while analysts have forecast $.47/share.
Looking longer-term at the Morningstar.com "5-Yr Restated" financials on ARG, we see a steady increase in revenue from $1.6 billion in 2002 to $2.8 billion in 2006 and $2.9 billion in the trailing twelve months (TTM). Earnings also show steady improvement, and the company started paying a dividend of $.16/share in 2004 and has been increasing the dividend on a regular basis. The number of shares outstanding has grown from 69 million in 2002 to 78 million in the TTM. Free cash flow has been positive and steady and the balance sheet is adequate with $33.1 million in cash and $447.8 million in other current assets, adequate to cover the $433.2 million in current liabilities. There is another $1.1 billion in long-term debt on the balance sheet.
Looking at the Yahoo "Key Statistics" on ARG, we see that this is a mid-cap stock with a market capitalization of $3.25 billion. The trailing p/e isn't bad at 23.41, the forward p/e is 18.46 (fye 31-Mar-08), however the 5 yr expected growth is such that the PEG is quite high at 5.76.
Reviewing the Fidelity.com eresearch website, we can see that Airgas (ARG) is in the "Industrial Equipment Wholesale' industrial group. Within this group ARG is moderately priced with a Price/Sales ratio of 1.1. Topping this group is MSC Industrial (MSM) at 2.1, and the cheapest in the group is CE Franklin (CFK) at 0.4.
Airgas actually has the lowest return on equity (ROE) of its group at 15.15. Topping the group is DXP Enterprises (DXPE) with a ratio of 40.1%.
Finishing up with Yahoo, we can see that this company has 78.01 million shares outstanding with 70.39 million that float. Of these, 643,520 were out short as of 10/10/06 representing .9% of the float or 1.4 trading days of volume. The forward dividend is $.28 representing a .7% yield, and the stock last split 4/16/96 with a 2:1 split.
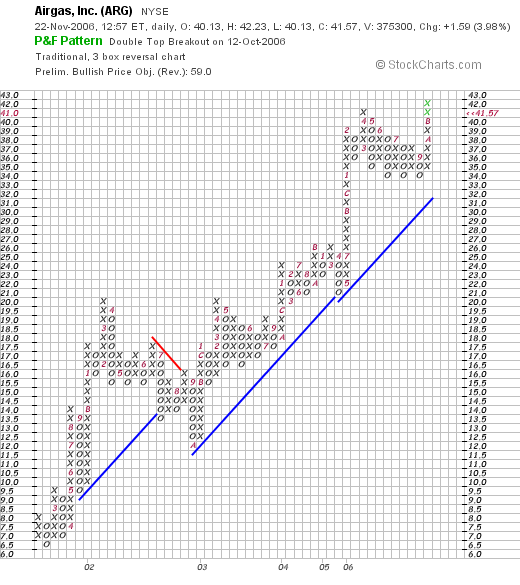
Airgas has a very pretty "Point & Figure" chart. The stock has climbed from a low of $6.50 in February, 2001, and has not broken down in price since. Currently the stock is pushing into new high territory at the $42 level.
To summarize, this has been a great stock to own the past several years. The company's stock moved higher today on the announcement of an acquisition of Linde's bulk gas unit for $495 million. The latest quarterly report was strong with the company beating expectations and raising guidance. The Morningstar evaluation looked nice with steady revenue and earnings growth, and an increasing dividend. The number of shares outstanding has been growing slowly. Free cash flow is positive and the balance sheet appears adequate. Valuation has been o.k. with a reasonable p/e but a PEG over 5.0. Finally, the chart looks terrific.
This is an interesting stock to consider. It isn't a perfect picture imho, but most of the numbers are in line and the price performance of the stock in the market has been superb!
Thanks again for stopping by! If you have any comments or questions, please feel free to drop me a line at bobsadviceforstocks@lycos.com. Also, please be sure to drop by and visit my Stock Picks podcast site, where I discuss many of the same stocks and topics that I write about on the blog.
Bob
Tuesday, 21 November 2006
Jack in The Box (JBX)
Hello Friends! Thanks so much for stopping by and visiting my blog, Stock Picks Bob's Advice! As always, please remember that I am an amateur investor, so please remember to consult with your professional investment advisors prior to making any investment decisions based on information on this website.
 The longer I blog here, the more elaborate and complicated my entries are becoming. While that may be appreciated (?), it becomes more of an intimidation every time I face my keyboard, intent on another entry. Let me try tonight to write briefly (have I ever succeeded?), and tell you a bit about Jack in The Box (JBX), and why I think it deserves a spot on the blog.
I do not own any shares nor do I have any options on this stock. But, having spent some of my younger years in California, I have indeed gone through the drive-in and have spoken with the "clown" to give it my order.
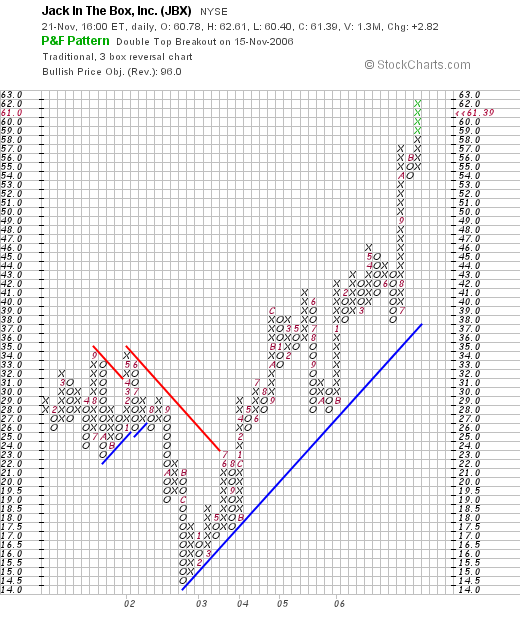
JBX made the list of top % gainers today, closing at $61.39, up $2.82 or 4.81% on the day.
What drove the stock higher was a terrific 4th quarter 2006 earnings report. Earnings for the quarter came in at $.92/share, up from $.59 last year. Net earnings came in at $33.2 million, up from $21.5 million last year. Total revenue came in at $670 million for the quarter up from $600.5 million last year. This beat expectations for $.66/share. The company reported solid same-store sales growth of 5.9% for the quarter. And the company announced a 5.5 million share buy-back, also bullish for the stock. The 'street' liked the news and the stock price climbed strongly today.
The Morningstar.com "5-Yr Restated" financials shows steady revenue growth, earnings growth, steady shares outstanding (37 million in 2003 and 35 million in the TTM), and positive free cash which appears to be growing as well. The balance sheet looks o.k. with plenty of current assets to cover the current liabilities, but there is the matter of $500 million in long-term liabilities on the balance sheet--doesn't appear to be a problem in light of the growing free cash flow.
Yahoo "Key Statistics" on JBX: mid-cap stock with a market capitalization of $2.17 billion, trailing p/e not bad at 22.94, forward p/e (fye 02-Oct-07) at 20.81. A bit of a rich PEG at 2.08 (but probably will move lower in light of stellar financial results latest quarter), and Price/Sales at 0.77.
35.42 million shares outstanding, 34.72 million that float. As of 10/10/06 there were 1.71 million shares out short representing 3.9 trading days of volume. No dividend paid, no stock split reported.
"Point & Figure" chart on JBX, shows a weak chart between 2001 and 2003. The stock broke out to the upside at $23 in July, 2003, and has been moving strongly higher since, now in the low $60's near its high.
I like this stock! They moved strongly higher today on a great earnings report which beat expectations. To top it off they announced a 5.5 million share buy-back. The company has an interesting casual Mexican Grill chain called Qdoba which it is developing, as well as a chain of convenience stores called "Quick Stuff", so it is a bit more than a hamburger chain.
The Morningstar.com report is solid, the graph looks nice, and the company is still relatively small with a market cap of about $2 billion. For comparison McDonald's has a market cap of about $52 billion. So there should be room for JBX to grow!
Thanks so much for stopping by! I hope you don't mind my abridged note. If you have any comments or questions please feel free to email me at bobsadviceforstocks@lycos.com. Also, be sure and visit my Stock Picks Podcast Website.
Bob
Saturday, 18 November 2006
A Reader Writes "Among my own stock picks is Sonoco Products (SON).."
Hello Friends! Thanks so much for stopping by and visiting my blog, Stock Picks Bob's Advice! As always, please remember that I am an amateur investor, so please remember to consult with your professional investment advisors prior to making any investment decisions based on information on this website.
I was over at a friend's house the other night for a political fund-raiser and as is often the case I found myself moving conversation towards investing. (Is that hard to believe?) I was trying to explain my investing strategy to some acquaintances and is often the case, discussion came around to Fastenal (FAST). This is a popular stock around here because the company is headquartered not too far from where I live, and indeed, the stock has done quite well over the years.
I like Fastenal. But what I like about Fastenal is not its geographic location or the fact that some locals have literally become millionaires investing in the stock. What I tried to point out was that as an investor it is important to find stocks like Fastenal....by 'profiling' companies....I try to identify companies that have many of the same characteristics of FAST, as potential investments. William O'Neil attempted to do the same thing with his CANSLIM approach which was also a way to identify stocks in some objective, not subjective, fashion that had the characteristics of a winning stock. I do not use CANSLIM, but I have been affected by Mr. O'Neil's and the IBD approach.
Anyhow, Caroline wrote:
"Bob: thanks for your excellent write-up on Best Buy. You have a lot there!
Among my own stock picks is Sonoco Products (SON on NYSE)--founded in 1899 in Hartsville, S. C., and is a leader in packaging around the globe. It's another company like Fastenal in that the average person on
the street doesn't know the name, although this same average person comes into contact with the product nearly every day.
SON produces so many of the containers and packaging that consumers pick up at the grocery store-- Folger's coffee, Minute Maid orange juice, cookies, razor blades, etc. They are busy inventing new packaging devices for keeping food products fresh all the time.
Companies like Maytag, Amana, GE buy their packaging for refrigerators, stoves, microwaves--and the
consumer tosses Sonoco's products once the appliance is installed in the home. SON owns lots of forest acerage around the south, esp. S. C.Hugh McColl was ( or may still be) on the board--H. M. was behind the banking explosion--mergers, etc.--some years ago, and was responsible for making Charlotte a banking center of the south.
SON is NOT a glamous, go-go company making national headlines on the money shows. Slow and steady would describe the company.Just as people here know the name Fastenal, people in S. C. and the south know the name Sonoco. There is a plant in Wausau (I believe.)
It started out as the Southern Novelty Company, when they figured out how to make paper products out of pine trees. Early on they served the textile industry of North Carolina with cones, etc. for wrapping textiles on. A world lost on the south now!
More anon.
Bullish on SON, Caroline"
Caroline, thank you so much for writing. You have obviously done some work on this stock, and I am glad that you have done well and also have some family member(s) that work at Sonoco. I don't own any shares of this stock, but I would be happy to take a look at it and see what I can find out.
Most of your comments would fall into the Peter Lynch style of investing. Sort of like explaining what the company does and how all of its products are around us all the time. In addition, some investors like to follow certain people who may either be on the board or CEO's. Some of these gifted individuals do indeed seem to make a big difference on the fortune of companies.
However, my approach is closer to what might be called a "Quantitative Approach to Investing". While not using any computers, I am attracted to stocks not so much by what they do, but by how they are doing. For me, a quality investment is not determined by the quality of its products (although that can be helpful in the success of a company without a doubt), but by the quality of its financial results. For me, quality financial results is a matter of predictable consistency. I believe that a company that has been regularly been growing its revenue, earnings, and free cash flow, is likely to continue to do so into the future. This has also been referred to as earnings momentum.
But before completely digressing, let's take a quick look at Sonoco (SON) and Iu will let you know what I think from my perspective.
 Sonoco (SON) closed at $36.75 on November 17, 2006. It was up $.02/share or 0.05% on the day.
1. How did they do in the latest quarter?
On October 18, 2006, SON announced third quarter 2006 results. For the quarter ended September 24, 2006, net sales were up almost 6% to $932 million, from $881 milion in the same period last year. Net income climbed nicely, up 33% to $61.1 million, from $45.9 million the prior year. Diluted earnings per share were up 30% to $.60/share, from $.46/share last year. The company also pays a dividend and paid $.24/share this quarter, up $.01 from $.23/share paid in the same quarter the prior year. According to this report, the company beat expectations for earnings, but slightly missed on the revenue side.
2. How about longer-term results?
Reviewing the Morningstar.com "5-Yr Restated" financials on SON, we find that revenue has been slowly increasing from $2.5 billion in 2001 to $3.5 billion in 2005 and $3.6 billion in the trailing twelve months (TTM).
Earnings have also been steadily increasing from $.96/share in 2001 to $1.61/share in 2005 and $1.77/share in the TTM. The dividends, which were $.80/share in 2001, have been increased each and every year to $.91/share in 2005 and $.93/share in the TTM.
The number of shares outstanding has been increased slightly from 96 mnillion shares in 2003 to 99 million in 2005 and 99 million in the TTM.
Free cash flow has been positive, although not really increasing, with $219 million in 2003, dropping to $98 million in 2005, and rebounding to $191 million in the TTM.
The balance sheet is solid with $60.7 million in cash and $846.8 million in other current assets. When combined and compared to the $632.6 million in current liabilities, we find that the current ratio works out to a reasonable 1.43.
3. How about some valuation numbers?
If we review the numbers from the Yahoo "Key Statistics" page on SON, we find that this is a large mid-cap stock with a market capitalization of $3.67 billion. The trailing p/e is moderate at 19.11 with a forward p/e of 15.91. The PEG however, suggests that based on the 5 yr estimates, the stock is relatively richly valued, as it is a 2.37. Generally, I like PEG ratios of 1 to 1.5.
Recently I have looked more closely at the Price/Sales ratio. I read an excellent article by Paul Sturm last year who suggested that the importance of this ratio is relative to other stocks in the same group. Reviewing the information from the Fidelity.com eresearch website, we find that SON is in the "Paper & Paper Products" industrial group. Within that group, SON is reasonably priced with a Price/Sales ratio of 1. Leading this group is Kimberly-Clark (KMB) at 1.9, Avery Dennison (AVY) at 1.2, then Sonoco (SON) at 1, International Paper (IP) at 0.7, Smurfit-Stone Container (SSCC) at 0.4, and Bowater (BOW) at 0.3.
Another valuation parameter I like to review is the Return on Equity (ROE). I also like to compare this profitability measure with other companies in a similar business. Again, SON does fairly well with a return on equity of 15.2%. This is exceeded by Kimberly-Clark at 24.3%, Avery Dennison at 19.1%, and followed by International Paper at 3%, and two companies with losses: Smurfit-Stone at (10.1)%, and Bowarer with a negative (30.9)%. So by this measure, Sonoco also doesn't look too bad!
Finishing up with Yahoo, we find that there are 99.75 million shares outstanding with 96.54 million that float. As of 10/10/06, there were 488,310 shares out short representing 1.6 days of average volume (the short ratio). This is well below my idiosyncratic 3 day rule of significance.
The company does pay a nice dividend of $.96/share estimated going forward, yielding 2.6%. The last stock split was a 11:10 (or a 10% stock dividend), declared May, 13, 1998.
4. What does the chart look like?
Checking the Sonoco "Point & Figure" chart from StockCharts.com, we can see that the company which was basically moving sideways between 2001 and much of 2004, at a level around $20, broke through resistance in late 2004 and around $22 and has moved steadily higher to the $36 level now. The stock really has shown some strength since March, 2005.

5. Summary: So what do I think about Sonoco Products?
Quite frankly Caroline, this is an attractive stock. It isn't about what the company does, although that may contribute to the financial results. It isn't about the history, the geographic location, or who is on the board. It is simply about the steady increase in revenue, earnings, and positive free cash flow in the face of a solid balance sheet. In addition, the company has been keeping its number of shares stable and increasing it relatively significant dividend. The p/e isn't bad, but the PEG is rich. The Price/Sales and the ROE look reasonable, and the chart is encouraging.
I have to admit that this is a nice company from my perspective as well! I don't own any shares, but if it ever is making a nice move higher on the day i have a "permission slip" to add a new position, this might well be a stock i would be adding to my portfolio!
Thanks again for writing! If you have any other comments or questions, please feel free to leave them on the blog or email me at bobsadviceforstocks@lycos.com. If you get the chance, drop by my Stock Picks Podcast Site, where I discuss some of the same stocks and topics I wrtite about here on the blog.
Bob
"Looking Back One Year" A review of stock picks from the week of July 11, 2005

Hello Friends! Thanks so much for stopping by and visiting my blog, Stock Picks Bob's Advice! As always, please remember that I am an amateur investor, so please remember to consult with your professional investment advisors prior to making any investment decisions based on information on this website.
Let's take a look at the stocks I discussed during the week of July 11, 2005, and find out how they turned out! For the sake of this evaluation, I assume an equal $ amount invested in each stock and a buy and hold strategy. In practice, I recommend and employ an active investment strategy that involves selling poorly performing holdings quickly and completely, and selling appreciating stocks slowly and partially at targeted price appreciation levels. This difference would certainly affect performance and should be taken into consideration.
 On July 11, 2005, I posted Arrhythmia Research Technology Research (HRT) on Stock Picks Bob's Advice when it was trading at $14.55. I have never owned any shares of this stock. HRT closed at $21.11 on November 17, 2006, for a gain of $6.56 or 45.1% since posting.
On November 3, 2006, Arrhythmia Research announced 3rd quarter 2006 results. Total revenue climbed 32% to $4.41 million from $3.34 million in the same quarter last year. Net income increased 94% to $510,000 from $263,000 and earnings per share jumped 90% to $.19/share up from $.10/share in the same quarter last year.
 On July 13, 2005, I posted Resources Connection (RECN) on Stock Picks Bob's Advice when it was trading at $29.42. I do not own any shares of this stock. RECN closed at $29.75 on November 17, 2006, for a gain of $.33 or 1.1% since posting.
On September 27, 2006, RECN reported 1st quarter fiscal 2007 results. While total revenue did climb 10.4% to $165.1 million from $149.6 million in the same quarter last year, GAAP net income was $11 million or $.22/diluted share, down from $15.1 million or $.29/diluted share. This quarter was adversely affected by "SFAS 123", the "accounting pronouncement requiring the recognition of compensation expense related to employee stock option grants and employee stock purchases..." Non-GAAP net income, excluding the stock-based compensation expense worked out to $15.1 million or $.30/share. This still wasn't anything terrific to 'write home about' and for the purpose of this blog, I stay with GAAP results, and thus, we get a 'thumbs-down' on this earnings resut.
 Finally, on July 15, 2005, I posted Cintas (CTAS) on Stock Picks Bob's Advice when the stock was trading at $44.00. Cintas closed at $43.47 on November 17, 2006. I do not own any shares of this stock. This represents a loss of $(.53)/share or (1.2)% since posting.
On September 20, 2006, Cintas announced 1st quarter 2007 results. Revenue increased 11% to $914.2 million from $823.5 million last year. Net income climbed to $85 million or $.53/share, up from $78.4 million or $.46/share in the same quarter last year. Analysts had been looking for $920.8 million in sales and earnings of $.51/share. So the company underperformed a bit on the revenue side but then exceeded expectations on the earnings side. A mixed bag on the expectations business but overall nice results for the quarter.
So how did I do for the week of July 11, 2005? Well, one of the stocks had a nice gain and the other two showed very small changes; one with a small gain and the other with a small loss. Averaging this performance gets us an average gain of 15% for the three stocks.
Thanks so much for stopping by and visiting! If you have any comments or questions, please feel free to drop me a line at bobsadviceforstocks@lycos.com or go ahead and leave your comments right on the blog. If you get a chance, please stop by and visit my Stock Picks Podcast site!
Have a great weekend!
Bob
Friday, 17 November 2006
Hibbett Sporting Goods (HIBB) "Revisiting a Stock Pick"
Hello Friends! Thanks so much for stopping by and visiting my blog, Stock Picks Bob's Advice! As always, please remember that I am an amateur investor, so please remember to consult with your professional investment advisors prior to making any investment decisions based on information on this website.
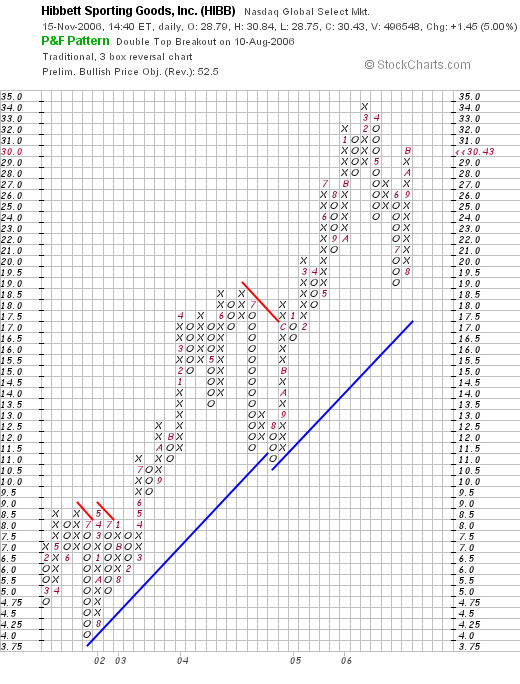
 I was looking through the list of top % gainers on the NASDAQ and came across Hibbett Sporting Goods (HIBB) which closed at $32.81, up $3.19 or 10.77% on the day. i do not own any shares of Hibbett currently, but have owned shares, and have reviewed this stock on this blog previously. I believe it deserves another examination and I think I will show you how unique this little sporting goods company is!
I first purchased shares of HIBB on March 6, 2003. Writing about HIBB on March 10, 2005, I pointed out I then had a cost basis of $9.74/share on my shares I owned. (I have since sold all of my shares in Hibbett). Considering that the stock had a 3:2 stock split on September 28, 2005, this would make my cost basis on those shares (if I still owned them) actually $6.49. Thus, with today's price of $32.81, this would be an appreciation of $26.32 or 405.5% since I first purchased shares. However, I sold all of my shares back on May 19, 2006, when I sold 84 shares of HIBB for $2,052.02, or at $24.43/share. Still a nice appreciation on these shares of stock.
I first wrote up Hibbett Sporting Goods on March 10, 2005, when the stock was trading at $29.49. Adjusted for the 3:2 stock split later that year, this works out to a pick price of $19.66. With today's closing price of $32.81, this represents a gain of $13.15 or 66.9% since posting this stock 1 1/2 years ago! Not as great as my 2003 purchase price, but still a very impressive performance.
Let's take a closer look at this company, and I will share with you why i believe this stock deserves a spot on my blog.
1. What exactly does this company do?
According to the Yahoo "Profile" on Hibbett, the company
"... operates sporting goods stores in small to mid-sized markets in the Sunbelt, Mid-Atlantic, and Midwest. The company’s stores offer athletic equipment, footwear, and apparel. As of January 28, 2006, it operated 527 Hibbett Sports stores, as well as 18 smaller-format Sports Additions athletic shoe stores and 4 larger-format Sports & Co. superstores in 22 states."
2. Was there any news to explain today's strong move higher?
Yesterday, after the close of trading, Hibbett announced 3rd quarter 2007 earnings results. For the quarter ended October 28, 2006, net sales increased 17.2% to $129.7 million, up from $110.6 million from the prior year same period. Net income for the quarter grew 21.5% to $9.9 million from $8.2 million in the third fiscal quarter of last year. On a diluted share basis, this came in at $.31/share, up from $.24/share last year.
Besides demonstrating strong results, I consider this a strong quarterly report because the company beat expectations for revenue of $125 million and earnings per share of $.28/share. The company also raised guidance on fiscal 2007 to earnings of $1.12 to $1.16/share with same-store sales in the 3-5% range increase. Same-store sales for this quarter rose ahealthy 7.1%. Thus HIBB did the old "trifect-plus" imho, increasing earnings and revenue, beat expectations on both of those, and raised guidance.
3. Latest quarterly result?
See above.
4. Longer-term financial results?
If we review the Morningstar.com "5-Yr Restated" financials, we can see that the company has grown its revenue from $241 million in 2003 to $440 million in 2006 and $463 million in the trailing twelve months (TTM).
Earnings have also steadily increased from $.34/share in 2002 to $.98/share in 2005 and $1.00/share in the TTM.
I like to see a stable number of shares to know that the company is not actively diluting investors' ownership of the company. Indeed, there were 33 million shares in 2002, 34 million in 206 and 32 million shares in the trailing twelve months (TTM).
Free cash flow has been solidly positive, although down in the past two years with $26 million in 2004, $33 million in 2005, $23 million in 2006 and $14 million in the TTM.
Checking the balance sheet from Morningstar.com, we can see that the company has $5.5 million in cash and $144.4 million in other current assets. This about can easily cover both the $54.6 million in current liabilities and the $14.7 million in long-term liabilities more than 2x over. When calculating the current ratio, we calculate a ratio of 2.75, which is quite healthy.
5. What about some valuation numbers?
Examining Yahoo "Key Statistics" on HIBB, the company is reported to have a market cap of $1.05 billion, making it a mid-cap stock. The trailing p/e is moderately rich at 32.58, with a forward p/e a bit better at 25.05 (fye 28-jan-08). With the rapid growth in earnings anticipated to continue, the PEG (5 yr expected) works out to a nice 1.13.
According to the Fidelity.com eResearch website on HIBB, Hibbett is in the "Sporting Goods Stores" industrial group. At least by the measure of the Price/Sales ratio, when compared to stocks in the same group, Hibbett is relatively 'pricey' with a ratio of 2.1. HIBB is followed by Dick's Sporting (DKS) at 1.1, Golf Galaxy (GGXY) at 1, Cablela's (CAB) at 0.8 and Big 5 Sporting Goods (BGFV) at 0.7.
Insofar as profitability, as measured by the Return on Equity (ROE), Hibbett does a little better, with a ROE of 27%, exceeded only by Big 5 at 34.6%, and followed by Dick's at 21.5%, Cablela's at 11.4% and Golf Galaxy at 10.7%. Thus, while a bit 'pricey', the company shows strong profitability.
Finishing up with Yahoo, we can see that the company has 32.03 million shares outstanding with 31.90 million that float. As of 10/10/06, there were 2.64 million shares or 8.30% of the float out short. In light of the relatively light average volume of 318,197 shares/day, this represents the trading volume of 8.2 days (the short ratio). Using my '3 day rule', this is a significant figure, and today's sharp rise on the back of good news, might well represent a "short squeeze" as the many short-sellers scramble to find shares to cover their already sold shares to limit their losses as the stock price climbs.
The company doesn't currently pay a dividend, and as I noted above, the company last split its shares with a 3:2 stock split on September 28, 2005.
6. What does the chart look like?
If we review a "Point & Figure" chart on Hibbett, we can see a beautiful graph of ascending stock price since the company hit a low of $4.00 in July, 2001. The company subsequently moved higher in a rather uninterrupted fashion to its recent high at $34 in March, 2006, and is currently moving once again towards its high closing at $32.81 today.
7. Summary: What do I think about this stock?
Let's review some of the things I commented on in this entry. First of all, the company had a very strong move higher today after terrific earnings were announced yesterday. This might well have been a short squeeze as the number of shares out short has not been insignificant. The company reported yesterday same-store sales for the quarter above 7%, beat expectations for both earnings and revenue and raised guidance. This was clearly what I would call a 'trifecta-plus' earnings report!
Longer-term, the company has been cranking out revenue growth in a very consistent pattern. Earnings have also been growing steadily. Free cash flow is positive (although dipping the past year or so), and the balance sheet is gorgeous, with a current ratio over 2.5.
Valuation wise, the p/e is a bit rich, but the PEG is just a tad bit over 1.0. The Price/Sales is the tops in its group, also indicating a premium valuation, but the Return on Equity is #2 in its group suggesting once again that the extra you might need to pay for this stock may well be worth it. There really aren't too many shares outstanding.
On a "Peter Lynch" basis, there is something extremely attractive to me about Hibbett (even if I don't currently own any shares!). The company is really following the Wal-Mart pattern of growth, concentrating in small towns of about 50,000 or so and starting in the south-east and spreading out across the country. The company even likes to locate itself in malls that have Wal-marts for an anchor! I like the idea of getting in on a successful retail firm that has a geographic potential of expanding its base throughout the country. And that is at the same time, increasing sales through existing outlets as supported by the strong same-store sales figures. I got shaken-out with a single poor same-store sales report. However, the underlying story remained, and the company resumed strong sales reports.
The bottom line is that I like this stock a lot! Now, if only I had a 'permission slip' to be buying a new position! I just might revisit this sporting goods chain once more!
Thanks again for visiting! If you have any comments or questions, please feel free to drop me a line at bobsadviceforstocks@lycos.com or feel free to just leave a message on the blog. If you get a chance, come and listen to my Stock Picks Podcast where I discuss many of the stocks and strategies I write about here on the blog!
Have a great weekend everyone!
Bob
Posted by bobsadviceforstocks at 4:32 PM CST
|
Post Comment |
Permalink
Updated: Friday, 17 November 2006 4:37 PM CST
Thursday, 16 November 2006
What's This Blog All About?
"Hello Friends!" That's how I like to start all of my entries. Talking to all of you who I consider my friends and confidants. But perhaps I sometimes forget that I need to explain every once in awhile what all of these entries are about. Why did I write up these stocks? What is so special about them? And what is an investor supposed to do with all of these names?
Quite frankly, that really is up to you. And I would love to hear from some of you who use these posts to assist you in your portfolios. Have they helped? Did you make any money? Lose money? Or was what I write irrelevant to your particular strategy?
For me, these names that I come across would be what I would consider "quality" stocks. Quality can mean so many different things to so many people. I view a quality stock as the stock of a company that is able to consistently produce good financial results. O.K., what's "good" you ask. What I mean is that I believe that there exist out there in the financial world certain companies which will tend to outperform the market by their consistent growth in both revenue and earnings which will be rewarded by the "market" with an increasing stock price. These are the consistent winners. The fast horses at a horserace. Or the NASCAR drivers who seem to always be winning. These are the stocks I want to own.
I go through a rather boring process of examining stocks to isolate and identify these names. I really am an amateur so I don't claim any particular brilliance in this process. But I try extremely hard to be open and honest about why and how I do this. You certainly could also do the same. There isn't very much that I do that isn't easily copied.
So these stocks I discuss, as I have mentioned, become my "vocabulary" of investing. I want to put together these "words" into a "language" that becomes my trading portfolio. I am not sure which of the hundreds to actually own. But with a portfolio management system, I want to hang on to the strongest of my holdings and to part with the weakest.
Furthermore, I want to be able to respond to the market by either adding new positions or moving into cash. For this, I have chosen to listen to my own trading portfolio, sitting on my hands when I sell my weakest stocks on "bad news" by not re-investing the proceeds (unless I am at my minimum number of holdings), and adding a new positions when a stock of mine hits an appreciation target on the upside, at which time I sell a portion of that holding, and look to the market for another new position. (Of course, unless I am at my maximum size of my portfolio).
So as you read about the different stocks I talk about, I hope that you will learn to see them as I see them, as the companies among which I suspect we will find some of the top performing stocks of the entire market. I don't expect I will identify all of the best stocks or even a majority of them. I just want to find companies that overall will outperform a broad index of stocks. Just do a little better than average! I think I can do that!
If you have any questions about what I have been doing or writing about please drop me a line at bobsadviceforstocks@lycos.com. Also, I would certainly love to hear from those of you who have found my reviews helpful, who maybe even have purchased stocks in companies I have reviewed. Have you made profitable investments, or have you incurred losses. Have you utilized my trading strategy? Or have you modifed it in some undefined improvement? Would love to hear from you!
In the meantime, have a great evening and I look forward to the start of trading tomorrow.
Bob
Posted by bobsadviceforstocks at 4:52 PM CST
|
Post Comment |
Permalink
Updated: Thursday, 16 November 2006 4:57 PM CST
Newer | Latest | Older


