Stock Picks Bob's Advice
Saturday, 9 December 2006
Coach (COH) "Weekend Trading Portfolio Analysis"

Hello Friends! Thanks so much for stopping by and visiting my blog, Stock Picks Bob's Advice! As always, please remember that I am an amateur investor, so please remember to consult with your professional investment advisors prior to making any investment decisions based on information on this website.
Thank goodness for weekends! They give us all a chance to unwind a little and catch up with the things we put off all week long. Lord knows I have a huge list of things I need to be doing! On this blog, I have used the weekend to basically provide two types of discussions. First of all, I like to look back about a year (I am thinking of looking back three years now that I have had the blog up over that long!), and also review my actual holdings in my own trading portfolio.
I believe that both of these reviews are helpful. One, a theoretical look at stocks discussed here, and the second, a real review of my actual holdings in my own trading account. I do have other investments in managed accounts and also manage a couple of small accounts for my children. Whenever I discuss stocks I try very hard to remember to let you know whether I own any stocks or if any accounts that I have control over own those equities. I also have some retirement accounts that are managed independently of my own input. I do not always know or remember what stocks are owned in those accounts.
Currently, I own 11 stocks in my Trading Account. If you can recall my discussions elsewhere, I will own anywhere from 6 stocks (my minimum number) to 25 stocks (my maximum). I use the actual performance of my own holdings to determine whether I should be adding new positions (in the event of a partial sale on good news) or sitting on my hands, so to speak, in the even of a sale of a holding on bad news or poor stock price performance. I have been using this system for several years as my own trading barometer for investing.
About every two weeks, I have been trying to review one of my holdings, which would work to about once every 6 months with the current size of the portfolio. Two weeks ago, on November 25, 2006, I reviewed my holding of Wolverine Worldwide. Going alphabetically, I am back to the start of my list, and would like to share with you my most successful investment story of my portfolio, my purchase of Coach (COH).
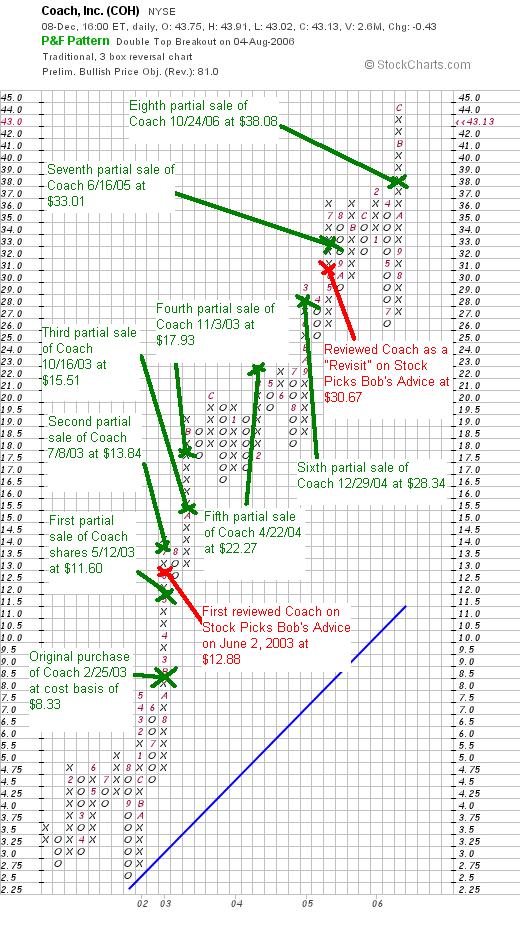
 Currently in my trading portfolio, I own 85 shares of Coach (COH) which were purchased February 25, 2003, at a cost basis of $8.33. COH closed at $43.13 on December 8, 2006, for an unrealized gain of $34.80 or 417% since my purchase.
I first discussed Coach on Stock Picks Bob's Advice only three weeks after I started the blog when the stock was trading at $51.53 on June 2, 2003. Adjusted for two subsequent 2:1 stock splits this works out to a "pick price" of $12.88. I "revisited" Coach on June 1, 2005 on Stock Picks when the stock was trading at $30.67.
As is my strategy with all of my purchases, I try to sell portions of my holdings, currently 1/6th of remaining shares at targeted appreciation points. I use appreciation levels of 30, 60, 90, and 120%, then 180, 240, 300, and 360%, (then by 90% intervals): 450, 540, 630, and 720% appreciation levels. I plan on continuing to increase intervals by 30% each group of four sales if I ever get there :). In any case, I have now sold portions of my Coach holding eight times! (Please review the chart below for details.)
With eight sales, when would my next sale happen? Having sold at 30, 60, 90, 120, 180, 240, 300, and 360%, my next sale would be at a gain of 450%, or calculated, works out to 5.50 x $8.33 = $45.82. At that point, I would be selling 1/6th of my 85 shares or 14 shares. On the downside, half of the top sale would be at a 180% gain or 2.80 x $8.33 = $23.32. If Coach declines to that level, I plan on selling all of my shares. With all of my partial sales have extracted my purchase price and more, I shall try to exercise the appropriate discipline and let the stock price determine my trading action!
Let's take another look at this stock and see if it still deserves a spot on this blog.
What does the company do?
According to the Yahoo "Profile" on Coach, the company
"...engages in the design and marketing of handbags and accessories in North America and internationally. Its primary product offerings include handbags; women’s and men’s accessories, such as money pieces, wristlets, cosmetic cases, key fobs, belts, electronic accessories, wallets, and other leather accessories; outerwear, gloves, hats, and scarves; men’s computer bags, messenger-style bags, and totes; and luggage and travel accessories. The company’s product offerings also comprise watches, footwear, and eyewear. Its products are sold through direct-to-consumer channels, including company-operated retail and factory stores in North America and Japan; and its online store and catalogs."
How did they do in the latest quarter?
On October 24, 2006, COH reported 1st quarter 2007 results. Net sales came in at $554 million, up from $449 million in the same quarter last year. Net income grew 34% to $126 million or $.34/share, up from $94 million or $.24/share. Analysts had been expecting $.31/share, and the company actually exceeded its own guidance of $.30/share. Comparable store sales in the United States grew at 21.4% inthe quarter. Comparable store sales in Japan grew at a "mid-single-digit" rate for the quarter. The company also raised guidance for the upcoming quarter to $.56 shares ahead of analysts' expectations of $.55. For fiscal year 2007, the company raised guidance to sales of $2.55 billion, and earnings per diluted share of at least $1.63. This is ahead of the analysts who apparently have been expecting $1.58 for 2007.
This really was a terrific report with solid same store sales reported, beating expectations AND raising guidance. This is what I would generally refer to as a "trifecta-plus"!
What about longer-term results?
If we look at the Morningstar.com "5-Yr Restated" financials on Coach, you can see a BEAUTIFUL picture which I believe explains the phenomenal performance of this stock. Revenue growth works out to $719 million in 2002, increasing steadily to $2.11 billion in 2006 and $2.22 billion in the trailing twelve months (TTM). Earnings have also steadily increased, and dramatically at that, from $.21/share in 2002 to $1.27/share in 2006 and $1.37/share in the TTM. No dividends are paid. The number of shares outstanding has been quite stable at 360 million in 2002 to 380 million in 2006. The company has been apparently buying back shares as Morningstar reports 367 million shares for the TTM.
Free cash flow has been positive and increasing with $286 million in 2004, increasing to $381 million in 2005, $463 million in 2006 and $474 million in the TTM.
The balance sheet, like the rest of the numbers on Coach from this page is also gorgeous. They have $456.3 million in cash and $567.1 million in other current assets. This is a total of $1023.4 million, which when compared to the current liabilities of $394.9 million yields a current ratio of 2.59. The long-term liabilities are a very modest $89.4 million per Morningstar.
What about some valuation numbers?
Looking at Yahoo "Key Statistics" we can see that this is a large cap stock with a market capitalization of $15.85 billion. The trailing p/e is a bit rich at 31.50, but the forward p/e (fye 01-Jul-08) is estimated at a much nicer 21.57. In fact, with the rapid growth in earnings, the PEG still comes in at a reasonable 1.19.
Reviewing the information from the Fidelity.com eresearch website, we find that the Price/Sales for Coach is indeed rich at 7.39 for the TTM, with an industry average of 2.59, placing Coach at the 97th percentile for "richness" in Price/Sales ratio.
Perhaps pertinently, in terms of profitability, Coach is very profitable with a return on equity (ROE) coming in at 40.05% with an industry average of 20.77%. This puts Coach at the 94th percentile for profitability.
Returning to Yahoo, we find that there are 367.48 million shares outstanding with 361.23 million that float. Currently there are 6.49 million shares out short, representing 1.8% of the float or a short ratio of 1.8 trading days. Not too many short-sellers appear willing to speculate against this company!
No dividend is paid, and as noted earlier, the last stock split was a 2:1 split on April 5, 2005.
What about the Chart?
Looking above, we can see the unbelievable strength in this stock ever since it corrected back in September, 2001, when the stock dipped to a split-adjusted price of $2.50/share. Since then the stock has been charging ahead without much of any sign of a correction. In fact, if anything, the stock is overextended, way above the support levels. However, as long as good news is not in short supply, there is no sign that the stock will be pulling back to lower levels imho.
Summary: What do I think?
In a word, this stock has been AMAZING. I believe this stock, and this company, represent the archetypical firm I am looking for. Aren't all of us looking for stocks like this? They have grown their revenue, their earnings, beat expectations and repeatedly raised guidance. WOW. Unfortunately, early on, I was selling 1/4 positions of my holdings and the size of my holding dropped a bit, but overall, I am pleased with my sales which have allowed me to grow my portfolio with other positions.
Thanks so much for stopping by and visiting! If you have any comments or questions, please feel free to leave them on the blog or email me at bobsadviceforstocks@lycos.com. If you get a chance, drop by and visit my Stock Picks Podcast Site. Have a great rest of the weekend!
Bob
"Looking Back One Year" A review of stock picks from the week of August 8, 2005

Hello Friends! Thanks so much for stopping by and visiting my blog, Stock Picks Bob's Advice! As always, please remember that I am an amateur investor, so please remember to consult with your professional investment advisors prior to making any investment decisions based on information on this website.
One of the things I try to do around here is to continue to examine past stock "picks" and selections and see how they turned out. There isn't anything magic about my selection process. These analyses assume a "buy and hold" strategy to investments. In practice I employ, and advocate, a disciplined portfolio management strategy that requires sales of stocks that decline to pre-determined levels as well as partial sales of stocks as they appreciate and reach pre-determined price targets. My goal is always to avoid large losses and preserve large gains as much as possible.
To help us get a better handle on what happened after stocks have been selected, I am starting to post "point & figure" charts from StockCharts.com with these reviews to let you see what I did and when and what happened later. I hope that you find these charts helpful!
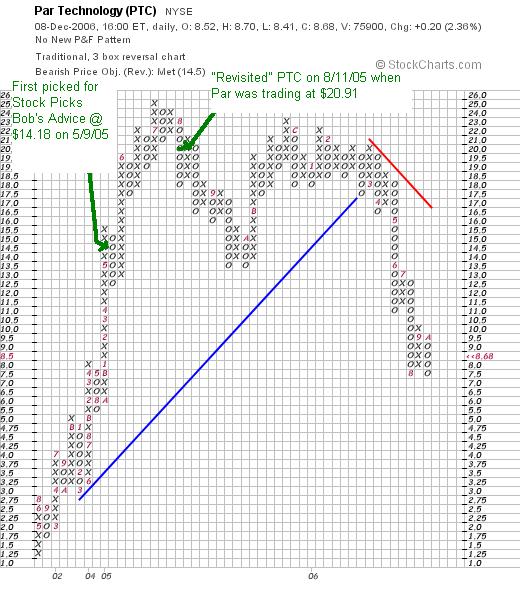
 On August 11, 2005, I "revisited" Par Technology (PTC) on Stock Picks Bob's Advice when the stock was trading at $31.36. This was a repeat post for Par which was first reviewed on this blog on May 9, 2005, when it was trading at $22.17. Par had a 3:2 stock split on January 9, 2006, making my August, 2005, stock pick price effectively $20.91 (and my May, 2005 "pick" effectively $14.78). Par closed at $8.68 on December 8, 2006, giving my August selection a loss of $(12.23) or (58.5)%. (This particular pick shows the potential of loss of any and all stocks selected on this blog!)
Looking at the stock chart below, we can see how the chart appeared to break down in March, 2006, when the stock price broke through apparent support at the $17 level.
 On October 26, 2006, Par (PTC) reported 3rd quarter 2006 results. For the quarter ended September 30, 2006, the company reported revenues of $48.5 million down 7% from revenues of $52.2 million in the same quarter in 2005. Net income came in at $550,000, down over 75% from the $2.5 million reported the same quarter last year. Similarly, diluted earnings per share came in at $.04 during the quarter, down sharply from $.17/share last year.
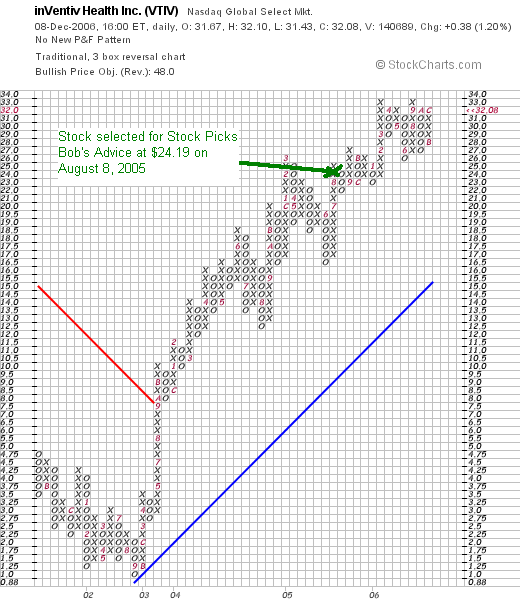
 On August 8, 2005, I posted Ventiv Health (VTIV) (which subsequently in June, 2006, changed its name to inVentiv Health (VTIV)) at a price of $24.19. VTIV closed at $32.08 on December 8, 2006, for a gain of $7.89 or 32.6% since posting.
On November 7, 2006, inVentiv (VTIV) reported 3rd quarter 2006 results. Total revenues increased 54% to $197.8 million in the quarter compared with $128.4 million in the same quarter in 2005. While GAAP earnings actually declined to $.34/share from $.53/share, $.24/share in 2005 were for a $6.7 million tax benefit which would have worked out to $.30/share in 2005. Since I generally go with GAAP earnings without looking at all of the one-time items, etc., I gave this stock a 'thumbs-down', but looking harder at the numbers produces a more-encouraging picture and the "street" was not bothered by this report.
In addition, in another bullish note the company raised guidance for 2006 from $705-$725 million to $735-$745 million and adjusted earnings per share guidance for 2006 from $1.46-$1.48 to $1.46-$1.50. They also provided initial revenue guidance for 2007 of $830-$850 million, and initial 2007 eps guidance of $1.70 to $1.80.
All-in-all, a much nicer picture at VTIV than PTC!
So how did I do with these two stock picks? Well, due to the large decline in the PTC stock, the average performance of these two picks works out to a loss of (13.0)%. This emphasizes the importance of limiting losses to small amounts and allowing gains to grow! As I noted above, my "performance" on these reviews is always a "buy and hold" strategy that is not what I actually advocate or practice.
Thanks so much for stopping by and visiting! I hope you enjoyed my inclusion of stock charts noting my own "calls" on the stocks! If you have any comments or questions, please feel free to leave them on the blog or email me at bobsadviceforstocks@lycos.com. If you get a chance, stop by and visit my Stock Picks Podcast Site, where I discuss many of the same stocks and strategies that I write about here on the blog.
Bob
"Looking Back One Year" A review of stock picks from the week of August 1, 2005
Hello Friends! Thanks so much for visiting my blog, Stock Picks Bob's Advice! As always, please remember that I am an amateur investor, so please remember to consult with your professional investment advisors prior to making any investment decisions based on information on this website.
Usually I am doing a review in this space. However, on this particular week, as occasionally is the case, I did not review or pick any stocks to discuss. Thus, I shall not be "looking back" at that week, but shall, if I get a chance, advance to the following week, as I am a bit behind :) in this year ago review process as has been pointed out to me :) several times!
Thanks so much for stopping by! If you have any questions or comments, please feel free to leave them on the blog or email me at bobsadviceforstocks@lycos.com.
Bob
Friday, 8 December 2006
Bolt Technology (BTJ) "Revisiting a Stock Pick"
Hello Friends! Thanks so much for stopping by and visiting my blog, Stock Picks Bob's Advice! As always, please remember that I am an amateur investor, so please remember to consult with your professional investment advisors prior to making any investment decisions based on information on this website.

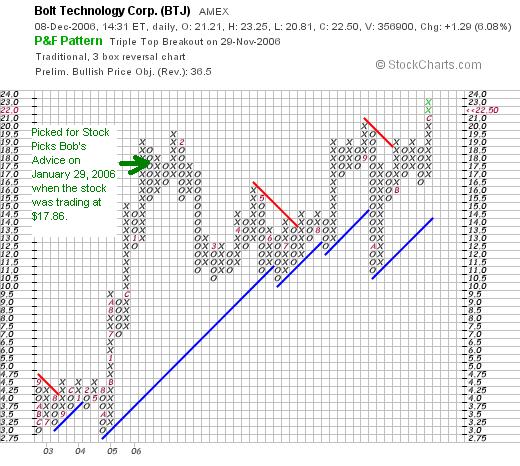
I was looking through the list of top % gainers on the AMEX today and came across an old 'favorite' of mine, Bolt Technology (BTJ), which I first reviewed on Stock Picks Bob's Advice on January 19, 2006, when the stock was trading at $17.86. As I write, Bolt is trading at $22.81, up $1.60 or 7.54% on the day. The stock is currently higher by $4.95 or 27.7% since I posted the stock here a little under a year ago. I do not own any shares of Bolt nor do I own any options on the stock.
What does this company do?
According to the Yahoo "Profile" on Bolt, the company
 "...through its subsidiaries, engages in the development, manufacture, and sale of seismic energy sources used in the seismic exploration for oil and gas worldwide. The company operates in two segments, Geophysical Equipment and Industrial Products. The Geophysical Equipment segment offers marine seismic energy sources and underwater electrical connectors and cables, seismic source monitoring systems, air gun signature hydrophones, and pressure transducers used by the marine seismic industry. The company’s Industrial Products segment offers miniature industrial clutches, brakes, and sub-fractional horsepower electric motors."
How did they do in the latest quarter?
On October 24, 2006, BTJ announced 1st quarter fiscal 2007 results. Sales for the quarter ended September 30, 2006, climbed 25% to $10.0 million, up from $8.0 million in the same period last year. Net income grew 96% to $2.0 million or $.35/share, up from $1.02 million or $.18/share in the year earlier same period.
What about longer-term results?
Reviewing the Morningstar.com "5-Yr Restated" financials, we can see that the company did have a drop in revenue from $18 million in 2002 to $11 million in 2003. However, since then Bolt has been growing its revenue steadily to $19 million in 2005 and $33 million in 2006. Similarly, earnings dropped from $.35/share in 2002 to a loss of $(.03)/share in 2003. However, the company was once again profitable in 2004 at $.16/share, and has grown earnings strongly since with $.30/share reported in 2005 and $.86/share in 2006. The number of shares outstanding has been fairly stable (and small) with 5 million in 2002, 5 million in 2006, and 6 million in the trailing twelve months (TTM). No dividend is reported.
Free cash flow, while small, has been positive at $1 million in 2004 and $1 million in the TTM.
The balance sheet looks solid to me with $4.6 million in cash and $16.3 million in other current assets, giving us a total of $20.9 million in current assets, which easily covers botht the $5.8 million in current liabilities and the small $.4 million in long-term debt. Dividing this out yields a current ratio of 3.6.
What about some valuation numbers?
Reviewing Yahoo "Key Statistics" on Bolt (BTJ) we see that this is a small "small cap" company with a market capitalization of only $125.38 million. The trailing p/e is a reasonable (imho) 21.74. No PEG is reported, but if the current growth in earnings were to continue, the PEG would certainly be well under 1.0.
Checking the Fidelity.com eresearch website, we can see that the Price/Sales (TTM) ratio works out to 3.39 with an industry average of 3.42. The Return on Equity (ROE) is reported at 21.15%, slightly below the industry average of 29.93% per Fidelity.
Finishing up with Yahoo, we can see that there are only 5.59 million shares outstanding and 5.13 million that float. As of 11/10/06, there were only 54,890 shares out short, representing 1.10% of the float or 0.5 trading days of volume....not a very significant short interest at all.
As noted, no stock dividends are reported, and Yahoo does not report any stock splits either.
What about the chart?
If we look at a "Point & Figure" chart from Stockcharts.com on BTJ, we can see that the stock, which was trading around $2.75 to $4.50 between much of 2002 to 2004, moved sharply higher late in 2004 and into early 2006 to the $19.00 range. More recently, the stock once again appears to be moving higher into new territory. The chart looks interesting to me!
Summary: What do I think about the stock?
Well, if I didn't like it I wouldn't be writing it up again :). Seriously, the stock looks interesting. It is a tiny company that is dependent on the oil service industry but unless the entire oil market collapses, it appears this company may well be a good performer. Valuation isn't bad, and the Morningstar.com report is attractive. If I were in the market to be buying a stock, this is the kind of stock I would be buying today!
Thanks so much for stopping by and visiting! If you have any comments or questions, please feel free to leave them on the blog or email me at bobsadviceforstocks@lycos.com. Also, when you get a chance, drop by and visit my Stock Picks Podcast Site, where I discuss many of the same stocks I have written about on the blog.
Bob
Wednesday, 6 December 2006
Davita (DVA) "Revisiting a Stock Pick"
Hello Friends! Thanks so much for stopping by and visiting my blog, Stock Picks Bob's Advice! As always, please remember that I am an amateur investor, so please remember to consult with your professional investment advisors prior to making any investment decisions based on information on this website.
 This evening, while reviewing the list of top % gainers on the NYSE, I saw that Davita (DVA), a stock that I have evaluated previously, and have actually owned as well, made the list. DVA closed at $55.47, up $1.70, or 3.16% in an otherwise anemic market.
I say this is a "revisit" because I first posted Davita on Stock Picks Bob's Advice on December 6, 2004, when the stock was trading at $36.42. With today's close at $55.47, this represents a gain of $19.05 or 52.3% over the last two years with that stock.
I was actually not quite as lucky with my own actual purchase of Davita. I purchased shares in my trading account on 12/6/04, the same day I posted the pick, at a price of $36.29. I sold those shares 3/7/05 at $42.29, after reading about some questions about accounting. Clearly, I had gotten shaken out on what turned out to be less than significant news. Perhaps if I had thought less instead of more, and had responded to the stock price instead of my own assessment of the news, I would still be owning shares of this company.
Let's take another look at Davita, and I will try to show you why it still deserves a spot on this blog.
First of all, let's review what the company does.
According to the Yahoo "Profile" on Davita, the company
"...provides dialysis services in the United States for patients suffering from chronic kidney failure, which is also known as end stage renal disease (ESRD). The company operates kidney dialysis centers, and provides related medical services primarily in dialysis centers and in contracted hospitals."
And the latest quarterly report?
On November 1, 2006, Davita reported 3rd quarter 2006 results. Net operating revenue climbed sharply from $644.9 million to $1.24 billion from the same quarter in 2005 to the current quarter a year later. Net income was also up sharply from $55.2 million in 2005 to $94.9 million this year. On a fully diluted per share basis this worked out to $.90/share this year vs. $.53/share last year. Taking out a one time gain, this still was $.66/share, up from $.53/share last year. Analysts had been looking for $.64/share on $1.22 billion of revenue. Thus, the company beat expectations both on the earnings and revenue side. In addition, the company raised guidance for the lower end of its 2006 operating income forecast.
Looking longer-term at a "5-Yr Restated" Morningstar.com financials report, we can see the steady increase in revenue from $1.57 billion in 2001 to $2.97 billion in 2005 and $4.74 billion in the trailing twelve months (TTM).
Earnings have also steadily grown from $.95/share in 2001 to $1.99/share in 2005 and $2.58/share in the TTM. Free cash flow has been solidly positive with $193 million in 2003, $324 million in 2005 and $268 million in the TTM. The number of shares outstanding has been relatively constant with 95 million shares in 2003, increasing to 101 million in 2005 and 104 million in the TTM.
The balance sheet appears adequate with $260.3 million in cash and $1.35 billion in other current assets. When divided by the current liabilities of $1.01 billion, this gives us a current ratio of 1.60. The company is also reported to have a significant long-term liability level of $4.19 billion. However, with the growing free cash flow, this doesn't appear to be a significant problem for DVA.
How about some valuation numbers for Davita?
Looking at Yahoo "Key Statistics", we can see that this is a small large-cap stock with a market capitalization of $5.77 billion. The trailing p/e is a relatively reasonable 20.91, with a forward (fye 31-Dec-07) p/e of 17.72. Thus, with the rapid growth in earnings expected (5 yr), the PEG works out to a nice 1.07.
Per the Fidelity.com eresearch website, the Price/Sales for Davita is 1.13, just above the average of 0.97 for its industry. Looking at profitability as measured by Return on Equity (ROE), DVA comes in at 27.14% for the TTM, compared with an industry average of 15.06%. Thus, the company appears reasonably valued as measured by PEG and Price/Sales, and is more profitable than an average company in its group.
Finishing up with Yahoo, we find that there are 104 million shares outstanding with 103.8 million that float. Currently, as of 11/10/06, there were 1.39 million shares out short, representing 1.30% of the float or only 2 trading days of volume. (I use a three day level of short interest as significant).
The company does not pay a dividend, and the last stock split was a 3:2 split on June 16, 2004.
What does the chart look like?
Reviewing the StockCharts.com "Point & Figure" chart on Davita, we can see that the stock, which was trading sideways through much of 2002 and early 2003 in the $13 to $17 range, broke out in June, 2003, and moved fairly steadily higher to the current $55 level.
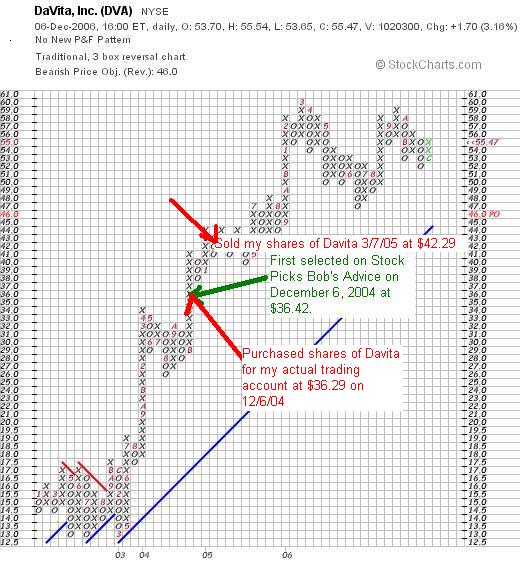
You can see this price activity nicely on this chart including my "pick" price, as well as my own purchase of shares and ultimately getting 'shaken-out' and selling before the stock had broken down in price. This is my point about not 'thinking' too much about news and letting the stock price dictate the response.
So what do I think?
Well, the stock had a terrific quarter and moved nicely higher today in an otherwise lackluster trading day. The last quarter was great with the company increasing sales and earnings, beating guidance, and raising expectations. Longer-term the Morningstar.com report appears solid with a nice steady increase in revenue, earnings, and free cash flow. The balance sheet appears solid and valuation appears reasonable.
However, I am not quite in the market to be buying a new position. But this company does deserve a place at the table, so to speak, as it continues to manifest strong financial results which are driving the stock price higher.
Thanks again for dropping by. If you have any comments or questions, please feel free to leave them on the blog or email me at bobsadviceforstocks@lycos.com. Also, if you get a chance, be sure and visit my Stock Picks Podcast Site, where I discuss many of the same stocks I blog about right here.
Bob
Sunday, 3 December 2006
Hello Friends! Thanks so much for stopping by and visiting my blog, Stock Picks Bob's Advice! As always, please remember that I am an amateur investor, so please remember to consult with your professional investment advisors prior to making any investment decisions based on information on this website.
As I like to do on weekends, this is a review of past stock picks from a little more than a year ago. Why more than a year? Actually, I started out with a yearly review advancing a week at a time....but I have missed a few weeks along the way. And thus, here we are!
This review assumes a buy and hold strategy that assumes an equal dollar purchase of stocks during the week reviewed. In practice, I employ and advocate a disciplined portfolio management system that practices quick sales of declining stocks and partial sales of gaining stocks at targeted appreciation points. This difference in strategy would certainly affect performance over time.
 On July 25, 2005, I posted Diagnostic Products (DP) on Stock Picks Bob's Advice when it was trading at $56.05. On September 5, 2006, Siemens announced that it had completed the acquisition of Diagnostic Products Corporation for $58.50/share. Thus, this stock pick would have appreciated $2.45 or 4.4% since posting.
 On July 27, 2005, I picked Anteon Intl (ANT) fgor Stock Picks Bob's Advice when it was trading at $47.86/share. Anteon was acquired by General Dynamics for $55.50/share in June, 2006, for an effective gain on the stock pick of $7.64 or 16.0% since being "picked" on the blog.
 On July 28, 2005, I posted Advanced Neuromodulation Systems (ANSI) on Stock Picks Bob's Advice when it was trading at $48.40/share. ANSI was acquired by St Jude Medical for $61.25/share resulting in an effective appreciation of $12.85 or 26.5% since posting.
 Finally, on July 29, 2005, I posted Middleby Corporation (MIDD) on Stock Picks Bob's Advice when the stock was trading at $69.86/share. MIDD closed at $100.70 on December 1, 2006, for a gain of $30.84 or 44.1% since posting.
Here is the chart showing my selection point.
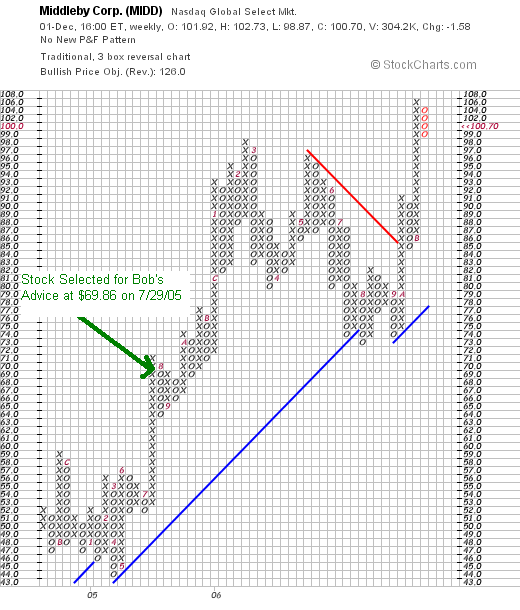
You can note the outstanding price move after the stock was selected on the blog! Unfortunately, I didn't and I still don't own any shares of this stock.
 On November 6, 2006, Middleby announced 3rd quarter 2006 results. Net sales for the quarter rose 27.6% for the quarter, coming in at $103,239,000, up from $80,937,000 in the same quarter last year. Net income rose to $12.2 million or $1.48/share, up from $9.6 million or $1.19/share last year during the same period. The company exceeded estimates of $1.28/share for the quarter.
So how did I do doing that week a bit over a year ago? Fabulous! I don't think I have ever posted four stocks only to find that three of them were acquired a year later! Overall, the average performance for the four stocks worked out to a gain of 22.75%!
Thanks so much for stopping by and visiting. If you have any comments or questions, please feel free to leave them on the blog or email me at bobsadviceforstocks@lycos.com. If you get a chance, drop by my Stock Picks Podcast site where I have been discussing a few of the many stocks that I write about on the blog!
Bob
Posted by bobsadviceforstocks at 11:45 AM CST
|
Post Comment |
Permalink
Updated: Sunday, 3 December 2006 12:00 PM CST
Thursday, 30 November 2006
Medifast (MED)
Hello Friends! Thanks so much for stopping by and visiting my blog, Stock Picks Bob's Advice! As always, please remember that I am an amateur investor, so please remember to consult with your professional investment advisors prior to making any investment decisions based on information on this website.
 I was going through the list of top % gainers on the NYSE today and came across a name which I have noticed showing up on this list more than once: Medifast (MED). I do not own any shares nor do I have any options on this stock.
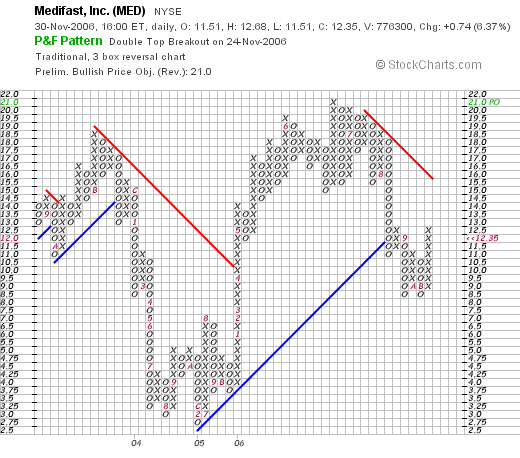
As I write, Medifast is trading at $12.35, up $.74 or 6.37% on the day. Let's take a brief look at this stock and I will share with you my thinking about why it deserves to be on this blog.
According to the Yahoo "Profile" on MED, the company "...through its subsidiaries, engages in the production, distribution, and sale of weight and disease management products, and other consumable health and diet products in the United States. Its products also include meal replacement and sports nutrition products."
Medifast announced 3rd quarter 2006 results on November 14, 2006. For the quarter ended september 30, 2006, they had revenue of $19.6 million, a 79% increase over the $11 million reported in the same quarter the prior year. Net income came in at $1.5 million or $.11/diluted share, vs. $607,000 or $.05/diluted share the prior year. The company announced guidance for full year 2006 at $70-$72 million in revenue and $.38 to $.40/share. This stock has at least one analyst who had forecast $.09/share on $17 million in revenue. The company beat these expectations handily.
 Looking longer-term at the Morningstar.com "5-Yr Restated" financials on MED, we can see the nice picture of steady revenue growth, with $5 million in revenue in 2001, growing to $40 million in 2005 and $60 million in the trailing twelve months (TTM).
Earnings during this period have been a little less consistent with $.07/share in 2001, increasing to $.30/share in 2002, dropping to $.14/share in 2004, and increasing since then to $.19/share in 2005 and $.32/share in the TTM.
The company has been increasing its shares outstanding with 9 million in 2003, increasing to 12 million in 2005 and 14 million in the TTM.
Free cash flow has been small but improving with $(1) million in 2003, $-0- in 2004, $2 million in 2005 and $2 million in the TTM.
The balance sheet, per Morningstar.com, appears solid with $5.3 million in cash and $11.4 million in other current assets. This total of $16.7 million, when compared to a $4.6 million in current liabilities, yields a current ratio of over 3.0. The company has enough current assets to pay off their current liabilities of $4.6 milllion AND their long-term liabilities of $3.7 million combined.
Looking at Yahoo "Key Statistics" for some valuation numbers on Medifast, we can see that this is a small cap stock with a market capitalization of only $167.82 million. The trailing p/e is a tad rich at 30.67, with a forward p/e estimated (fye 31-Dec-07) at 22.53. Thus, with the rapid growth in earnings expected, the 5 yr expected PEG works out to a reasonable 1.49.
According to the Fidelity.com eresearch website, MED has a Price/Sales (TTM) of 2.48, compared to an industry average of 1.94, putting it at the 78th percentile in its industrial group.
Their Return on Equity (ROE) (ttm), is at 19.92% which is below the industry average of 31.24%, but still puts it near the top of its group at the 74th percentile.
Returning to Yahoo, we find that there are only 13.55 million shares outstanding and 11.17 million that float. As of 11/10/06, there were 1.06 million shares out short, representing 9.9% of the float or 4.1 trading days of volume. This short interest was down from the prior month, but with the strong earnings report out this month, the appreciation in the stock price might be contributed to by the covering of the short positions of the short-sellers.
No dividend is paid, and no stock split was reported on Yahoo.
Reviewing a "Point & Figure" chart on Medifast from StockCharts.com, we can see that this is a very volatile stock which reached a high of $18 in November, 2003, only to fall back to $2.75/share in February, 2005. The stock rebounded to a new high of $21 in June, 2006, and then recently pulled way back to the $8.50 level which it bounced off of twice in September and November, 2006. The stock is once again moving higher, but if we are to use the "resistance" lines on the chart, I would like to see the stock trading above $15 to feel comfortable that it is once again technically looking good.
This is a very small company which is trading in a very volatile fashion. The latest quarterly report was quite strong and actually the company has been growing nicely the past several years. Valuation appears fairly reasonable for the fast growth that this company has been reporting. And technically, the chart looks volatile but not over-extended. A little small and a little speculative, but then again, that adds a little interest to this blog and it might fill a spot in somebody's portfolio. I just am not in a position to be adding any stocks to my own holdings!
Thanks so much for stopping by and visiting. Please feel free to drop me a line at bobsadviceforstocks@lycos.com if you have any comments or questions or just leave them right on the blog. Also, if you get a chance, be sure and visit my Stock Picks Podcast Site, where I also talk about some of the stocks I write up.
Bob
Dress Barn (DBRN)
CLICK HERE FOR MY PODCAST ON THIS ENTRY!
Hello Friends! Thanks so much for stopping by and visiting my blog, Stock Picks Bob's Advice! As always, please remember that I am an amateur investor, so please remember to consult with your professional investment advisors prior to making any investment decisions based on information on this website.
 O.K., I was going to call it a night and get some sleep but there was something that I had been intending to get around to all afternoon and just hadn't. And that was writing a bit about Dress Barn (DBRN), a stock that I don't own any shares or options in, but a stock which made a great move today in a great trading environment.
According to the Yahoo "Profile" on DBRN, the company "...and its subsidiaries operate a chain of women's apparel specialty stores in the United States. It offers casual fashion apparel and sportswear, dresses, suits, special occasion clothing, jewelry, hosiery, handbags, and shoes. The company sells its products under the brands ‘dressbarn’ and ‘maurices’. As of July 29, 2006, it operated 1,339 stores in 48 states and the District of Columbia, consisting of 575 combo stores, 173 dressbarn stores, 45 dressbarn woman stores, and 546 maurices stores."
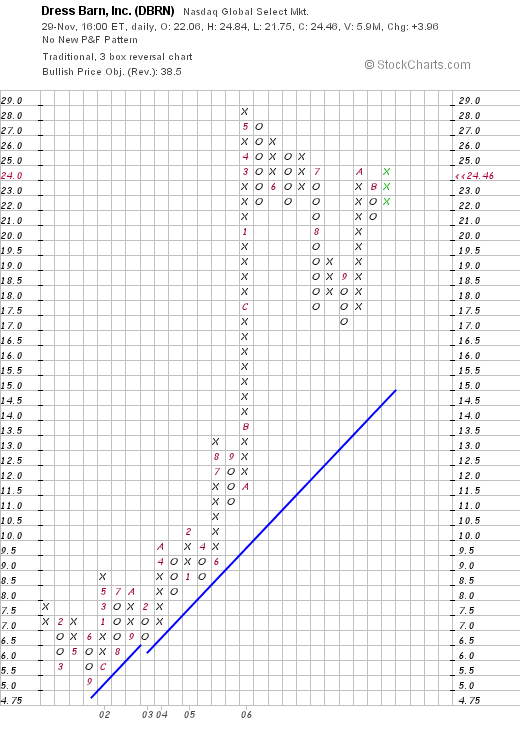
It is late, so I don't want to write up a real detailed review, but let me get to the facts and you can do some more research if you like what your read. First of all, I came across DBRN because it hit the list of top % gainers on the NASDAQ, my first place to look for names. DBRN closed at $24.46, up $3.96 or 19.32% on the day.
 As is frequently the case, what drove the stock higher today was an earnings announcement. In particular, the company, after the close of trading yesterday, announced results for the 1st quarter 2007, ended October 28, 2006. Here's the low-down on the report: net sales increased 12% to $358.4 million compared with last year's $318.9 million. Comparable store sales, the so-called "same-store sales" results showed a solid increase of 7%. Net earnings climbed 35% to $27.4 million or $.40/diluted share, up from $20.4 million or $.32/diluted share in the same period last year.
As part of what I call an outstanding earnings report, the company raised guidance for the full year 2007 to $1.30 to $1.35, from prior company guidance of $1.25 to $1.30. The company also suggested that comparable store sales would show growth at a rate of 4%. Going along with this picture, the company also announced after the close yesterday that the November sales for the company grew 9% overall with comparable sales for the month increasing by 4%.
Another part of a solid earnings report is to consider what the expectations were for earnings and whether a company failed to meet, met, or exceeded those expectations. As would be expected, companies that beat expectations often see a rather strong upward move in their stock prices. In this case, while DBRN reported quarterly earnings of $.40/share, analysts at Thomson First Call were expecting $.37/share. And revenue, which came in at $358.4 milion, exceeded expectations as well of $352 million. So this quarterly report, did what I call a "trifecta-plus", a term which I have been using to describe a report in which the company grows revenue, increases earnings, beats expectations AND raises guidance! There isn't much more a company could do...except maybe raise their dividend or announce a stock buy-back....which would also add excitement to an investment!
Let me also go ahead and share with you some of the facts reported on the Morningstar.com "5-Yr Restated" financials on Dress Barn. Revenue, which did drop from $717 million in 2002 to $707 million in 2003, has since been increasing steadily to $1,000 million in 2005 and $1,300 million in 2006. Earnings, which also dropped from $.49/share in 2002 to $.11/share in 2003, turned back around and increased to $.51/share in 2004, and up to $1.15/share in 2006. The company does not pay a dividend. But an interesting point on the Morningstar.com page, is that the number of shares has been decreasing from 72 million in 2002 to 62 million in the trailing twelve months (TTM).
Free cash flow has been positive and increasing the past few years with $58 million in 2004, $106 million in 2005, and $164 million in 2006.
The balance sheet looks solid on Morningstar with $152.9 million in cash and $196.5 million in other current assets reported. This total of $349.4 million in current assets, easily covers the $227.5 million in current liabilities. When calculated, the current ratio works out to a healthy 1.54. The company has an additional $210.2 million in long-term liabilities, which, with the growing free cash flow, does not appear to be a significant burden.
Taking a look at Yahoo "Key Statistics" on DBRN, we find that this is a mid-cap stock with a market capitalization of $1.51 billion. The trailing p/e is a reasonable 21.29 (imho), with a forward (fye 29-Jul-08) p/e of 16.53. The PEG (5 yr expected) comes in at a very nice .98. (Generally PEG ratios between 1.0 and 1.5 are reasonable imho.) I just realized that my Fidelity.com eresearch website has changed its reporting somewhat, so now we can see that the Price/Sales is at 0.92, below the industry average of 1.03. The company has a Return on Equity (ROE) of 21.18%, slightly below the average of 22.87%, but at the 78th percentile for its industry. Thus, valuation is reasonable while profitability is relatively high for its group.
Returning to Yahoo, we find that there are 61.78 million shares outstanding with 45.76 million that float. Of these, there were 4.16 million shares out short as of 11/10/06, giving the company a "short ratio" of 5.7 days. This is greater than my cut-off of 3 days for significance, and may be fueling the price rise today on the back of positive news.
No dividends are paid, and the company last split with a 2:1 in April of 2006.
Looking at the "Point & Figure" chart on Dress Barn from StockCharts.com, we see what appears to me to be a beautiful graphy, with the company bottoming at $5.00/share in September, 2001, only to start moving higher, to a recent high of $28 in May, 2006. The company pulled back recently to $17 in September, 2006, only to resume its ascent topped off by its strong move higher today to the $24.44 level.
So what do I think of this stock? Well, I like it. In fact, if I were in the market to be buying some shares, I probably wouldn't hesitate to add this one to my portfolio. Let me explain. The company made a nice move higher today, likely with short-sellers scrambline to cover. They did this on the back of a strong earnings report which beat expectations. The company also announced raised guidance for the rest of the year. This is what I like to see in a stock!
The Morningstar.com report is quite impressive with a steady growth in both revenue and earnings the past four years. In addition, the company has even been buying back shares, increasing free cash flow, and sports a solid balance sheet. Valuation appears reasonable with a PEG under 1.0, a Price/Sales relatively low and a ROE relatively high. Finally, the chart shows almost uninterrupted price appreciation since 2001. The company has been a bit volatile recently, but the numbers really look nice on this one.
Anyhow, I guess I can get to sleep now! I just wanted to write this up before I crashed for the night! Thanks so much for stopping by and visiting! If you have any comments or questions, of course please feel free to leave them on the blog or email me at bobsadviceforstocks@lycos.com. Also, be sure and visit my Stock Picks Podcast Site where I talk about lots of the stocks I write about here on the blog.
Bob
Posted by bobsadviceforstocks at 12:11 AM CST
|
Post Comment |
Permalink
Updated: Saturday, 9 December 2006 6:13 PM CST
Sunday, 26 November 2006
Good-bye Dave Johnson!
 Blogging can be a lonely business. Bloggers sit before their keyboards and write and formulate ideas and communicate into cyberspace. We get consolation looking at our Sitemeters knowing that someone has stopped by and hope that they have enjoyed their visits. We enjoy linking to each others blog, creating a network that allows visitors to travel across the internet, blog-hopping almost as easily as the bar-hopper on Saturday night. And we find it sad when one of our own hangs it up for personal, family, or business reasons. This is the case with Dayve Johnson on the Markets. Last week Dave Johnson, the actual spelling of his name, called it quits. As Dave wrote:
"Over the past few months I have been mulling over the thought of discontinuing posts to this blog. It has been something that once I started blogging it was a difficult decision to stop because deep inside I had a true joy in posting my ramblings, thoughts, and trades. But it has also become a burden, somewhat of a drudgery in the necessity to say something. Each and every night I would go through the process and each successive night it was becoming less of a joy.
So today I am done. The thing I really enjoyed most about the blog was the interaction between readers- their questions and comments generally made me have to think of the blog from the perspective of the reader. This was not always easy because I know at times I was not always clear and concise in my postings. This mostly stems from my poor ability to relate my thoughts into the blog posts.
One of the conflicts that I had to resolve ultimately was the fact I love to travel. Being away forced me to have to post a pick each day regardless of where I was. I hated that. Certainly that's one of the downfalls of trying to post a daily trackable trading log that would have some credence in the end. It's hard enough just finding a dog sitter for the darn dog when were away."
Well thank you Dave for your efforts! There is a fabric of inter-connectedness on the internet, and when one blogger calls it quits, one can feel the ripple in far distant places. I am sure that you have also touched your readers and that many will miss your posts. I certainly appreciated your link to my blog and feel your angst over hanging it up!
But the nice thing about blogging, is that you can quit, and you can restart again! And I hope that you find the time to do the things with your family, take care of your travels, and consider jumping back in to the blogosphere once again in the future!
Meanwhile, stop by once in a while and let us all know how you are doing!
Bob
Saturday, 25 November 2006
Wolverine Worldwide (WWW) "Weekend Trading Portfolio Analysis"
Hello Friends! Thanks so much for stopping by and visiting my blog, Stock Picks Bob's Advice! As always, please remember that I am an amateur investor, so please remember to consult with your professional investment advisors prior to making any investment decisions based on information on this website.
One of the things I have been trying hard to do on this blog, is to keep you informed of my actual holdings and the transactions that I make with the stocks that I really own. I do this in addition to the running commentary on what I call my "vocabulary" of investing....the discussion of the many stocks that I consider "investable". My updating you as frequently as possible, I try very hard to maintain as close to absolute 'transparency' as I can. This allows you to see what I am doing with my own stocks as well as allows you to hear about other stocks that I find attractive but have not owned...but might own in the future!
A couple of years ago, I started reviewing my "trading portfolio" stocks on a regular basis here on the blog. I stopped updating the link to my trading portfolio some time back as all of the housework started catching up with me and I found it absolutely unrealistic to do all of this manually by myself. But I continue to run through my holdings, trying to review a stock I actually own, about twice/month. Two weeks ago I reviewed my Ventana holding on Stock Picks. This evening, I would like to take another look at Wolverine Worldwide (WWW), a relatively recent acquisition for me.
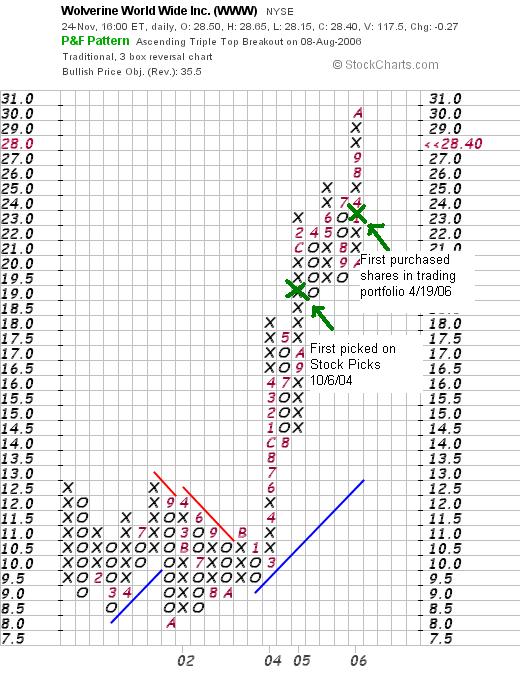
 I first reviewed Wolverine Worldwide (WWW) on Stock Picks Bob's Advice on October 6, 2004, when it was trading at $28.90. WWW had a 3:2 stock split on February 2, 2005, making my effective stock pick price actually $19.27. WWW closed at $28.40 on November 24, 2006, for a gain of $9.13 or 47.4% since it was picked on the blog.
 I purchased 240 shares of WWW in my actual trading portfolio on April 19, 2006, with a cost basis of $23.55/share. With Friday's closing price of $28.40, this represents an unrealized gain of $4.85 or 20.6% since purchase. I have not sold any of my original purchase. According to my plan of selling 1/6th of my shares at a 30% gain, if the stock reaces 1.30 x $23.55 = $30.62, then I would plan on selling 40 shares and this would give me the "permission" to add a new position to my trading portfolio. On the other hand, since I have not sold any shares, if the stock would fall to an (8)% loss, or .92 x $23.55 = $21.67, then I would plan on selling all of my holding at that time.
Let's take another look at this stock and see if it still deserves a place on this blog!
1. What does this company do?
According to the Yahoo "Profile" on WWW, the company
"... engages in the design, manufacture, and marketing of a line of casual shoes, rugged outdoor and work footwear, and constructed slippers and moccasins primarily in the United States. It offers work, outdoor, uniform, and lifestyle boots and shoes; performance and lifestyle footwear; and comfortable casual, dress footwear, and slippers through its Wolverine Footwear Group, Outdoor Group, Heritage Brands Group, and Hush Puppies Company. The company provides its products under various brand names, including Bates, CAT, Harley-Davidson, Hush Puppies, HyTest, Merrell, Sebago, Stanley, and Wolverine."
2. How did Wolverine do in the latest reported quarter?
On October 4, 2006, Wolverine announced 3rd quarter 2006 results. Revenue for the quarter came in at $298.9 million, a 7.1% increase over the $279.1 million reported in the same quarter the prior year. Earnings per share were up 9.5% to $.46/share, up from $.42/share the prior year. The company also raised guidance for 2006 to $1.41 to $1.44/share, from prior guidance of $1.38 to $1.42. WWW left revenue estimates for the year unchanged. This result exceeded expectations of $.44/share, although revenue was in line with the estimated $299 million.
3. How about longer-term results?
Reviewing the Morningstar.com "5-Yr Restated" financials on Wolverine Worldwide (WWW), we can see a pretty picture of steady revenue growth from $720 million in 2001 to $1.06 billion in 2005 and $1.1 billion in the trailing twelve months (TTM).
Earnings per share have also steadily increased from $.71/share in 2001 to $1.27 in 2005 and $1.37/share in the TTM. The company also pays a dividend and has been steadily increasing the dividend from $.11/share in 2001 to $.26/share in 2005 and $.28/share in the TTM.
Also nice, the company has kept its shares stable with 61 million outstanding in 2001, 56 million in 2005, and 60 million in the TTM.
Free cash flow has been nicely positive with $86 million in 2003, $100 million in 2005 and $97 million in the TTM.
The balance sheet, as presented by Morningstar.com, appears gorgeous to me! The company is reported to have $81 million in cash and $377.5 million in other current assets giving a total of $458.5 million in total current assets. When compared to the $132.8 million in current liabilities this yields a current ratio of 3.45...with a ratio of 1.5 or higher being considered strong. The company is reported to have a nominal $60.1 million in long-term liabilities, easily covered by the current assets. The balance sheet looks quite strong to me.
4. What about valuation?
Reviewing the Yahoo "Key Statistics" on Wolverine, we see that this is a mid-cap stock with a market cap of $1.58 billion. The trailing p/e is a moderate 20.11, with a forward p/e (fye 31-Dec-07) of 17.53. The PEG is a reasonable 1.42. (Generally PEG ratios between 1.0 and 1.5 are acceptable to me).
Reviewing Fidelity.com eresearch for some more valuation numbers on this stock, WWW is in the "Textile-Apparel Footwear/ Accessories" industrial group. Compared to the other stocks in the group, WWW is reasonably priced with a Price/Sales ratio of 1.4. Leading this group is another favorite (and holding) of mine, Coach (COH) with a Price/Sales ratio of 7.2. They are followed by VOLCOM (VLCM) at 4.1, Nike (NKE) at 1.6, then Wolverine (WWW) at 1.4, and Timberland (TBL) at 1.3.
Insofar as one measure of profitability, Return on Equity (ROE) is concerned, Coach is actually the most profitable with a 40.1% ROE, followed by VOLCOM at 25.1%, Timberland at 21.8%, Nike at 21.5%, and Wolverine at the bottom of this group with a ROE of 17%.
Returning to Yahoo, we find that there are 55.66 million shares outstanding with 53.84 million that float. Currently, there are 2.38 million shares out short (10/10/06) representing 4.4% of the float or 4.5 trading days of volume. Using my "3 day rule" on short interest, this is somewhat significant and may be supporting the stock price in the event of any 'good' news. As already noted the company pays a dividend with a forward rate of $.30/share and an anticipated forward yield of 1.00%. The last stock split, as I noted above, was a 3:2 split on February 2, 2005.
5. What does the chart look like?
Reviewing the "Point and Figure" chart on Wolverine Worldwide (WWW) from StockCharts.com, we can see that the stock was grading sideways from 2001 into 2002, and broke out at around $10.50 in March, 2003, and then climbed very strongly to its current level around $28.40. The chart looks quite strong. I noted my first stock pick price and my purchase price on the chart below.
6. Summary: What do I still think about this stock?
Let me try to review some of the things I discussed above. First of all the stock is performing just fine trading within 10% of its all time high. The latest quarter was steady with growth in both revenue and earnings and found the company beating expectations on earnings and raising earnings guidance. Both are strong.
Longer-term, the company has been remarkably steady in raising revenue, increasing revenue, and paying an increasing dividend. All this while maintaining a steady number of outstanding shares and spinning off an adequate amount of free cash flow. The balance sheet looks superb with assets outweighing liabilities substantially. Valuation-wise the p/e is moderate with a PEG of about 1.5. The Price/Sales is quite cheap, although the return on equity (ROE) figure is less impressive. Finally, there are even a good number of short-sellers (who probably, and rightfully so, believe the chart looks a bit over-extended), however, with any good news, we may see a bit of a squeeze. In summary, I still like this stock. Now, of course I am biased as I am an owner of this, and I also remember my first pair of Hush Puppies years and years ago which I was crazy about....those light shoes with the fuzzy leather!
Thanks again for stopping by and visiting! If you have any comments or questions, please feel free to drop me a line at bobsadviceforstocks@lycos.com and be sure to visit my Stock Picks Podcast website where I discuss many of the stocks and strategies that I write about here on the blog.
Have a Happy Thanksgiving Weekend everyone!
Bob
Newer | Latest | Older


