Stock Picks Bob's Advice
Saturday, 27 January 2007
Abaxis (ABAX) "Revisiting a Stock Pick"
Hello Friends! Thanks so much for stopping by and visiting my blog, Stock Picks Bob's Advice! As always, please remember that I am an amateur investor, so please remember to consult with your professional investment advisors prior to making any investment decisions based on information on this website.
 I was looking through the list of top % gainers on the NASDAQ this afternoon and noted that an 'old favorite' of mine, Abaxis (ABAX), was one of the top % gainers, closing at $20.57, up $3.57 or 21% on the day.
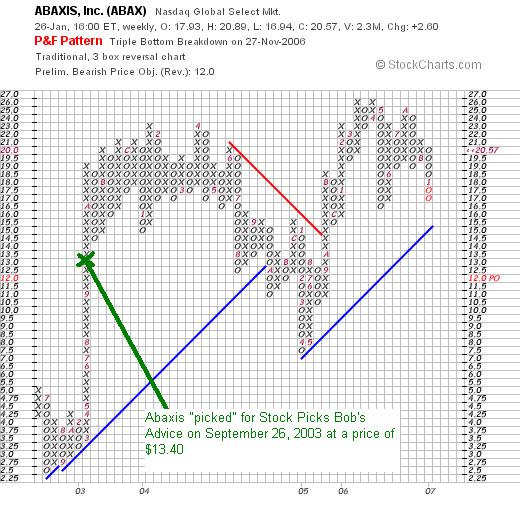
I first posted ABAXIS on Stock Picks Bob's Advice on September 26, 2003, when the stock was trading at $13.40. With today's close at $20.57, this represents an appreciation of $7.17 or 53.5% since posting. Looking through some of the underlying 'numbers' on the stock, it appears to still deserve a place on this blog. I do not own any shares or options on this stock. Let me review some of the recent information that I found.
What exactly does this company do?
According to the Abaxis "Profile" on Yahoo, the company
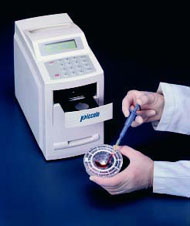 "...engages in the development, manufacture, and marketing of portable blood analysis systems for use in veterinary or human patient-care setting to provide clinicians with blood constituent measurements. Its primary product is blood analysis system, consisting of a 6.9 kilogram analyzer and a series of single-use plastic discs, called reagent discs that contain chemicals required to perform a panel of up to 13 tests on veterinary patients and 14 tests on human patients."
How did the company do in the latest quarter?
As is a common factor in many of the stocks making strong moves higher, it was the announcement of quarterly results which drove the stock higher on Friday. After the close of trading on Thursday, the company announced 3rd quarter 2007 results. For the quarter ended December 31, 2006, revenues came in at $22.0 million, up 26% over last year's $17.4 million. Net income was up nearly 50% at $7.3 million, compared with $5.2 million the year earlier. Diluted net income came in at $.13/share, up from $.09/share last year same period.
This earnings result beat expectations of $.12/share.
How have they done longer-term?
Looking at the Morningstar.com "5-Yr Restated" financials, we can see that revenue has grown steadily from $31 million in 2002 to $69 million in 2006 and $75 million in the trailing twelve months (TTM).
Earnings, initially a bit erratic, increasing from $.02/share in 2002 to $1.16/share in 2004, dipped to $.22/share in 2005 but then rebounded to $.35/share in 2006 and $.41/share in the TTM.
The company has increased its relatively small float, with 14 million shares reported in 2002, 20 million in 2006 and 21 million in the TTM. This represents a 50% increase in shares outstanding while revenue climbed 150% and earnings were up 2000%. This is an acceptable dilution relative to the other financial results imho. In addition, the dilution has slowed considerably the last few years.
Free cash flow has been positive and increasing the past few years. $6 million reported in 2004 and $7 million in 2006, $8 million in the TTM.
The balance sheet is solid with $35.9 million in cash reported by Morningstar. This is enough to pay off both the $9.5 million in current liabilities and the $1.6 million in long-term liabilities almost 3x over! In fact, if we calculate the current ratio, adding the $35.9 million in cash with the $29.5 million in other current assets resulting in a total of $65.4 million, which when compared to the $9.5 million in current liabilities yields a ratio of 6.9, one of the strongest current ratios on this entire blog.
What about some valuation numbers?
Reviewing the Yahoo "Key Statistics" on ABAX, we can see that this is a small cap stock with a market capitalization of only $427.03 million. The trailing p/e is a rich 51.68, but the earnings are increasing so quickly that the forward p/e (fye 31-Mar-08) is a much more reasonable 28.57. In fact the PEG (5 yr expected) is also a reasonable (between 1.0 and 1.5 is reasonable from my perspective) 1.34.
According to the Fidelity.com eresearch website, the company has a Price/Sales ratio (TTM) of 4.40, way below the industry average of 22.86. Unfortunately, in terms of profitability, as measured by the Return on Equity (ROE) (TTM), the company has a ROE of 11.82% below the industry average of 31.03%.
Finishing up with Yahoo, we can see that there are 20.76 million shares outstanding and 20.17 million that float. Interestingly, there are 2.56 million shares out short (as of 1/9/07) representing 12.8% of the float or 16.5 trading days of volume. Using my own 3 day rule for short interest, this is quite significant and would well explain today's sharp rise. In the face of strong earnings, the short-sellers were "squeezed" and as they rushed to cover their shorts by purchasing shares on the market, they likely pressured the stock higher---squeezing other short-sellers in the process. Just a guess, but it sure looks like a bit of a panic with that 21% rise today!
No stock dividend is reported and no stock splits are noted on Yahoo.
How about a chart?
If we look at a "Point & Figure" chart on Abaxis from StockCharts.com, we can see that the stock which traded as low as $2.50 in July, 2002, climbed sharply in 2003 to $21 by December. The stock pulled back during much of 2004 and early 2005 dipping to a low of $7.50 in April, 2005. Since then the stock has been moving higher to a high of $26 in April, 2006, only to pull back to the $16.50 level before now moving higher once again. It has been a volatile stock to watch!
Summary: What do I think?
Well, in a word, I still like this stock! They reported solid earnings yesterday exceeding expectations. They have been steadily increasing revenue. Although earnings have been a bit more erratic, they also have been growing their earnings steadily at least for the past 3 years. The company is spinning of nice free cash and has a very solid balance sheet. They have expanded their float somewhat but have grown revenue and especially earnings much faster.
Valuation-wise, the p/e is a bit rich (over 50) but the company is growing so fast that the PEG comes in at a nice 1.34. The Price/Sales is quite low for its group, although the ROE is a bit weaker than the average company as well. Finally, there are a lot of short-sellers on this stock and it is a set up for a squeeze. They had nearly 1.5 million shares traded today, still not enough volume to account for the 2.5+ million shares out short as of a couple of weeks ago! Thus, if the stock continues to show strength, there may be a bit of a panic among the short-sellers that have not covered yet. Just a guess.....but I guess that is a reasonable analysis. Finally, the chart, while a bit erratic....one could call it 'wide and loose',
In summary, this is the kind of company I would love to have in my own portfolio, but unfortunately, I don't have a buy signal to add a position and shall be 'sitting on my hands'.
Thanks so much for stopping by and visiting! If you have any comments or questions, please feel free to leave them on the blog or email me at bobsadviceforstocks@lycos.com. If you get a chance, please be sure and visit my Stock Picks Podcast Site where you can download an mp3 discussion of many of the same stocks I write about on the blog!
Have a great weekend everyone!
Bob
Posted by bobsadviceforstocks at 12:28 AM CST
|
Post Comment |
Permalink
Updated: Saturday, 27 January 2007 12:34 AM CST
Thursday, 25 January 2007
ValueWiki The Blog recognizes Stock Picks Bob's Advice!
A real big 'thank-you' to Jon and Zach, the writers of ValueWiki, who had some very kind words about yours truly and this blog. They wrote in their entry entitled "10 Great Finance Blogs Flying Under the Radar" and ranked this blog #1:
" 1 Bobsadviceforstocks.tripod.com/bobsadviceforstocks/
Bob Freedland does what every stock blog should do: thorough analysis of companies. Complete reports, week in and week out, since 2003. So many top-ranked Seeking Alpha contributors write pithy one paragraph blurbs about the iPhone, and so few take the time to do the kind of serious fundamental analysis Bob consistently churns out on new companies every single week. This is an impressive blog."
Thank you so much Jon and Zach! It is kind words like yours that keeps me going on this website. Wishing you the best of luck with your ValueWiki and I would encourage all of my readers to drop by and check out your site!
Bob
Ametek (AME)
Hello Friends! Thanks so much for stopping by and visiting my blog, Stock Picks Bob's Advice! As always, please remember to consult with your professional investment advisors as I am an amateur investor.
 Ametek (AME) is a stock that I intended to write up yesterday but frankly, I just never got around to doing it! The stock hit the NYSE top % gainers list yesterday, and after looking at some of the background on the company, I still believe it deserves a spot on the blog. Ametek closed today at $34.28, up $.11 or 0.32% on the day.
Let's take a closer look at this stock and I will try to show you why I like it!
What exactly does the company do?
 According to the Yahoo "Profile" on Ametek, the company
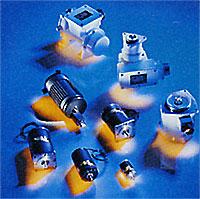
"...engages in the manufacture and marketing of electronic instruments and electromechanical devices worldwide. The company operates through two groups, the Electronic Instruments Group (EIG) and the Electromechanical Group (EMG)."
How did the company do in the latest quarter?
Yesterday, before the opening of trading on the NYSE, the company announced 4th quarter 2006 results. Sales for the quarter ended December 31, 2006, climbed 19% to $480.7 million from $403.8 million in the same quarter the prior year. Net income climbed 30% to $47.8 million or $.45/diluted share, up from $36.9 million or $.35/diluted share in the same quarter last year.
The company beat expectations of sales of $465 million and earnings of $.43/share. For fiscal year 2007, the company raised guidance on sales with indications for a 10% increase to $2 billion ahead of the current estimates of $1.93 billion. Estimates for net income were in line with current expectations of a 13-15% increase from 2006's $1.71/share to a range of $1.93 to $1.97/share.
I find earnings reports that are able to demonstrate increased revenue, increased earnings, beat expectations for both and manage to raise guidance as well are about as good an investor going long on a stock could hope for!
What about longer-term financial results?
Looking at the "5-Yr Restated" financials on Ametek (AME) on Morningstar.com, we find a beautiful picture of steadily increasing revenue. Revenue was $1.019 billion in 2001 and has increased each year to $1.43 billion in 2005 and $1.74 billion in the trailing twelve months (TTM).
Earnings during this period have also steadily increased from $.66/share in 2001 to $1.33/share in 2005, and $1.64 in the TTM.
The company also pays a small dividend which was $.08/share in 2001, and doubled to $.16/share in 2004 and has been $.16/share in the TTM as well.
Ametek has modestly increased its outstanding shares from 98 million in 2001 to 106 million in the TTM. This is approximately a 7% dilution while revenues increased about 65% and earnings were up more than 100%. This is a very tolerable level of stock dilution imho.
Free cash flow has also been positive and increasing from $138 million in 2003 to $143 million in 2005 and $190 million in the TTM.
Finally, the balance sheet is satisfactory with $58.5 million in cash and $601.0 million in other current assets. When compared to the $472.7 million in current liabilities, this works out to a current ratio of 1.4. Generally, I use a minimum of 1.25 to suggest good financial health. The company has another $626.5 million in long-term liabilities but with the solid and increasing free cash flow this doesn't appear to be a problem.
What about some valuation numbers for this stock?
According to the Yahoo "Key Statistics" on AME, this is a mid cap stock with a market capitalization of $3.63 Billion. The company has a trailing p/e of 20.93 with a forward p/e of 15.51. The PEG ratio is a very nice 1.25 (5 yr expected).
Using the Fidelity.com eresearch website, we find that the Price/Sales (TTM) is a reasonable 1.88 with an industry average of 11.31. The company appears to more profitable than most companies in its industry with a return on equity (ROE) (TTM) of 19.79 compared to an industry average of 18.79%. Thus, the company is relatively 'cheaper' than average as well as being slightly more 'profitable' than the average company in the same industry!
Finishing up with Yahoo, we can see that there are 105.86 million shares outstanding with 102.09 million that float. Currently there are 1.85 million shares out short representing 2.80% of the float (as of 12/12/06). This is also 5.4 trading days of volume (the short ratio). Using my own 3 day rule on short ratio, this is a bit of a heavy short interest and the stock price rise yesterday could well have been part of a 'squeeze' of the shorts.
The company currently pays a foward dividend of $.24/share yielding 0.7%. The last stock split was a 3:2 split on 11/28/06.
What does the chart look like?
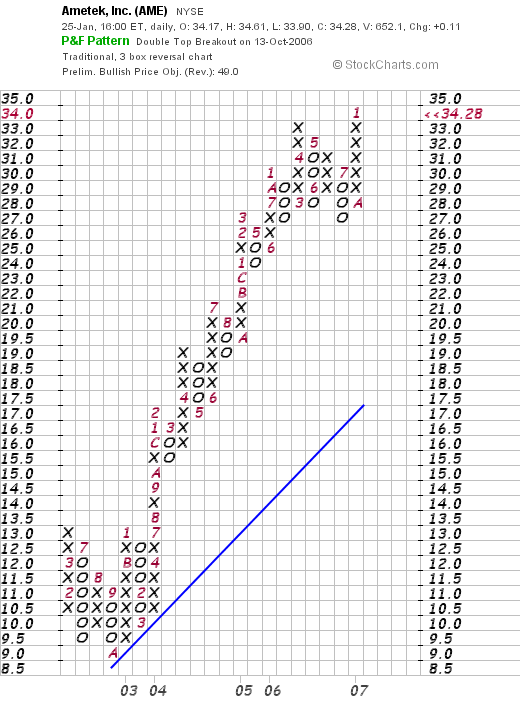
Examining the "point and figure" chart on Ametek from StockCharts.com, we actually can see a VERY strong chart which since pulling back to $9/share in October, 2002, has been on a tear, moving strongly higher without much of a 'rest'. The stock pulled back to $27 in July, 2006, and is currently pushing to new highs at the $34.28 level.
Summary: What do I think about this stock?
Quite frankly, I like this stock a lot! That is why I went back and posted Ametek today even though it hit the top % gainers list yesterday! Let's review a few of the things that I find attractive about Ametek. As negative, the stock is headquartered in Pennsylvania instead of my home state of Wisconsin...well you can't have everything :). But seriously, they reported quarterly results which were terrific, strong growth in revenue and earnings, beating expectation and raising guidance for revenue. On top of this, they have a strong record of doing similarly for the past 4-5 years. They pay a dividend which they have increased rercently, they have kept the # of shares outstanding fairly stable and have steadily increasing and positive free cash flow. Furthermore, the balance sheet looks solid.
Valuation-wise the p/e is relatively low and the forward p/e is in the mid-teens. The PEG at 1.25 is very reasonable. The Price/Sales is LOW for its group and the ROE is high. There are even a significant number of shares out short setting this stock up for a squeeze. Finally, the graph looks nice. Now, if only I had a buy signal to add this stock to my portfolio :(. Anyhow, that's a great one for the blog!
Thanks so much for stopping by and visiting. I hope that my comments are helpful to all of you! If you have any comments or questions, I look forward to hearing from you right on the blog or email me at bobsadviceforstocks@lycos.com. If you get a chance, drop by and listen to my Stock Picks Podcast which you can find on my Podcast Website!
Bob
Posted by bobsadviceforstocks at 8:57 PM CST
|
Post Comment |
Permalink
Updated: Thursday, 25 January 2007 8:59 PM CST
Tuesday, 23 January 2007
Twin Disc (TWIN)
Hello Friends! Thanks so much for stopping by and visiting my blog, Stock Picks Bob's Advice! As always, please remember that I am an amateur investor, so please remember to consult with your professional investment advisors prior to making any investment decisions based on information on this website.
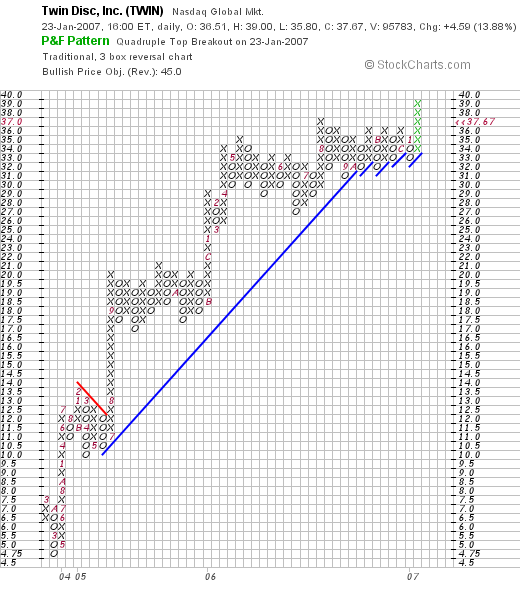
 Looking through the list of top % gainers on the NASDAQ this afternoon, I came across Twin Disc (TWIN) which closed at $37.67, up $4.59 or 13.88% on the day. I do not own any shares nor do I have any options on this stock. I do believe it deserves a spot on the blog and I will share with you my thinking.
What does this company do?
According to the Yahoo "Profile" on TWIN, the company
 "... engages in the design, manufacture, and sale of marine and heavy duty off-highway power transmission equipment primarily in the United States. Its products include marine transmissions, surface drives, propellers, and boat management systems, as well as power-shift transmissions, hydraulic torque converters, power take-offs, industrial clutches, and controls systems."
How did they do in the latest quarter?
It was actually the release of 2nd quarter 2007 results this morning that resulted in the big stock price appreciation today! For the quarter ended December 31, 2006, sales increased 30.1% to $74.2 million from $57.1 million in the same period last year. About 1/2 or $8.1 million in the sales improvement was attributable to a recent acquisition of the BCS Group. Net earnings for the quarter increased 127.8% to $5.7 million or $.96/diluted share, up from $2.5 million or $.42/diluted share in the same quarter in the 2006 fiscal year. The company also announced an increase in the quarterly dividend payment, payable in March by 15.8% to $.11/share.
How about longer-term results?
Reviewing the Morningstar.com "5-Yr Restated" financials on Twin Disc, we can see the recent strong financial performance of this company. Revenue which was $179 million in 2002 and $180 million in 2003, increased to $243 million in 2006. Earnings, which dropped from $.40/share in 2002 to a loss of $(.42)/share in 2003, then turned profitable at $.99/share in 2004, up to $2.43/share in 2006. The company paid a dividend of $.35/share which stayed stable through 2005 and increased in to $.37/share in 2006 and by the latest announcement will be increasing it for the 2007 fiscal year as well. Throughout this four-year period, the number of shares outstanding has been stable at 6 million.
Free cash flow which was $8 million in 2004, dropped to $1 million in 2005 before rebounding to $10 million in 2006.
The balance sheet, as reported on Morningstar, looks solid. The company has $16.4 million in cash and $134.7 million in other current assets. These combined current assets amount to $151.1 million, which when compared to the $79.6 million in current liabilities works out to a current ratio of 1.9. Ratios over 1.25 are generally considered healthy. The company has an additional $67.3 million in long-term liabilities.
What about some valuation numbers on this stock?
Looking at Yahoo "Key Statistics" on TWIN, we find that this is a small cap stock with a market capitalization of only $220.03 million. The trailing p/e is a very reasonable 14.35 (imho). Apparently there are no analysts out there with estimates going forward as there are no numbers for a forward p/e and no PEG ratio reported on Yahoo.
Fidelity.com eresearch website also confirms the reasonable valuation of this stock which has a Price/Sales (TTM) ratio of 0.75, well below the industry average of 1.38. Insofar as profitability is concerned, Fidelity reports TWIN with a Return on Equity (TTM) of 19.19%, slightly below the industry average of 21.93%.
Finishing up with Yahoo we find that there are actually 5.84 million shares outstanding with only 4.57 million that float. Currently, as of 12/12/06, there are 62,870 shares out short representing 1.4% of the float or 4 trading days of volume (the short ratio).
The forward dividend is $.38, yielding 1.10%. The company last split its stock on April 3, 2006, with a 2:1 stock split.
What does the chart look like?
Reviewing the StockCharts.com "Point & Figure" graph on Twin Disc (TWIN), we can see a very strong chart with the stock price moving from the $4.75 level in March, 2003, to the $35 level in May, 2006. The stock broke through recent highs with its move today and may well be poised to move higher once again.
Summary: What do I think about this stock?
First of all, I am happy to be presenting another great Wisconsin manufacturing story. We have had some great stocks from the Midwest! Let me review a few of the things I discussed above. First of all, the stock moved strongly higher today on a great earnings report. Even though much of the positive results is due to an acquisition, the nice part is that the company showed solid growth in the non-acquired portion of the company, and that the acquisition was actually accretive to earnings.
The company has been growing steadily the past few years and has even managed to pay a dividend which they announced they were increasing. Valuation looks good with a p/e under 15, an a Price/Sales ratio low for its group. I do have some concern about the volatility often encountered with tiny companies, however, tiny companies doing well may have rather meteoric price appreciations as institutions and "big money" tries to move into a very small window of opportunity.
Finally, the stock chart looks remarkably strong as the company appears to breaking out from prior price ranges into new higher territory.
Thanks again for visiting! If you have any comments or questions, please feel free to leave them on the blog or email me at bobsadviceforstocks@lycos.com. Also, remember to stop by and visit my Stock Picks Podcast website.
Bob
A Reader Writes "...it is almost impossible to beat the market"
Hello Friends! Thanks so much for stopping by and visiting my blog, Stock Picks Bob's Advice! As always, please remember that I am an amateur investor, so please remember to consult with your professional investment advisors prior to making any investment decisions based on information on this website.
 I had the pleasure of getting a comment from a very important reader of my blog, my son Ben, who is also is a very critical thinker. I am proud that he is willing to think out loud and challenge even his poor dad who is blogging away at picking stocks :).
Ben writes:
"Two comments:
- I'm curious what you think about this slate.com article which attempts to show that after costs, it is almost impossible to beat the market: http://www.slate.com/id/2158085/
- With that 23% gain on Oakley, I recommend selling a chunk of your position and purchasing a pair of glasses for yourself. If you don't wear sunglasses, I'm sure your son will love them!
Go Devils!
-Ben
Let me try to answer your astute question. I very much enjoyed the link and would encourage all of my readers to also review that article which challenges conventional stock-picking ideas.
Perhaps just as interesting is Mr. Blodget's history that I found summarized well in Wikipedia:
"Henry Blodget's predictions made him one of the most influential stock marketeers of the time. In December 1998, his unprecedented prediction that Amazon.com's stock price would hit $400 landed him a prized position at Merrill Lynch. In early 2000, days before the dot-com bubble burst, Blodget personally invested $700,000 in tech stocks, only to lose it most of it in the years that followed. By 2001, he accepted a buyout offer from Merrill Lynch and left the firm. By 2002, Eliot Spitzer had published Merrill Lynch e-mails which gave the public the graphic examples of an alleged fraud behind certain analysts' published stock recommendations. In 2003, he was charged with civil securities fraud by the U.S. Securities and Exchange Commission. He settled without admitting or denying the allegations and is banned from the securities industry for life"
But I do not want to "shoot the messenger". Mr. Blodget is an intelligent and experienced 'stock-picker' himself. And his experience is something we can all learn from.
Quite frankly, I do not know if I can beat the market in my pursuit of stock picks. And you know how scrupulously honest I try to be in all of my writing on this blog. I pride myself in transparency; letting people know which stocks I own, when I trade, and whether I hold shares in stocks I discuss. I don't know how to do this any better. I personally do not ever want to mislead anyone.
I believe it is possible to do better than the market in picking stocks and managing a portfolio. I believe this is possible because for one thing, not everyone does believe that it is possible--any many investors are happy to invest in broad index investments that create baskets of different stocks.
My particular approach is designed to reduce my own attempt at thinking about which stocks are good or bad. I let the market present these stocks to me. This is what I call my "zen" of investing approach. It isn't magical; it simply requires me to observe what stocks are rising the most and evaluating them on some fundamental financial figures that I, also not a certified financial planner, can understand and explain to readers.
When managing my portfolio, I do not ever think I know which stock I should be holding and which I should be selling.
Again, I allow the stock price movement to determine that for me. I operate under the philosophy if I aggressively sell my losing stocks, and meekly sell my gaining stocks, that bias will result in a winning portfolio. Time will tell if I am right.
Also, in portfolio management, I allow my own portfolio to determine my stance in the market. If my stocks are doing well, then I use my stock performance to indicate to me to increase my exposure to equities by adding a new position. Likewise, if they are doing poorly, I allow the sales on losses to tell me to 'sit on my hands'.
Is this the best way? Is this going to be successful? I don't really know. I guess that is why I blog. Because I believe I am onto something very important. I cannot do this privately, it is the effort of publishing my thinking and documenting my trading publicly that will verify my approach.
And if I am successful, then maybe I shall have the money to buy you a new pair of Oakley's. How about for graduation from Duke? Or are you still going to go for the 'set of wheels'?
Bob Freedland
(Ben's Dad)
Posted by bobsadviceforstocks at 3:21 PM CST
|
Post Comment |
Permalink
Updated: Tuesday, 23 January 2007 3:25 PM CST
Sunday, 21 January 2007
"Looking Back One Year" A review of stock picks from the week of September 12, 2005

Hello Friends! Thanks so much for stopping by and visiting my blog, Stock Picks Bob's Advice! As always, please remember that I am an amateur investor, so please remember to consult with your professional investment advisors prior to making any investment decisions based on information on this website.
The weekend is almost over. Earlier today I had this entry almost completely finished and if you can believe it (it is true) I started closing windows looking for a chart I had downloaded on my desktop, and as you would figure, I closed the rough draft before I had published it....so let's start from scratch on this one once again. Come on guys, when I tell you I am an amateur, well you ought to believe it!
If you are new to the blog, well, make yourself at home and look around. What I like to do on the blog is pick stocks (what else did you think?) and as a matter of honesty, and straight-forwardness (is that a word?), I like to take some time each weekend and look back a year and find out how those particular stocks turned out. This analysis assumes a "buy and hold" approach to investing with equal dollar amounts being purchased of the stocks discussed. In reality, I practice and advocate a disciplined portfolio management that directs me to sell losing stocks quickly on small losses and to sell gaining stocks slowly and partially at targeted appreciation levels.
Let's take a look at the stocks I discussed during the week of September 12, 2005, and find out how they would have turned out if they were indeed purchased!
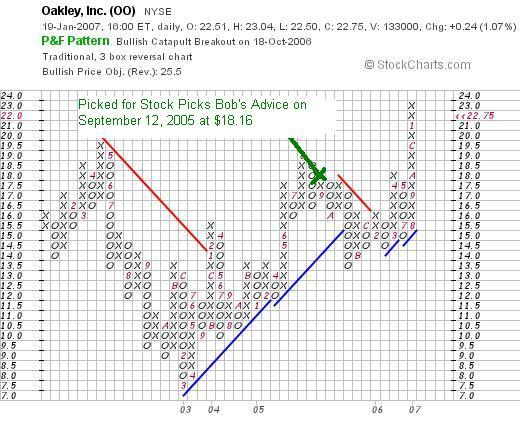
 On September 12, 2005, I posted Oakley (OO) on Stock Picks Bob's Advice at a price of $18.16. Oakley closed at $22.75 on January 19, 2007, for an effective stock pick gain of $4.59 or 25.3%.
 On October 19, 2006, Oakley reported 3rd quarter 2006 results. For the quarter ended September 30, 2006, net sales increased 21.2% to $210.2 million, up from $173.4 million in the same quarter last year. Net income came in at $17.3 million or $.25/diluted share, up from $16.1 million or $.23/diluted share the prior year same period.
Oakley (OO) beat expectations of $.22/share earnings on revenue of $192 million. In addition, the company raised guidance for revenue growth to 15 to 17% from prior guidance of an increase of 13%. Thus, the company showed strong revenue growth, earnings growth, beat expectations, and raised guidance. Everything contributing to what I call a "trifecta-plus" in earnings reports!
Here is the chart showing recent price activity and identifying my "pick" point:

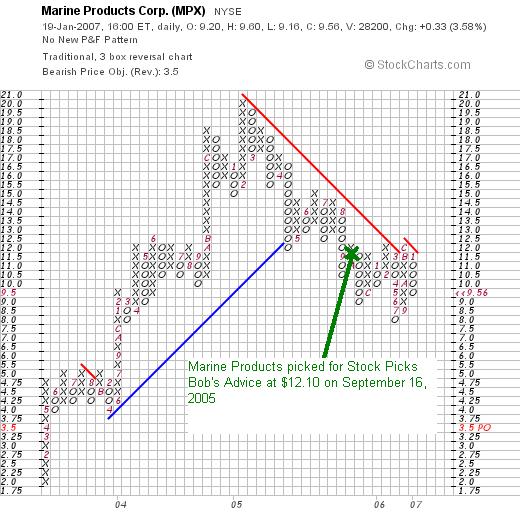
On September 16, 2005, I posted Marine Products (MPX) on Stock Picks Bob's Advice when it was trading at $12.10. MPX closed at $9.58 on January 19, 2007, for a loss of $(2.52) or (20.8)% since posting.
 On October 25, 2006, Marine Products announced 3rd quarter 2006 results. For the quarter ended September 30, 2006, Marine Products reported net sales of $64.0 million a 1.6% decrease compared to the $65.0 million in the same quarter last year. Net income was $4.6 million a 37.2% decrease from the $7.3 million reported in the same period last year.
If we look at the chart on Marine Products from StockCharts.com, and my point of entry, you can see that I did pick the stock when it was already showing some technical weakness. Clearly I need to look closer at these charts as I present stocks. Perhaps this one could have been avoided (?).
Well how did I do in that week in September, 2005, with these two 'picks'. Basically it was a wash with one stock moving higher and the other lower. In fact, the average performance of these two stocks was a gain of 2.25%.
Thanks so much for stopping by and visiting my blog! If you have any comments or questions, please feel free to leave them on the blog or email me at bobsadviceforstocks@lycos.com. If you get a chance, be sure and visit my Stock Picks Podcast Website where I discuss some of the many stocks I write about right here!
Have a great week trading everyone!
Bob
Friday, 19 January 2007
Schlumberger Limited (SLB)
Hello Friends! Thanks so much for stopping by and visiting my blog, Stock Picks Bob's Advice! As always, please remember that I am an amateur investor, so please remember to consult with your professional investment advisors prior to making any investment decisions based on information on this website.
TGIF. It sure is great getting to Friday with the weekend ahead!
I was looking through the list of top % gainers on the NYSE this evening and came across Schlumberger Limited (SLB) which closed at $61.00, up $3.10 or 5.35% on the day. I do not own any shares or options on this stock, although my wife does own about 60 shares of SLB in her IRA account.
Let's take a closer look at SLB and I will try to walk you through some of the reasons why I believe it deserves a place on this website.
What exactly does this company do?
 According to the Yahoo "Profile" on Schlumberger, the company
"...operates as an oilfield services company in the United States and internationally. It operates in two segments, Schlumberger Oilfield Services and WesternGeco. Schlumberger Oilfield Services segment provides technology, project management, and information solutions to the petroleum industry. This segment offers exploration and production services, such as drilling and measurement; well completions and productivity; data and consulting; and well services required during the life of an oil and gas reservoir. WesternGeco segment provides reservoir imaging, monitoring, and development services. This segment�s services range from 3D and time-lapse (4D) seismic surveys to multicomponent surveys for delineating prospects and reservoir management."
How did they do in the latest quarter?
It was the announcement of 4th quarter 2006 results that drove the stock higher on Friday. Revenue for the fourth quarter ended December 31, 2006, increased 33% to $5.35 billion from $4.02 billion in the same quarter the prior year. Additionally, the company reported an 8% sequential increase from $4.95 billion in revenue reported in the preceding quarter. Net income was also up sharply at $1.13 billion, compared to $660.6 million in the prior year same period. On a per share diluted basis this came in at $.92/share, up sharply from $.54/diluted share last year.
Importantly, the company beat expectations on both revenue and earnings. According to Thomson First Call, analysts expected earnings of $.85/share on revenue of $5.14 billion.
How about longer-term results?
Reviewing the Morningstar.com "5-Yr Restated" financials on Schlumberger shows how revenue actually dropped from $10.9 billion in 2001 to $9.7 billion in 2002. However, since that year, revenue has steadily increased to $14.3 billion in 2005 and $17.9 billion in the trailing twelve months (TTM).
Earnings also dipped that same year from $.46/share in 2001 to a loss of $(3.99)/share in 2002. However, by 2003, the company was once again profitable reporting $.33/share in earnings, growing that to $1.82/share in 2005 and $2.63/share in the TTM.
During this period of apparent restructuring, the company also initially decreased the number of shares outstanding from 740 million in 2001 to 579 million in 2002. However, by 2003 the company has 1.16 billion shares outstanding. This number has held stable with 1.18 billion shares outstanding in 2005 and the TTM.
Schlumberger is a veritable cash machine, with $1.1 billion in free cash flow in 2003, dropping to $630 million before increasing to $1.4 billion in 2005 and $2.1 billion in the trailing twelve months.
The balance sheet appears reasonable with $1.9 billion in cash and $6.09 billion in other current assets. This is balanced against the $6.2 billion in current liabilities and $4.9 billion in long-term liabilities. The current ratio works out to a satisfactory 1.28.
What about some valuation numbers?
Schlumberger is certainly a large cap stock with a market capitalization of $71.87 billion according to Yahoo "Key Statistics". The trailing p/e is a moderate 23.16, and the company is growing so quickly that the forward p/e (fye 31-Dec-07) works out to a nice 13.44. The PEG ratio (5 yr expected) is reported at 0.66. Generally PEG ratios between 1.0 and 1.5 are reasonable. Under 1.0 is 'cheap' and over 1.5 may be considered to be a rich valuation.
According to the Fidelity.com eresearch website, the Price/Sales (TTM) works out to 3.74, slightly higher than the industry average of 3.16. Fidelity goes on to show that the Return on Equity (TTM) is at 39.87%, higher than the industry average of 30.89%.
Finishing up with Yahoo, we can see that there are 1.18 billion shares outstanding with 1.14 billion that float. Currently as of 12/12/06, there are 26.21 million shares out short, representing 2.3% of the float or a short ratio of 3.3.
The company pays a forward annual dividend of $.50/share, yielding 0.8%. The company last had a 2:1 stock split on April 10, 2006.
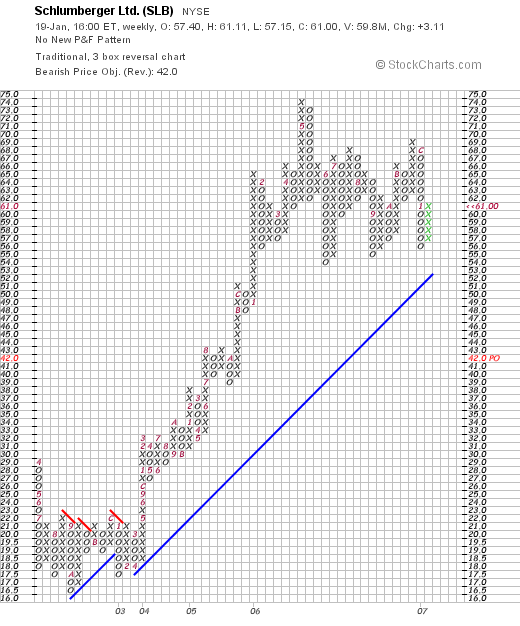
What does the chart look like?
Reviewing the StockCharts.com "Point & Figure" chart on Schlumberger, we can see that the stock traded beteween $29 and $17 between 2002 and 2004. In early 2004, the stock moved higher climbing as high as $74/share in May, 2006. Since that time the stock has traded in a tight range between $55 and $70. The stock price has come back to the 'support line' and appears poised to move higher. Note the series of higher short-term lows.
Summary: What do I think about this stock?
Please note that my wife does have a few shares (less than 100) in a retirement account. But besides that, the company reported a strong quarter on Friday. The company is confident it can handle any decline in the price of oil, but certainly that will affect exploration activity. Otherwise, besides the possibile cyclical nature of the oil business, this is a very pretty picture with strongly growing revenue, earnings, and stable stock shares. Valuation appears reasonable with a p/e in the low 20's and a PEG under 1.0. Finally the chart does not appear overextended. Even though this is a large cap stock, I like this company and will keep it in my vocabulary of investment possibilities.
Thanks again for stopping by and visiting! If you have any comments or questions, please feel free to email me at bobsadviceforstocks@lycos.com or go ahead and leave your comments right on the blog. If you get a chance, stop by and visit my Stock Picks podcast site.
Bob
Posted by bobsadviceforstocks at 9:22 PM CST
|
Post Comment |
Permalink
Updated: Sunday, 21 January 2007 1:36 PM CST
Tuesday, 16 January 2007
Stantec (SXC)
Hello Friends! Thanks so much for stopping by and visiting my blog, Stock Picks Bob's Advice! As always, please remember that I am an amateur investor, so please remember to consult with your professional investment advisors prior to making any investment decision based on information on this website.
 This afternoon, I was looking through the list of top % gainers on the NYSE and came across a name that I had noticed once before on the list a week or two back, Stantec (SXC) which, as I write, is trading at $23.29, up $1.65 or 7.62% on the day. I do not own any shares or options on this company. Let me try to review a few of the things that led me to pick this stock this afternoon for this review.
What does this company do?
 According to the Yahoo "Profile" on Stantec, this Edmonton, Alberta-based company
"...provides consulting planning, engineering, architecture, interior design, landscape architecture, surveying and geomatics, environmental sciences, project management, and project economics services for infrastructure and facilities projects in North America."
How did it do in the latest quarter?
On November 2, 2006, Stantec reported 3rd quarter 2006 results. Gross revenue for the quarter ended September 30, 2006, increased 43.9% to C$210.2 million from C$146.1 million in the same period in 2005. Diluted earnings increased 12.5% to C$.36 vs $.32 in the same 2005 quarter. Apparently the company has issued some additional shares causing some dilution of earnings. As the report relates, "Earnings per share reflect an additional 5.9 million average number of shares outstanding compared to the third quarter of 2005."
What about longer-term results?
Checking the Morningstar.com "5-Yr Restated" financials on Stantec, we find that revenue, which was $276 million in 2003, increased to $345.9 million in 2004 and $433.5 million in 2005. Earnings per share during this period have increased from $.46/share in 2003 to $.82/share in 2005. Shares outstanding have also increased from 37 million in 2003 to 40 million in 2005 and 45 million in the trailing twelve months (TTM).
Free cash flow, which was a negative $(8) million in 2003 turned positive at $46 million in 2004 and was $33 million in 2005.
The balance sheet on Morningstar.com appears adequate with $24.1 million in cash and $215.6 milllion in other current assets. This is enough to cover both the $134.9 million in current assets in addition to the $105.1 million in long-term debt combined. Calculating the current ratio, we get a figure of 1.78, suggesting adequate current assets to cover current liabilities with assets to spare.
What about some 'valuation' numbers?
Looking at Yahoo "Key Statistics" on SXC, we find that this is a mid cap stock with a market capitalization of $1.04 billion. The trailing p/e is a moderate 23.39, no forward p/e and no PEG is reported.
Yahoo reports the company with a Price/Sales ratio of 1.66.
There are 45.08 million shares outstanding with 42.97 million that float. As of 12/12/06, there were 14,390 shares out short representing 1 day of trading of average volume (the short ratio). No dividend is paid and the stock split 2:1 as recently as May 31, 2006.
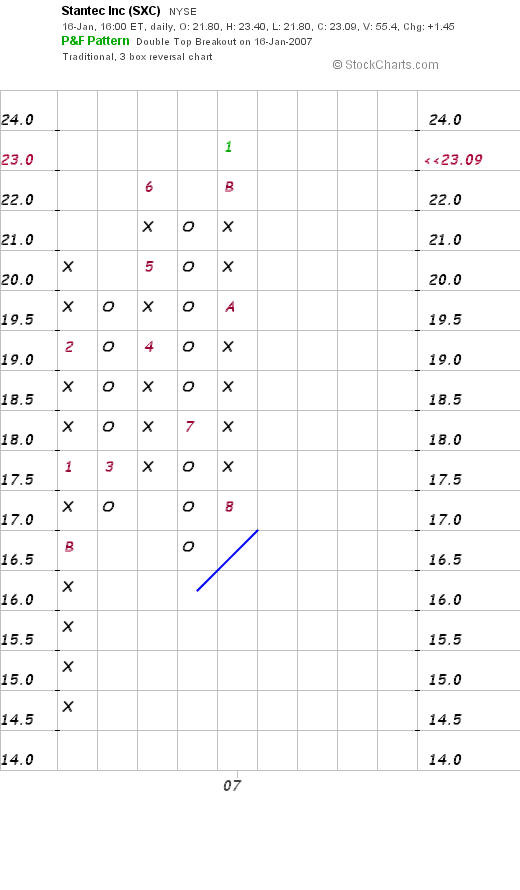
What does the chart look like?
Looking at a "Point & Figure" chart on Stantec, we can see a fairly short period of trading but the chart looks adequately strong considering the duration.
Summary: What do I think?
This is an interesting Canadian company in the consulting business with nice numbers being reported. They had a great quarter and the Morningstar.com site shows the fairly steady revenue and earnings growth, the positive free cash flow, and the reasonable balance sheet. Valuation analysis is limited, as I don't have a PEG on the stock nor a forward p/e. Fidelity.com doesn't help me with any ROE or Price/Sales comparison. But the chart is good.
I probably wouldn't be personally jumping in on this stock if I did have the "permission" to add a new position only because of the difficulty getting all of the data I like to have to evaluate a stock. But so many of the other numbers and information is encouraging, that I believe this stock should be in the "vocabulary" of this blog. Perhaps to be acquired at a future date!
Thanks again for stopping by and visitiing! If you have any comments or questions, please feel free to leave them on the blog or email me at bobsadviceforstocks@lycos.com. Also, be sure and visit my Stock Picks Podcast Site.
Bob
Saturday, 13 January 2007
J2 Global Communications (JCOM)
Hello Friends! Thanks so much for stopping by and visiting my blog, Stock Picks Bob's Advice! As always, please remember that I am an amateur investor, so please remember to consult with your professional investment advisors prior to making any investment decisions based on information on this website.

Last month I started a new discussion called "Long-Term Review", which was my way of doing a really long-term review of past stock picks, in fact going back to my first picks in 2003. I would like to continue to go through my early picks discussing each one that is still publicly traded (many have been acquired by other companies). I will try to go through the same regimen as I have with other stock discussions, pointing out what the company does, what the stock price closed at, how the longer-term financials appear, and some valuation information as well as a chart. All of these analyses again depend on 'buy and hold' strategies, instead of the disciplined trading approach that I employ and advocate for in my blog.
 On May 14, 2003, writing up my second stock selection for this blog, I wrote about J2 Global Communications:
"May 14, 2003 j2 Global Communications
Scanning those most active lists again today...not much luck until we got to j2 Global Communications. I do not at this time own any share of this stock. It is about 11:30 am Central time here in Wisconsin. Last quarter revenues rose 47% to $15.2 Million (a small company!) Net Income rose to $5 million up from $1.5 million the year earlier. According to CNN.money....j2 Global Communications "provides outsourced messaging and communications services to businesses and individuals throughout the world." I am not sure exactly what they do (!) but they are making money and this is certainly NOT a Peter Lynch approach of I 'saw it at the mall'.
Looking at Morningstar.com, under 5 year financials, this choice is clinched. We see revenue of 0.7 Million in 1997, 3.5 million in 1998, 7.6 million in 1999, 13.9 million in 2000 and 33.3 million in 2001. Trailing 12 months is 43.8 million. These bar graphs are a beauty to behold! In the past 12 months the company has turned profitable. They have sequential earnings and revenue growth...and are starting to generate free cash flow. Thus, the choice to be posted today! Good luck investing....Bob"
Looking through this post, you can see how 'green' I was, and didn't even record the price. The highest price for that day can be found on Big Charts and was $8.92. JCOM closed at $25.71 on 1/12/07, for an effective stock pick price appreciation of $16.79 or 188.2% since posting almost 4 years ago. Unfortunately, I don't own any shares or options on this stock and haven't participated in this stock rise by owning shares.
What does this company do?
According to the Yahoo "Profile" on JCOM, the company
"...provides outsourced, value added messaging and communications services to individuals and businesses worldwide. It offers an array of faxing solutions, including Web-based fax and fax broadcasting at eFax.com; and a suite of unified communications services, including fax, Web-based voicemail, and conference calling at j2.com; as well as a conference calling service to its business services at consensus.com and a unified communications service through Onebox.com."
How did they do in the latest quarter?
On August 1, 2006, the company reported 2nd quarter 2006 results. Quarterly revenue rose 27% to $44.4 million vs. $34.9 million. Earnings came in at $13.1 million up from $11.7 million last year or $.26/share, up from $.23/share in the prior year. More recently, the stock has been under some dark clouds for being late with filing 3rd quarter results and recently reported that they would be taking a $3.5 million charge related to stock option grants and that revenue forecasts would be slightly under expectations.
How about longer-term?
Looking at the latest Morningstar.com "5-Yr Restated" financials on JCOM, we can see that the growth in this stock is still unchecked. They had revenue of $33.3 million in 2001, increased this to $143.9 million in 2005 and $153.7 million in the trailing twelve months (TTM).
Earnings, which were a loss of $(.17)/share in 2001, turned profitable at $.30/share in 2002, and have more than tripled to $1.00/share in 2005 and $1.04/share in the TTM. (all of these results are subject to some small revisions due to accounting issues noted above.)
The company has a fairly stable number of shares outstanding with 45 million reported in 2001, increasing to 48 million in 2005 and 50 million in the TTM. This is about an 11% increase in outstanding shares during a period in which revenue increased almost 400% and earnings were up over 200%. This is certainly what I would call a compeltely acceptable level of earnings dilution.
Free cash flow has been positive and growing with $29 million in 2003, increasing to $55 million in 2005 and $63 million in the TTM.
The balance sheet is absolutely gorgeous with $139.8 million in cash, enough to cover both the $21.8 million in current liabilities and the $.2 million in long-term liabilities combined about 6x over! The actual current ratio, including the $13.9 million in other current assets works out to a very strong (one of the strongest figures on this entire blog!) of 7.05.
What about valuation?
Looking at the Yahoo "Key Statistics" on J2 we find that JCOM is a mid cap stock with a market capitalization of $1.27 billion. The trailing p/e is a moderate 24.10 with a forward p/e estimated (fye 31-Dec-07) at 18.50. With the rapid growth in earnings expected the PEG ratio is reported (5 yr expected) at 0.96. Valuation between 1 and 1.5 is nice. Below 1 is excellent in terms of valuation for a growth investor.
According to the Fidelity.com eresearch website, the company has a Price/Sales (TTM) of 7.67, well below the industry average of 12.16. The company is also more profitable than the average company in its industry with a Return on Equity (TTM) of 25.75% compared to the average of 10.94% in its industry.
Finishing up with Yahoo, we find that there are 49.35 million shares outstanding with 47.75 million that float. Currently there are 6.14 million shares out short (12/12/06) representing 12.8% of the float or 15 trading days of average volume (the short ratio). Using my own particular '3 day rule', this is quite significant, and if the company can get some good news, there well could be a bit of a squeeze of the shorts. However, further 'bad news' could confirm the shorts negative views.
No dividends are paid and the last stock split was a 2:1 on May 25, 2006.
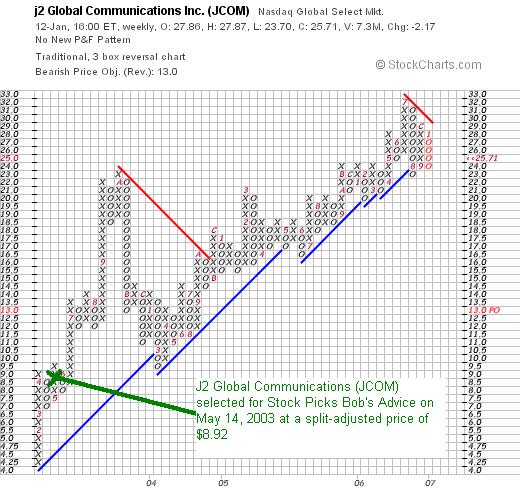
What does the chart look like?
If we review a "Point & Figure" chart on JCOM from StockCharts.com we can see that the stock has been a fairly steady and strong performer increasing from a low of $4.25 in January, 2003, to a high of $32 in July, 2006. The stock has consolidated since and is threatening to break through support levels on the downside where it is trading at this time.
Summary: What do I think?
This sure was a great second stock pick for the blog! I am currently concerned about some of the clouds regarding accounting issues before I could advocate adding a position of JCOM to my own portfolio. The Morningstar.com report is impressive, especially the strong financial position reported. The graph and valuation numbers are also excellent with a PEG under 1.0, Price/Sales low for its group, and ROE high for its group.
Thanks so much for stopping by and visiting my blog. If you have any comments or questions, please feel free to leave them on the blog or email me at bobsadviceforstocks@lycos.com. Please always remember that I am an amateur and that past performance is no guarantee for future stock price performance! Have a great weekend everyone!
Bob
"Looking Back One Year" A review of stock picks from the week of September 5, 2005
Hello Friends! Thanks so much for stopping by and visiting my blog, Stock Picks Bob's Advice! As always, please remember that I am an amateur investor, so please remember to consult with your professional investment advisors prior to making any investment decisions based on information on this website.

It is the weekend (at last!) and time to look back at stock picks from the past. I have been asked why I say looking back a year and then go back and review a year and a quarter or so.....well the answer is obvious. I am an amateur, and although I started out reviewing each weekend, well you know how that goes....some weekends I really do get so busy I cannot blog! And then it is a little more than a year. And so on.
While this blog is somewhat disorganized and virtually a flow of consciousness sometimes, there really is a method to all of this madness. If you are new to the blog, I apologize so bear with me. What I am trying to accomplish is to simultaneous present stocks that with my own peculiar screening techniques, appear to be 'investable'. I call these my 'vocabulary' of stocks. It is from these stocks that I am building my own portfolio.
And that is another task for me. Using my own techniques to build an actual trading portfolio that I share with you the reader. And sharing with you my thinking, my rationale, my successes and my failures.
Scattered among these posts and thoughts I have been developing a very disciplined trading strategy that allows me to decide when to buy, when to sell, and when to simply 'sit on my hands'. So all of these posts and comments are simultaneously being done on the blog. Please do email me at bobsadviceforstocks@lycos.com if you have any comments or questions. I try to read every email I receive and comment on most. But if you do write or comment, please be sure to give me at least a first name and a geographic area. It makes everything more personal and interesting.
But back to today's post. Last week I reviewed the stocks from the week of August 29, 2005. Going to the next week, let's spend some time looking at the ideas I was generating here on the blog during the week of September 5, 2005.
This review assumes a "buy and hold" strategy with equal $'s being invested in each of the stocks discussed. However, in practice, I employ a very disciplined selling technique that cuts losses quickly at 8% levels and directs me to sell portions of my existing holdings as they appreciate and reach pre-set targeted levels. This certainly would affect actual performance but for the sake of this analysis, it is easier to simply evaluate past stock picks without assuming any trading response to price change at all.
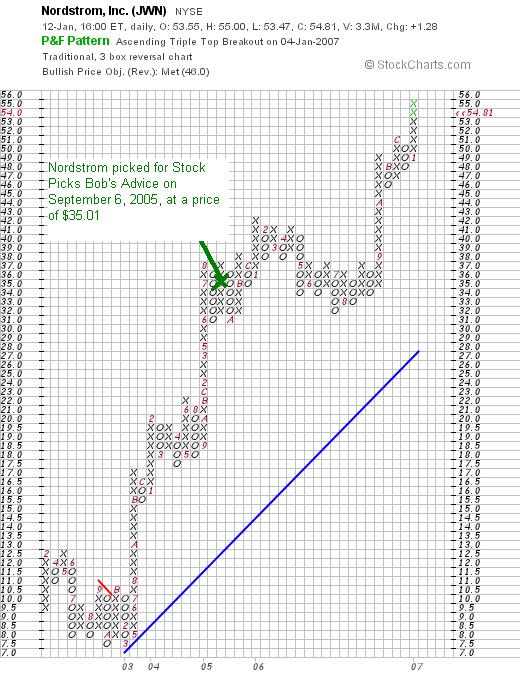
 On September 6, 2005, I posted Nordstrom (JWN) on Stock Picks Bob's Advice when it was trading at $35.01. Nordstrom closed at $54.82 on January 12, 2007, for a gain of $19.81 or 56.6% since posting.
On November 20, 2006, Nordstrom reported 3rd quarter 2006 results. Total sales for the third quarter of 2006 ended October 28, 2006, increased 12.4% to $1.9 billion, compared to sales of $1.7 billion in the same quarter last year. Same-store sales for the quarter climbed a strong 10.7%. Net earnings came in at $135.7 million or $.52/diluted share up from $107.5 million or $.39/diluted share last year. This was a very strong report!
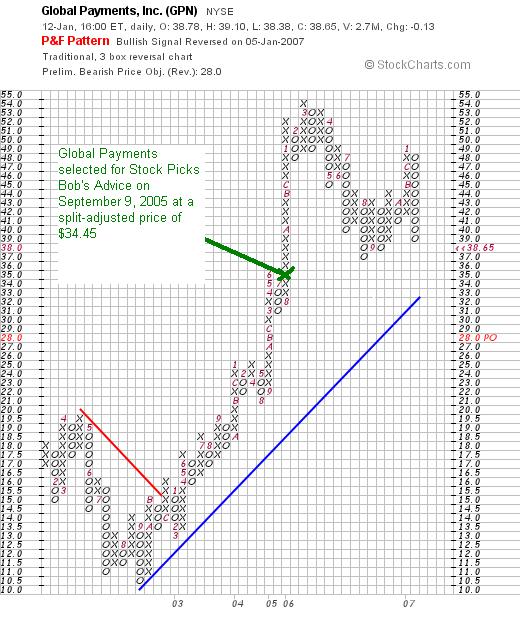
 On September 9, 2005, I posted Global Payments on Stock Picks Bob's Advice when the stock was trading at $68.89. Global Payments (GPN) had a 2:1 stock split on October 31, 2005, giving me an effective 'pick price' of $34.45. GPN closed at $38.65 on January 12, 2007, for a gain of $4.20 or 12.2% since posting.
On January 5, 2007, GPN reported 2nd quarter 2007 results. For the quarter ended November 30, 2006, revenue increased 19% to $260.7 million from $219.7 million in the prior year same period. GAAP earnings per share came in at $.42/share, up from $.37/share the prior year. The company spent some time sorting out the effect of accounting for options expenses which otherwise would have had the company coming in at $.44/share, but I shall stick with GAAP (generally accepted accounting principles) for the purpose of this blog.
The company did put a damper on future expectations, a bearish inclusion, stating:
"Based on our first half results and our second half expectations, we are reaffirming the low end of our annual fiscal 2007 revenue guidance of $1,057 million, and reducing the high end of this guidance to $1,069 million. This revenue guidance reflects an expected 16 percent to 18 percent growth versus $908 million in fiscal 2006."
The stock price sold off with this announcement which lowered rather than raised guidance.
So how did I do for these two stocks during that week in September, 2005? In a word 'great'! Both stocks appreciated with Nordstrom showing the stronger gain. The average performance for the two stocks was a gain of 34.4%.
Thanks again for visiting! Please remember that I am an amateur and that past performance is certainly no guarantee for future performance! If you have any comments or questions, I look forward to receiving them at bobsadviceforstocks@lycos.com and also feel free to leave them right on the blog! If you get a chance, be sure and visit my Stock Picks Podcast Site.
Bob
Newer | Latest | Older


